. 2020 Sep 1;32(3):447-456.e6.
doi: 10.1016/j.cmet.2020.08.004.

Alpha-Ketoglutarate, an Endogenous Metabolite, Extends Lifespan and Compresses Morbidity in Aging Mice

Affiliations

Alpha-Ketoglutarate, an Endogenous Metabolite, Extends Lifespan and Compresses Morbidity in Aging Mice

Azar Asadi Shahmirzadi et al. Cell Metab. .

Abstract

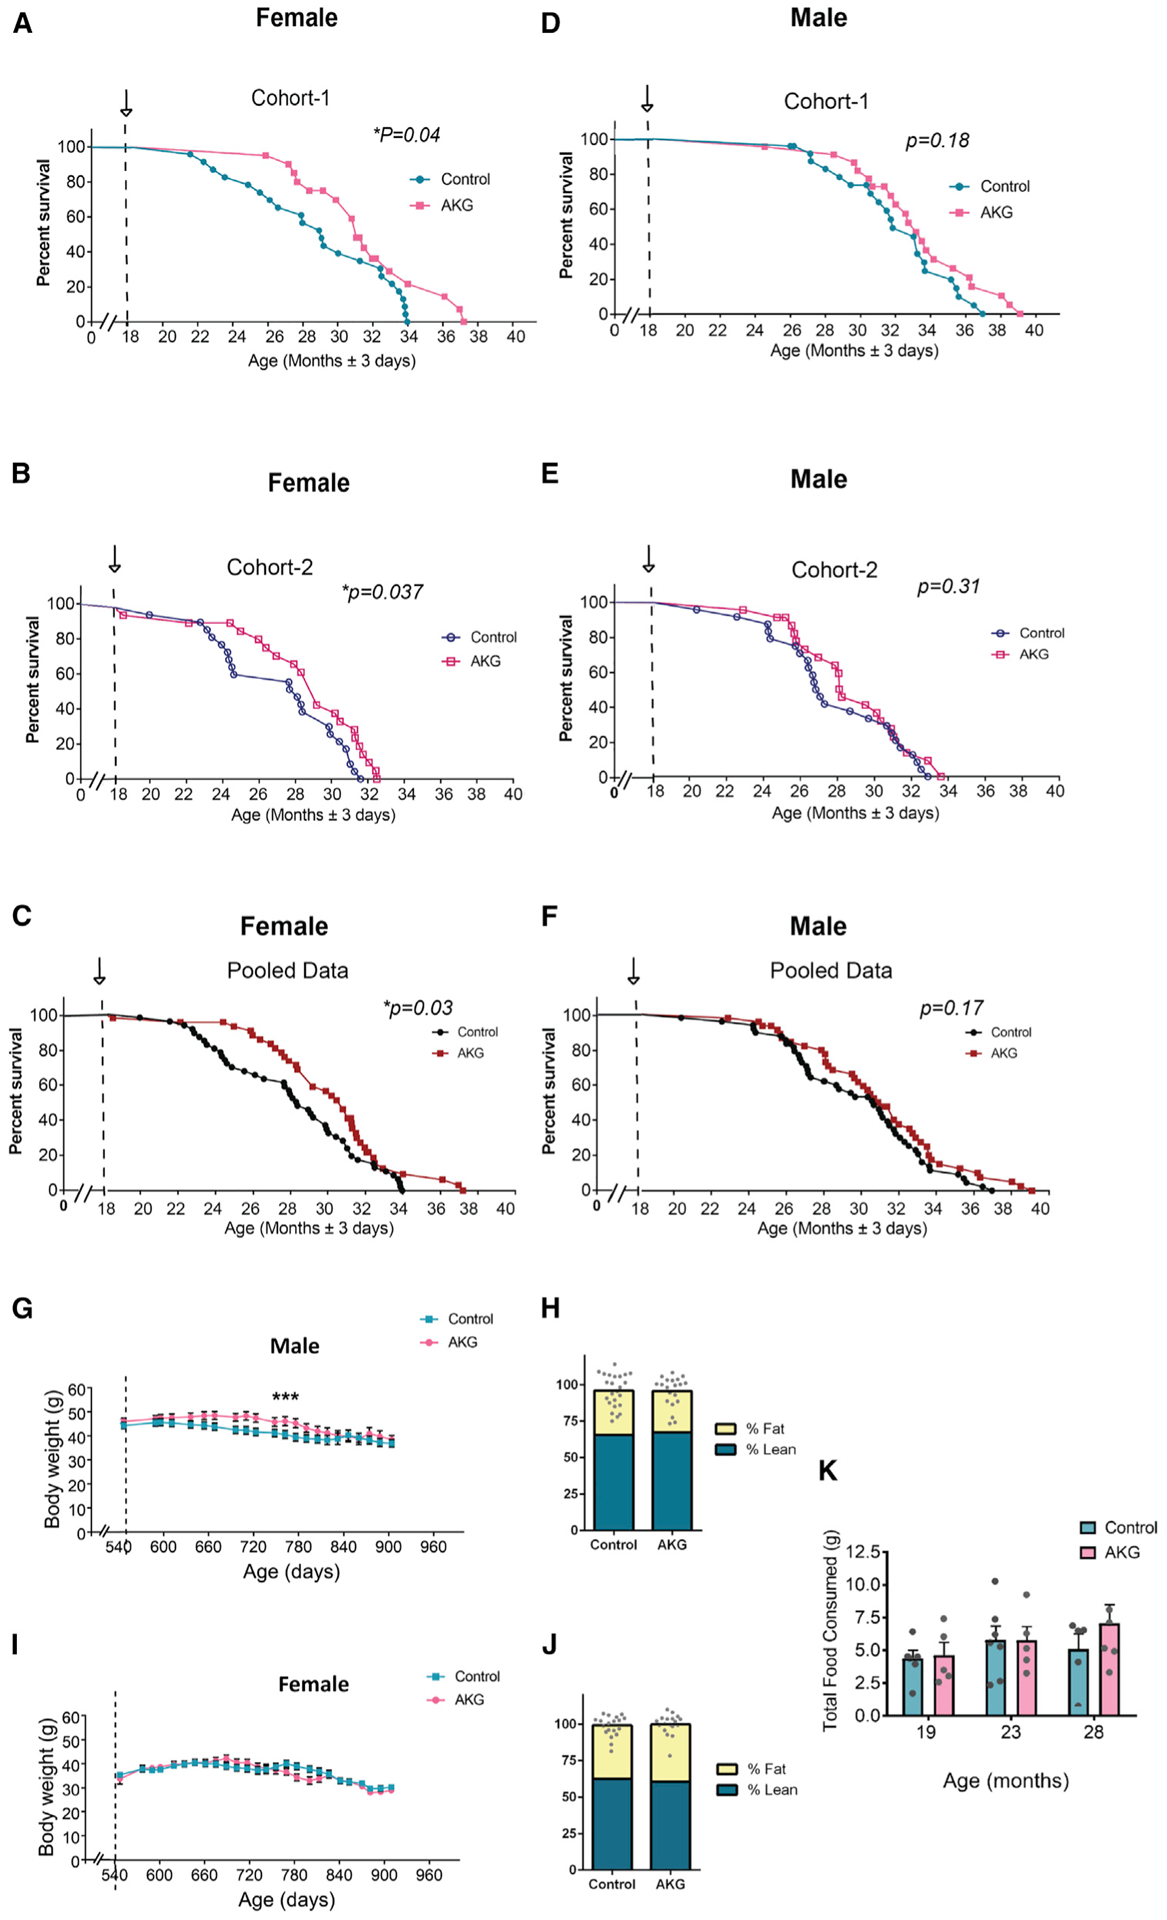
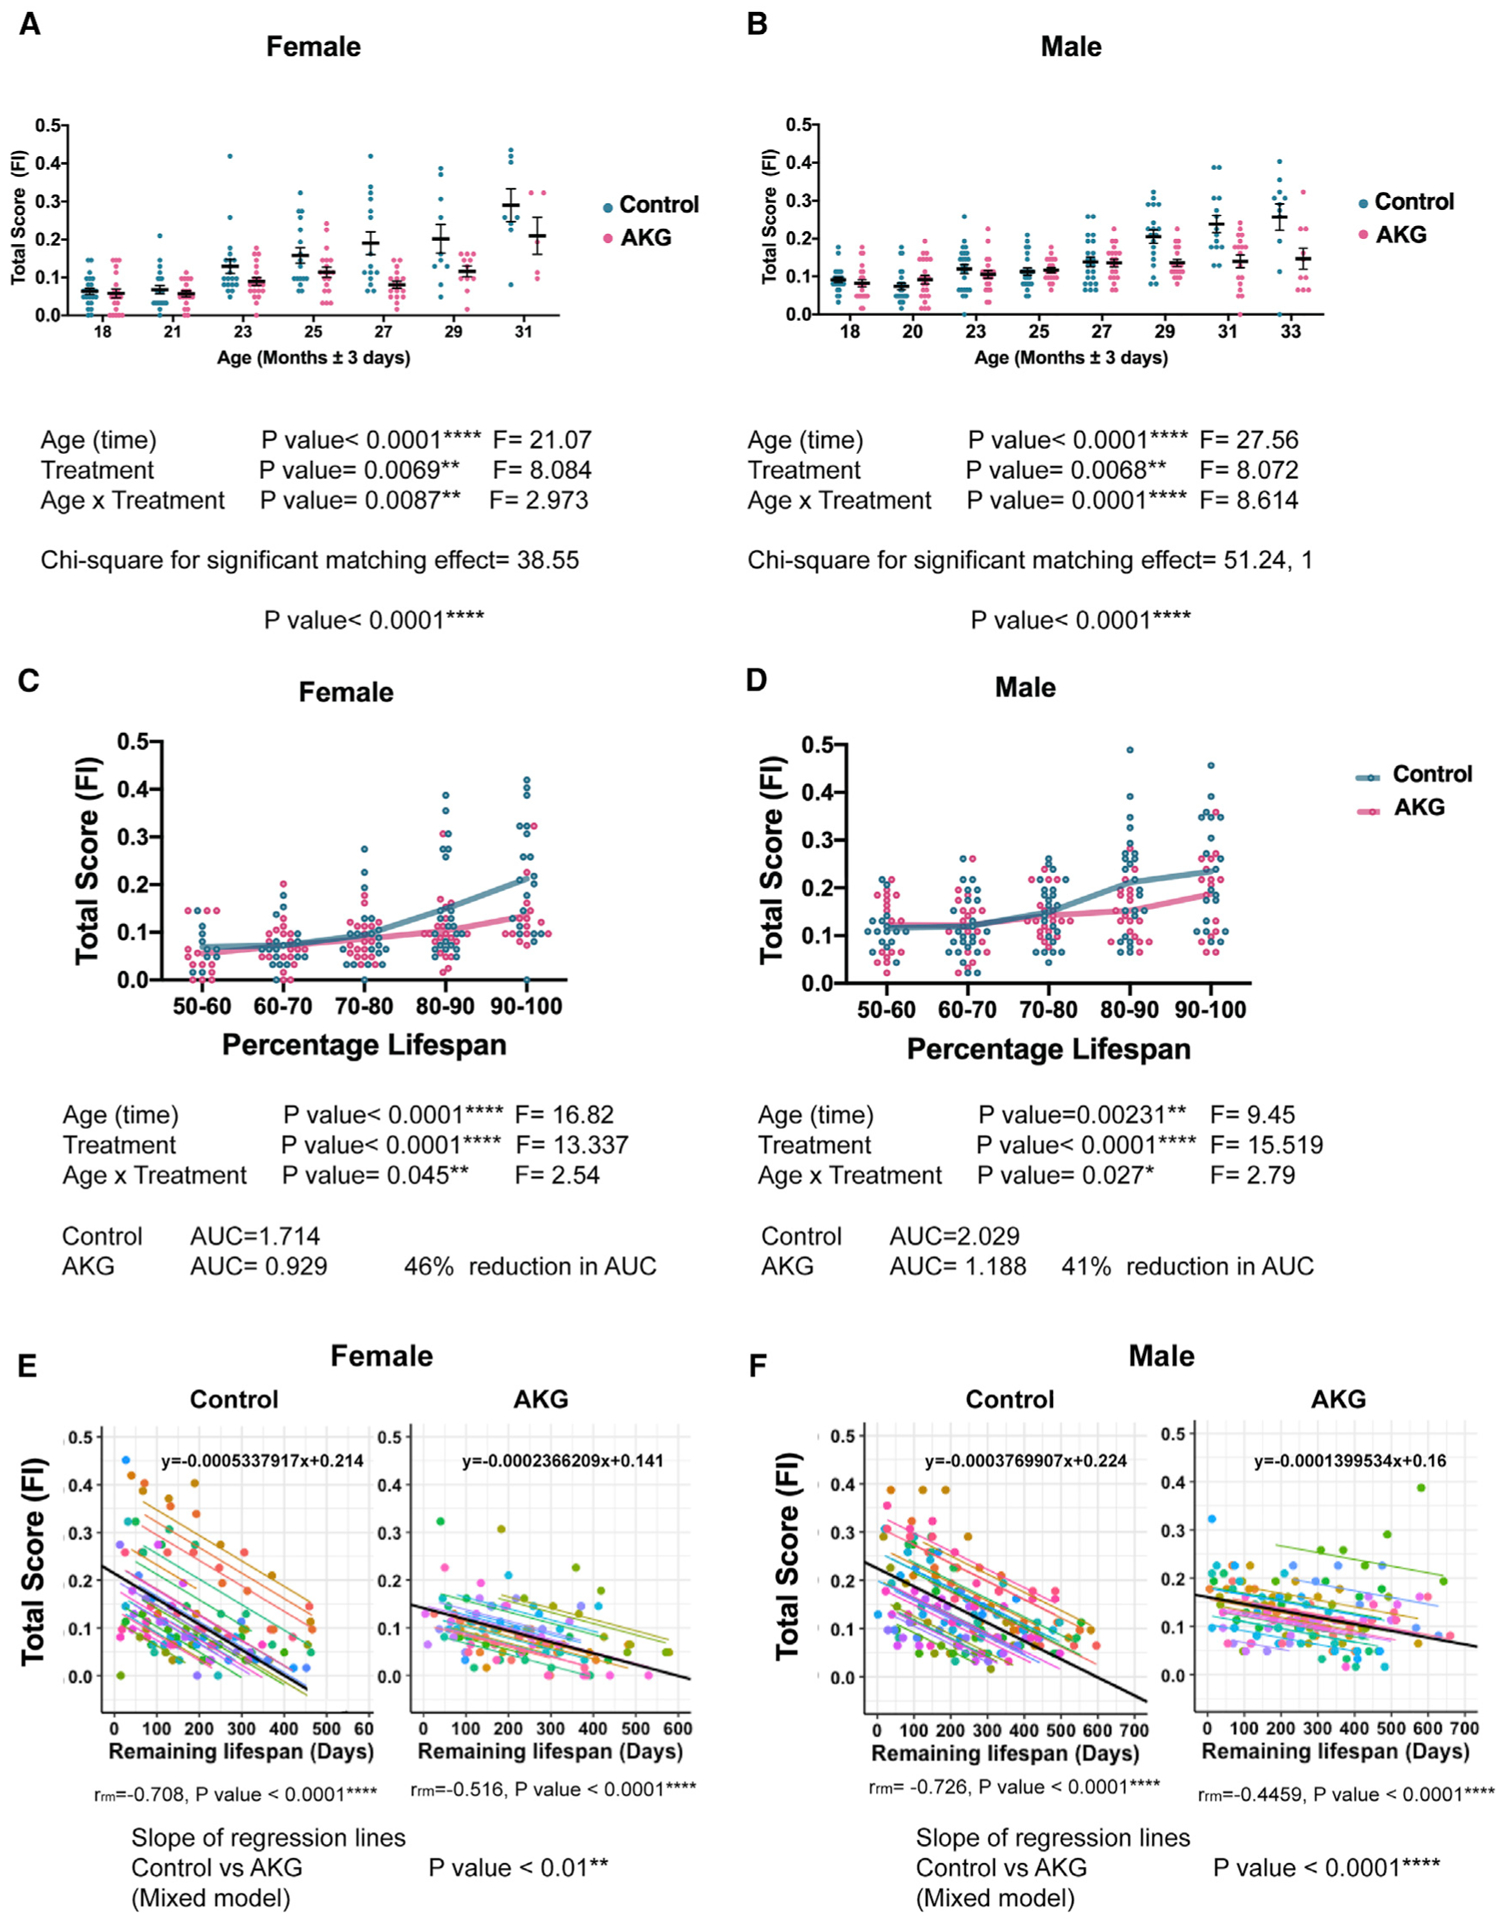
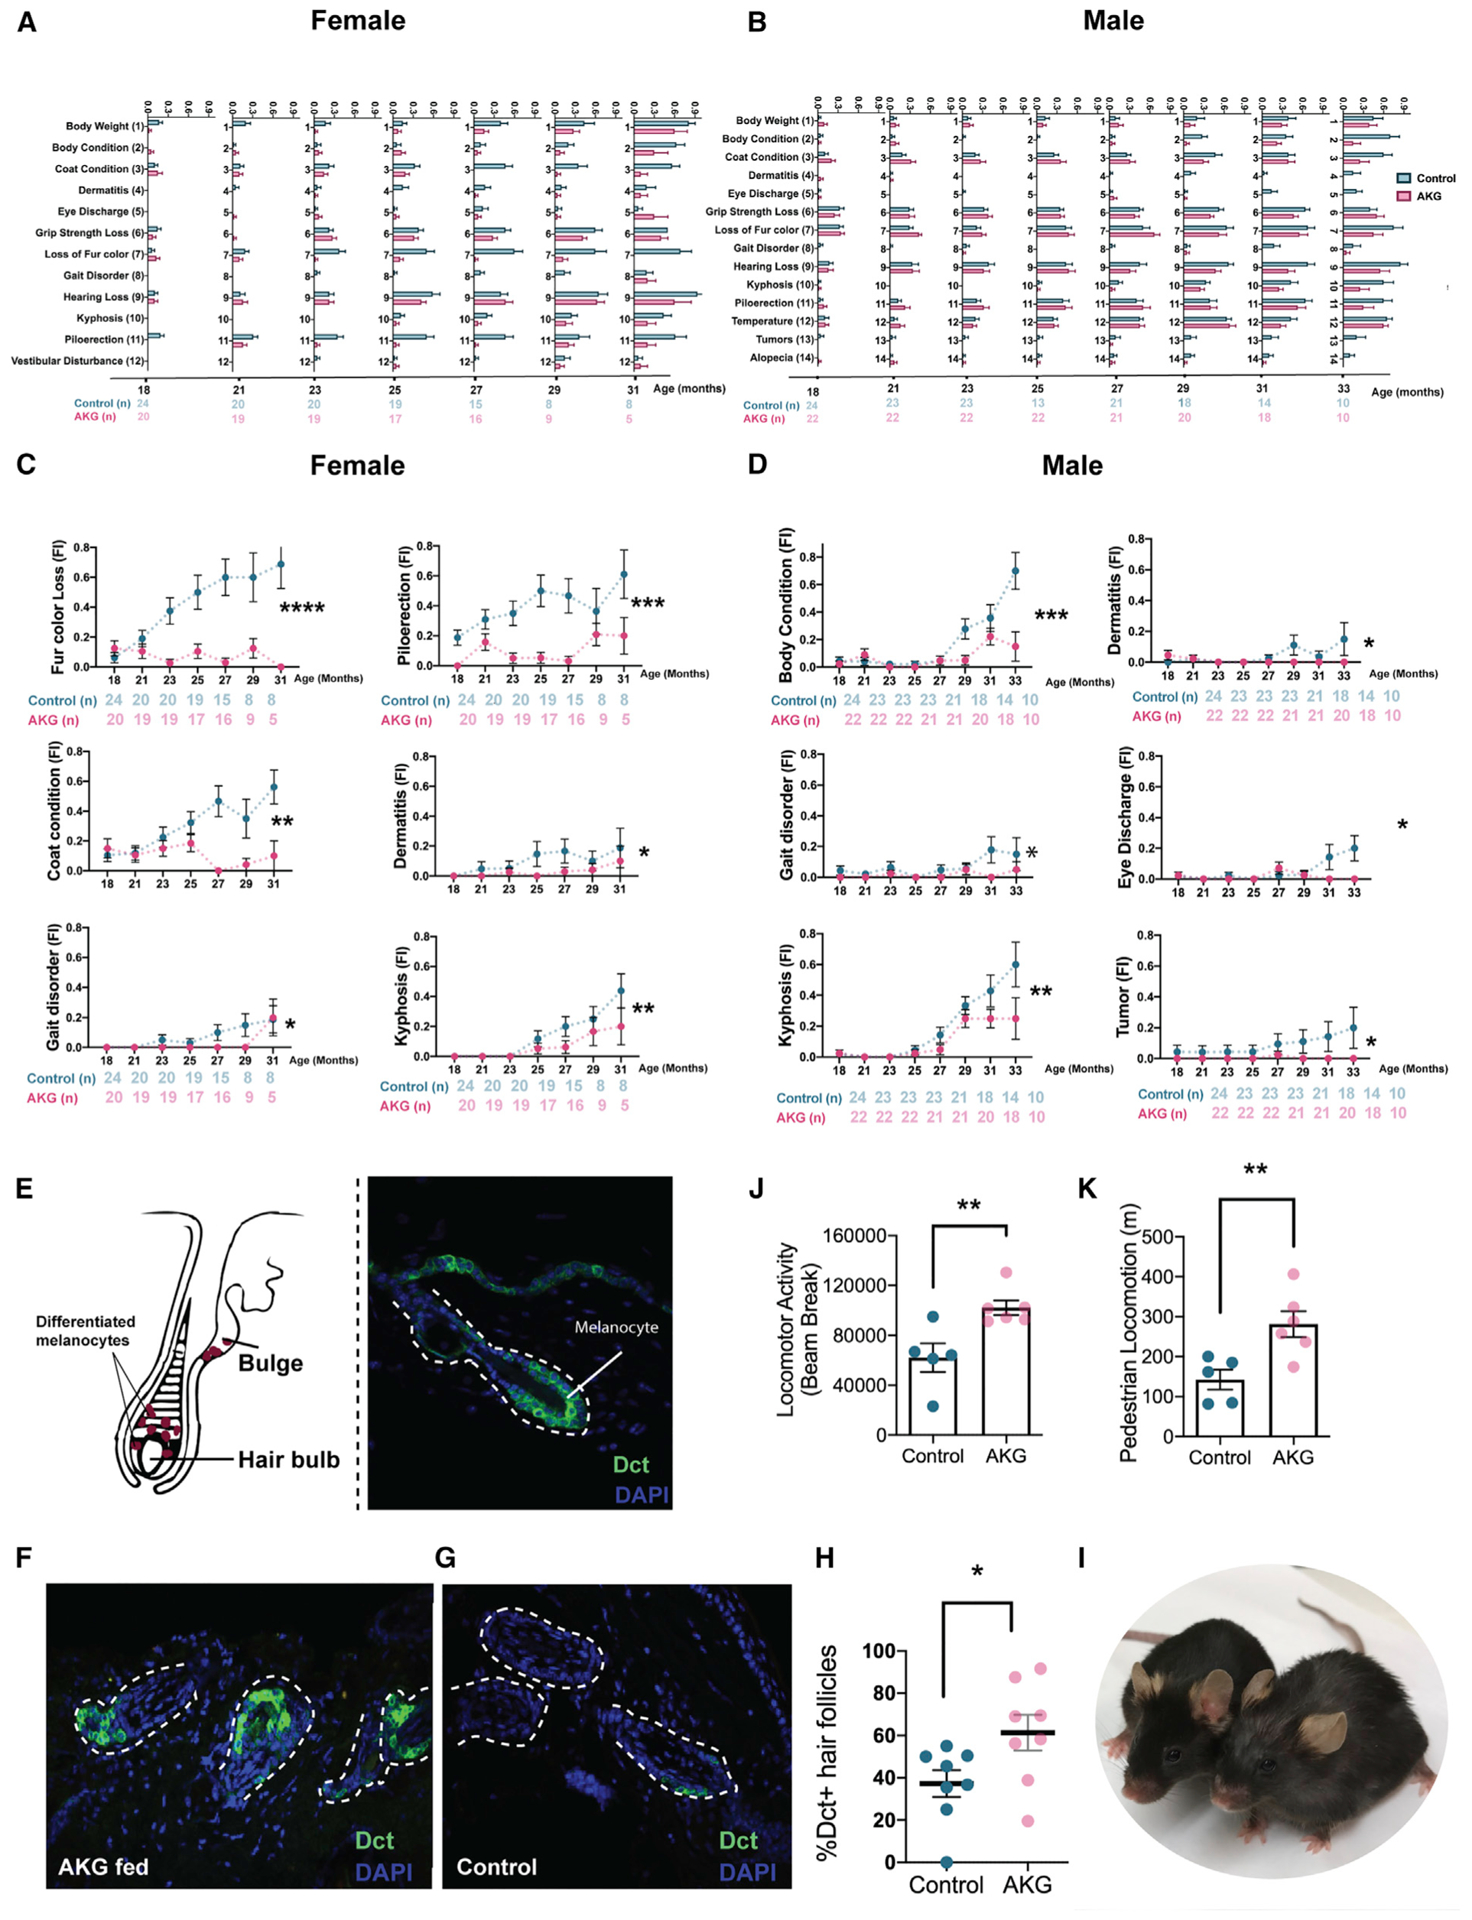
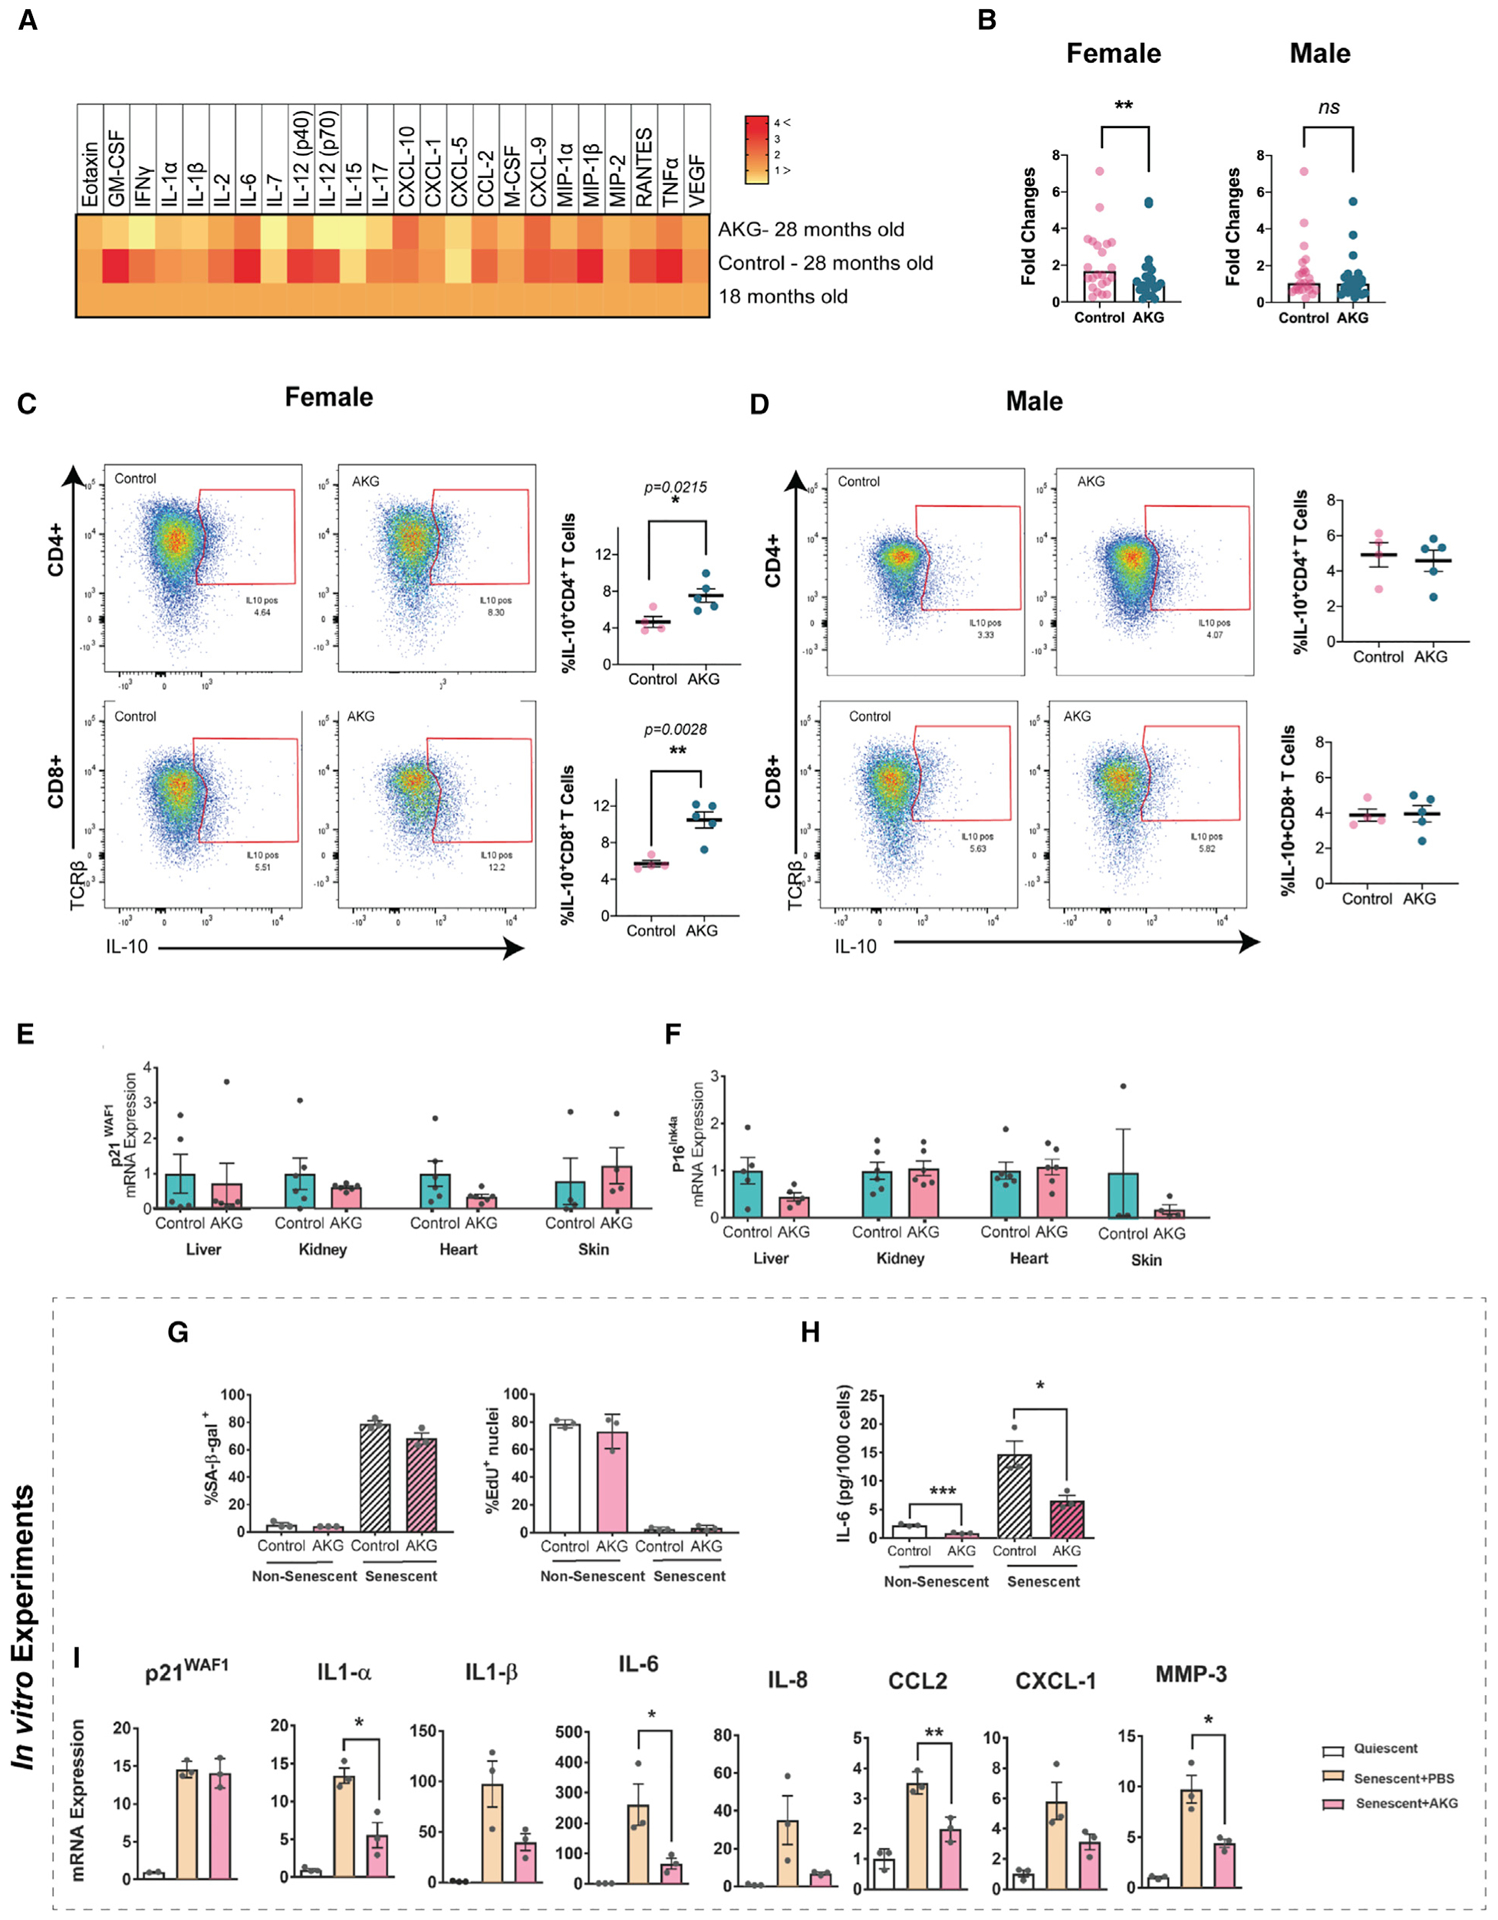
Metabolism and aging are tightly connected. Alpha-ketoglutarate is a key metabolite in the tricarboxylic acid (TCA) cycle, and its levels change upon fasting, exercise, and aging. Here, we investigate the effect of alpha-ketoglutarate (delivered in the form of a calcium salt, CaAKG) on healthspan and lifespan in C57BL/6 mice. To probe the relationship between healthspan and lifespan extension in mammals, we performed a series of longitudinal, clinically relevant measurements. We find that CaAKG promotes a longer, healthier life associated with a decrease in levels of systemic inflammatory cytokines. We propose that induction of IL-10 by dietary AKG suppresses chronic inflammation, leading to health benefits. By simultaneously reducing frailty and enhancing longevity, AKG, at least in the murine model, results in a compression of morbidity.

Keywords: IL-10; SASP; alpha-ketoglutarate; frailty; healthspan; inflammation; lifespan; longevity.


Conflict of interest statement

Declaration of Interests G.J.L. and M.L. are co-founders of Gerostate Alpha, a company aimed at developing drugs for aging, and are shareholders in Ponce de Leon Health. D.E. and Azar Asadi Shahmirzadi are shareholders in Ponece de Leon Health. B.K.K. is a board member and equity holder at Ponce de Leon Health. G.J.L., B.K., M.L., D.E., and Azar Asadi Shahmirzadi are named inventors on a preliminary patent application related to this discovery.

Figures

Figure 1.
Figure 1.. AKG Extends Lifespan and Decreases Mortality
Post-treatment survival plots graphed for cohort 1 (n = 90) and cohort 2 (n = 93). Comparing control mice to those fed AKG in the diet starting at 18 months of age. Arrows indicate the start of the treatment. (A–C) Female survival curves for cohort 1 (A) control (n = 24), AKG (n = 20) and cohort 2 (B) control (n = 23), AKG (n = 23), and (C) pooled females. (D–F) Male survival curves for cohort 1 (D) control (n = 24), AKG (n = 22) and cohort 2 (E) control (n = 24), AKG (n = 23), and (F) pooled males. Survival curve comparisons were performed using Log-rank test; *p < 0.05. Maximum lifespan extensions were calculated using Fisher’s exact test statistics; **p = 0.0064 for female cohort 1 and *p < 0.021 for female cohort 2. (G and I) Body weight trajectories from cohort 2 mice; n = all live animals in the study at each time point; data are mean ± SEM. Two-way ANOVA tests were applied to check if independent variables including time and treatment (AKG) affect male and female body weight. The comparison provided evidence of significant effects of both treatment and time on male body weight; ***p < 0.0001, ***p < 0.001, and effect of only time on female body weight ***p < 0.001. (H and J) Male (H) and female (J) body composition; n = all live animals in the study; data are mean ± SEM; no significance changes detected (two-tailed t test). (K) Food consumption was measured for 3 consecutive days in different times during the lifespan of female control (n = 6) and female AKG-fed (n = 5) mice; the arrows at 19, 23, and 28 months show the age at which food consumption was measured. Data are mean ± SEM; no significance change (two-tailed t test).
Figure 2.
Figure 2.. Compression of Morbidity by AKG Treatment
(A and B) Separately graphed (A) female and (B) male total frailty index (FI) scores during lifespan, comparing control mice (blue) to those fed AKG in the diet (pink) starting at the 18th month. Each dot is the total score of one animal at specific age as indicated. Data are mean ± SEM of each group. n = all animals alive at each measurement time. Mixed model was used to analyze the data longitudinally. In the current mixed model, every mouse with a unique ID was treated as a random effect. Treatment and time were treated as fixed effects. The low p value for chi-square for significant matching effect indicates that the pairing was effective; comparing the fit of the current mixed model to a simpler ANOVA, ****p < 0.0001. As the animal ages and gets closer to death (higher percentage of lifespan), it manifests several aging phenotypes and will be at its highest multi-morbidity risk. We considered the total scores of 31 phenotypes as a morbidity score. (C and D) Separately graphed (C) female and (D) male mice total FI scores as their percentage of lifespan. AKG treatment postpones the occurrence of aging phenotypes during lifespan and compresses the morbidity risk into fewer days of life in both sexes. Each dot is the total score of one animal. Lines are mean ± SEM of the group. n = all animals alive at each time. Two-way ANOVA was used for comparison. The area under the frailty curves (AUC) were calculated to measure the percent comparison of morbidity. (E and F) The total scores for each mouse were plotted against remaining life (life expectancy). Repeated-measures correlation (rmcorr) was applied for AKG and control groups separately and rmcorr coefficients (rrm), and associated p values have been indicated. Dots and specific regression lines for each mouse with unique ID are color coded. There are negative correlations between total score and life expectancy in both control and AKG for both sexes. We also reported the slopes of the regression lines, which computed by rmcorr for AKG and control separately (black lines). The equation of each regression line is shown (y = ax + b). Where x is the explanatory variable, a is the slope of the line, and b is the intercept. The results suggest a decrease in magnitude of slope for AKG treatment compared to control. To further prove that this difference is statically meaningful, we applied a mixed model to the combined dataset of AKG and control. In the current mixed model, we treated remaining life and treatment as fixed effects and every mouse as a random effect. The reported p value for regression lines is the result of analysis of variance (ANOVA) for the slopes. AKG treatment can significantly decrease the rate of linear relationship between life expectancy and total score in both males and females.
Figure 3.
Figure 3.. AKG Treatment Extends Healthspan and Alleviates Age-Associated Frailty
(A and B) Individually graphed frailty phenotypes that significantly increase with aging, comparing control with AKG treated mice for (A) female and (B) male. The number of animals assessed at each time point are shown as row beneath each graph. Data are mean ± SEM of the group. (C and D) Trajectories for age-dependent frailty phenotypes for (C) female and (D) male in the study. Mixed model was used to test if each age-dependent phenotype was affected by AKG supplementation. *p < 0.05, **p < 0.01, ***p < 0.001, ****p < 0.0001. See also Figure S3. (E) Simplified anatomy of an anagen hair follicle showing the location of differentiated melanocytes in hair bulb with corresponding immunofluorescence image. (F and G) Phenotypical characterization of melanocytes in the hair matrix during anagen phase for (F) female AKG-treated and (G) female control mice after 6 months of treatment. Skin sections were stained with antibodies against Dct. nuclear staining (blue) with DAPI. (H) Dot plot showing the percentage of Dct+ hair follicles in skin sections. Data are mean ± SEM of the group. *p < 0.05 (two-tailed t test). (I) Aged-matched control (right) and AKG-fed (left) female mice. Animals are 28 months old in the captured picture. (J and K) Locomotor activity (J) and pedestrian locomotion (K) were measured utilizing metabolic cages at the median life (28 months old) of female control (n = 5) and female AKG (n = 6) mice. Total locomotor activity refers to any movement made by the animal that is picked up by the sensors. The pedestrian locomotion is referred to walking. Data are mean ± SEM; **p < 0.001 (two-tailed t test).
Figure 4.
Figure 4.. AKG Reduces Inflammation
(A) Heatmap of 24 inflammatory cytokines and chemokines from the plasma of middle-aged (female, age = 18 months, n = 11), aged control, and AKG (female, 28 months old, n = 5) animals. Inflammatory cytokines show a general trend of reductions in AKG group compared to aged control. (B) Fold changes of 24 inflammatory cytokines for female and male mice after 6 months of treatment (24 months old, n = 5). Levels were calculated using the untreated 18-month-old female or male animals as reference for each treatment grouped. Values were all added together and compared with paired t test. **p < 0.001. (C and D) The splenocytes were harvested from the spleens of treated and control mice after 6 months of treatment (24 months old, 5 animals for each treatment per sex). Harvested cells were stimulated in culture with PMA, ionomycin, and Brefeldin for 6 h, and IL-10 production was detected using intracellular staining. The gating strategy is shown for CD4/CD8 positive T cells in (C) female and (D) male. Summary of data plotted as bar graphs show positive IL-10 cells as percent of total CD4/CD8 T cells. Data are mean ± SEM, *p < 0.05, **p < 0.01 (two-tailed t test). (E and F) qRT-PCR analysis of the indicated tissues of female mice. (G–I) Ionizing radiation (IR) was used to induce senescence in IMR-90 fibroblasts in vitro. Cells were concurrently treated with PBS (control) or 1 mM AKG and were either mock (0 Gy) or irradiated (10 Gy). All assays were performed 10 days post irradiation. (G) Cells were stained for senescence-associated β-galactosidase activity (left panel) or EdU incorporation (right panel). (H) IL-6 levels in conditioned media were determined by ELISA, normalized to cell number. (I) qRT-PCR analysis showing expression of senescence-associated secretory phenotype (SASP) genes, normalized to actin. Each dot is one independent experiment. Data are mean ± SEM, *p < 0.05, **p < 0.01 (two-tailed t test). See also Figure S6.

Comment in

Similar articles

Cited by

References

    1. Bakdash JZ, and Marusich LR (2017). Repeated Measures Correlation. Front. Psychol 8, 456. - PMC - PubMed
    1. Baker DJ, Wijshake T, Tchkonia T, LeBrasseur NK, Childs BG, van de Sluis B, Kirkland JL, and van Deursen JM (2011). Clearance of p16Ink4a-positive senescent cells delays ageing-associated disorders. Nature 479, 232–236. - PMC - PubMed
    1. Bansal A, Zhu LJ, Yen K, and Tissenbaum HA (2015). Uncoupling lifespan and healthspan in Caenorhabditis elegans longevity mutants. Proc. Natl. Acad. Sci. USA 112, E277–E286. - PMC - PubMed
    1. Bland JM, and Altman DG (1995). Calculating correlation coefficients with repeated observations: Part 1–Correlation within subjects. BMJ 310, 446. - PMC - PubMed
    1. Campisi J (2013). Aging, cellular senescence, and cancer. Annu. Rev. Physiol 75, 685–705. - PMC - PubMed

Publication types

Substances