. 2020 Oct 1;183(1):143-157.e13.
doi: 10.1016/j.cell.2020.08.025. Epub 2020 Aug 19.

Loss of Bcl-6-Expressing T Follicular Helper Cells and Germinal Centers in COVID-19

Affiliations

Loss of Bcl-6-Expressing T Follicular Helper Cells and Germinal Centers in COVID-19

Naoki Kaneko et al. Cell. .

Abstract

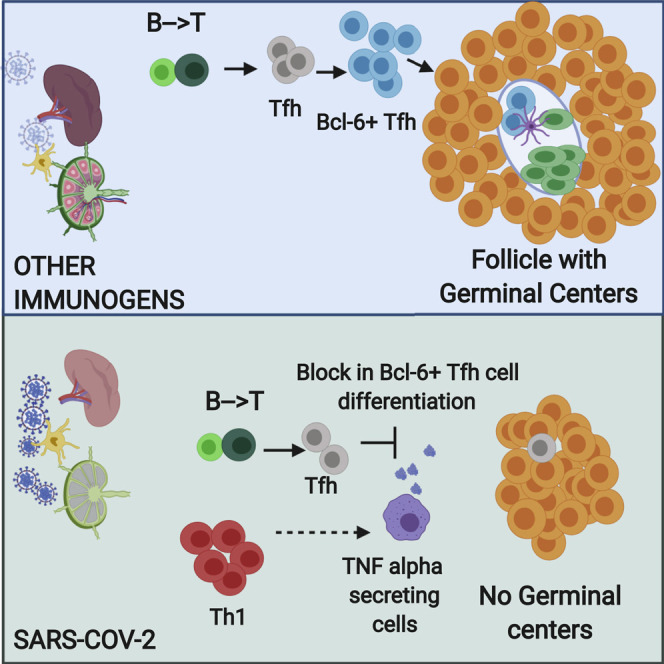
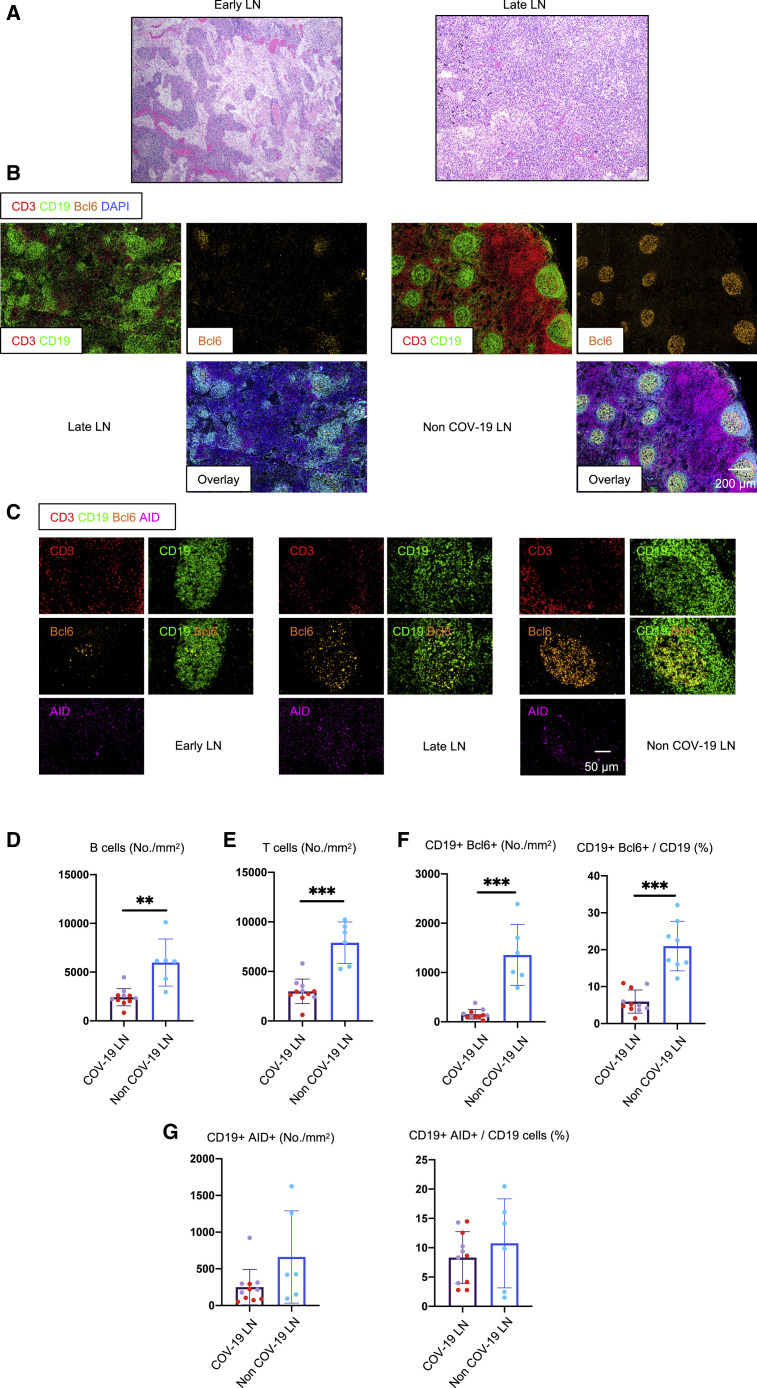
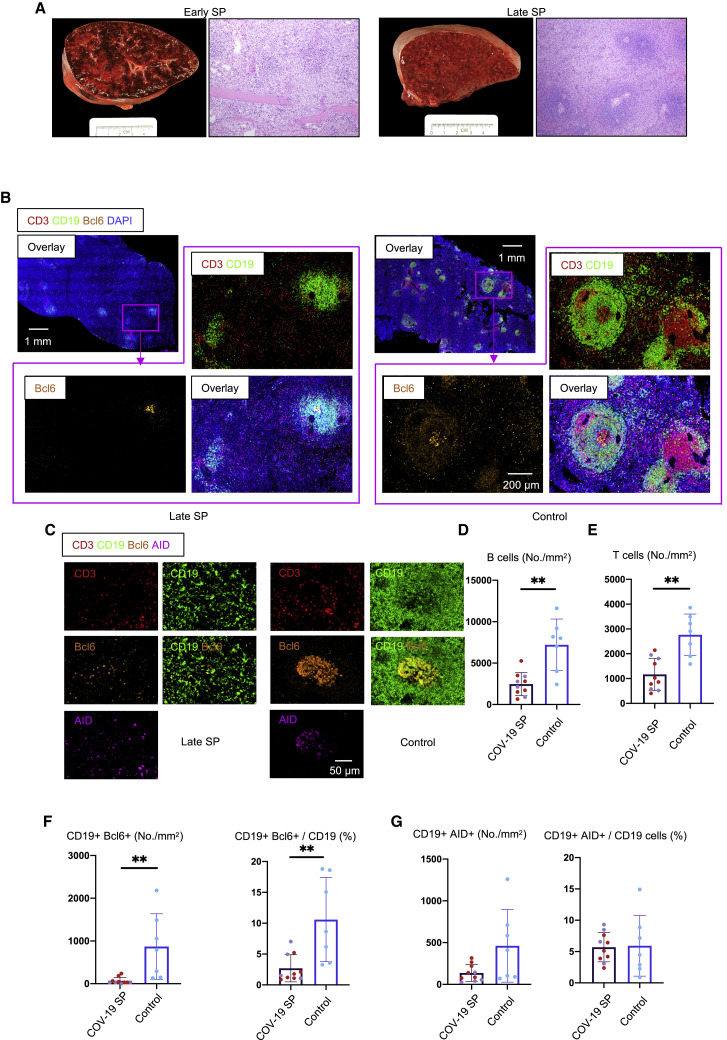
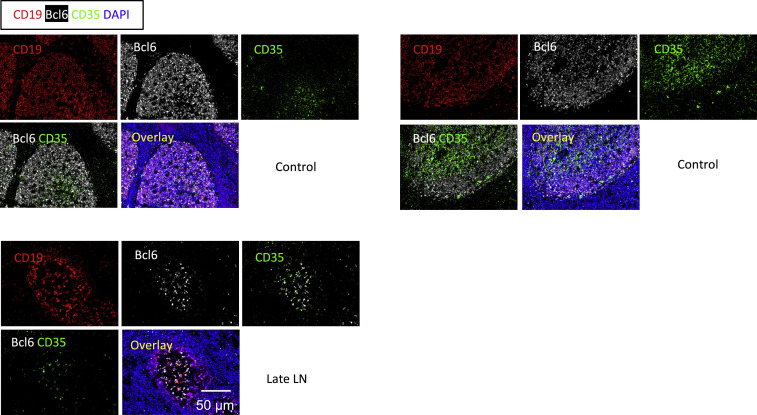
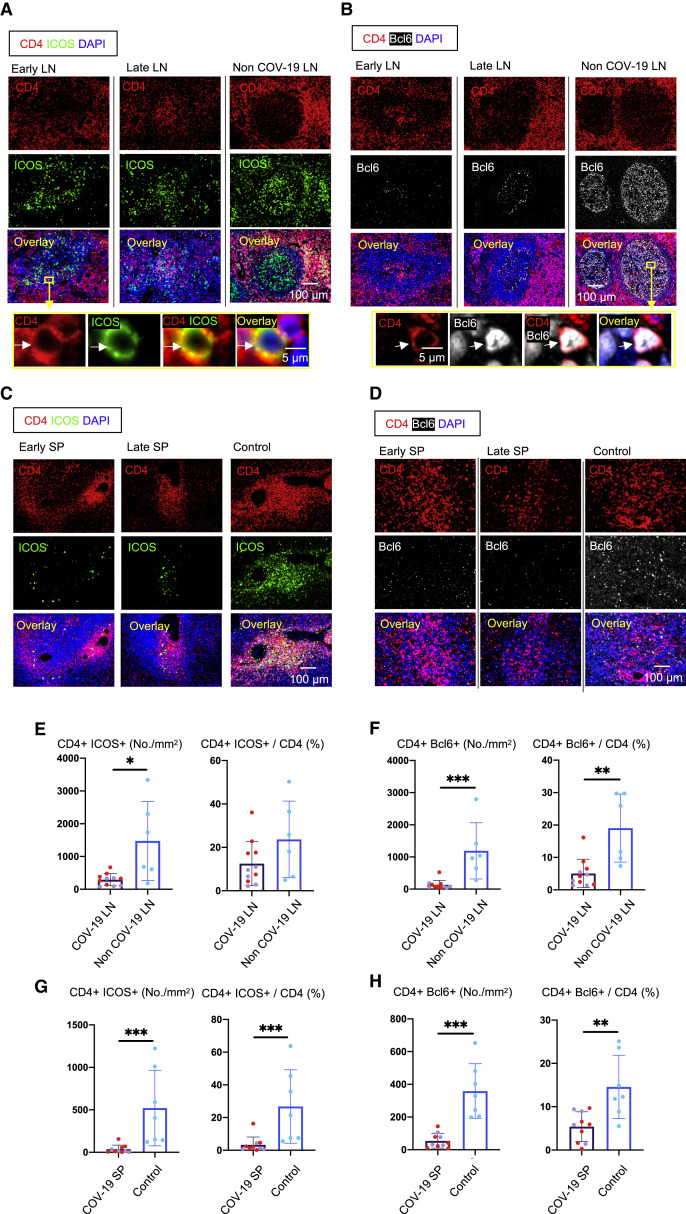
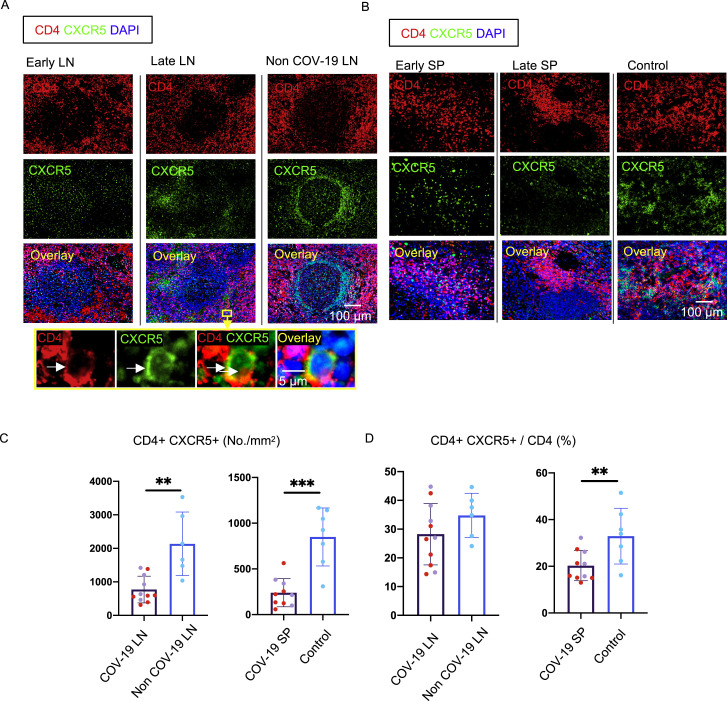
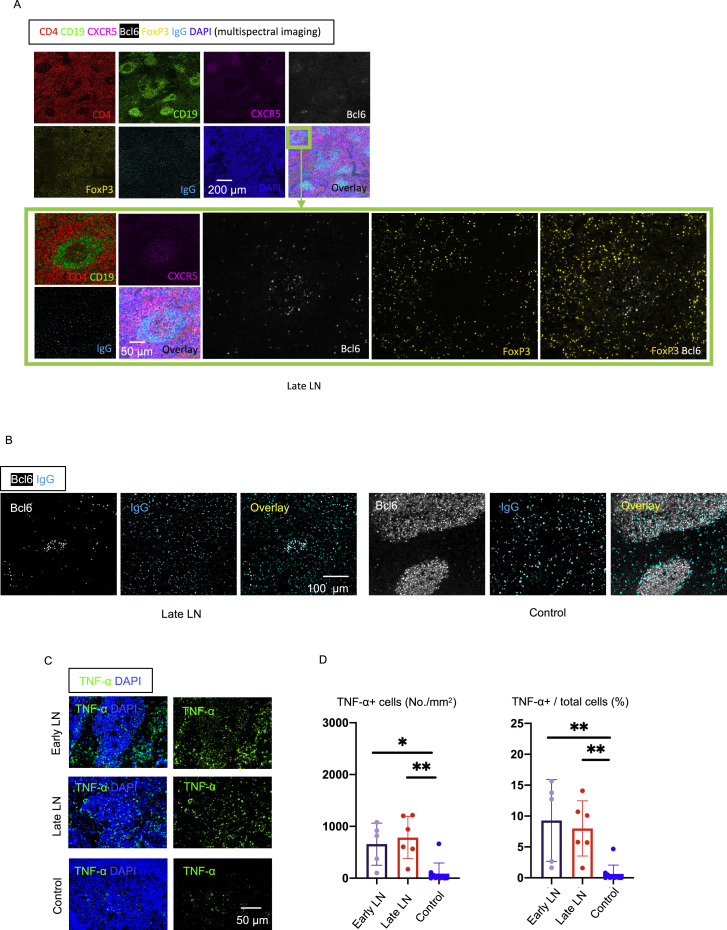
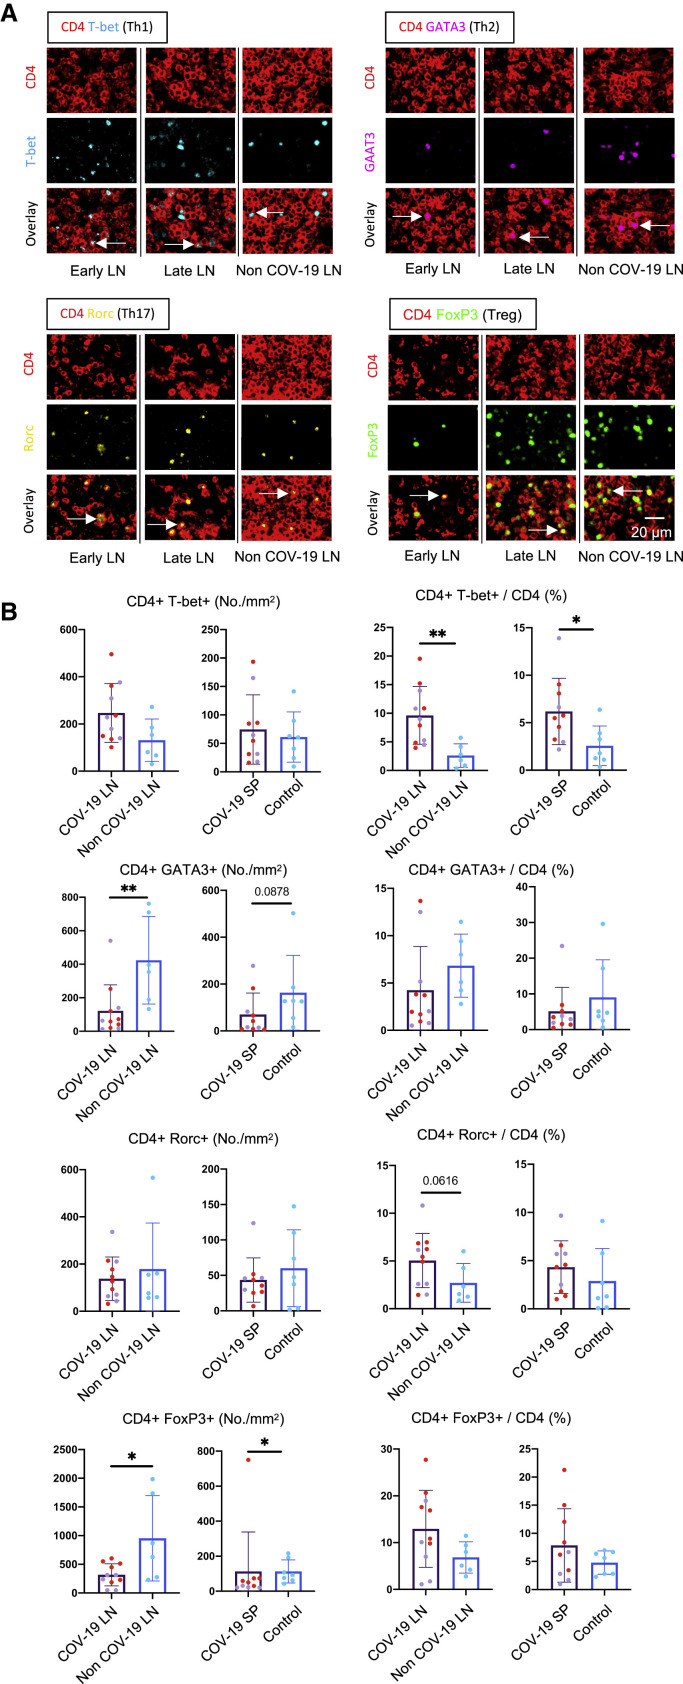
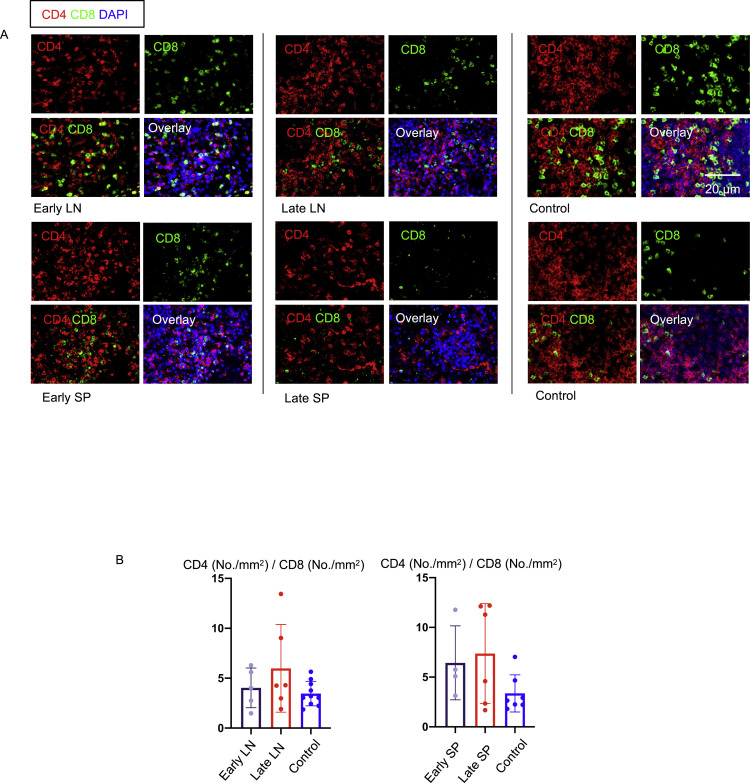
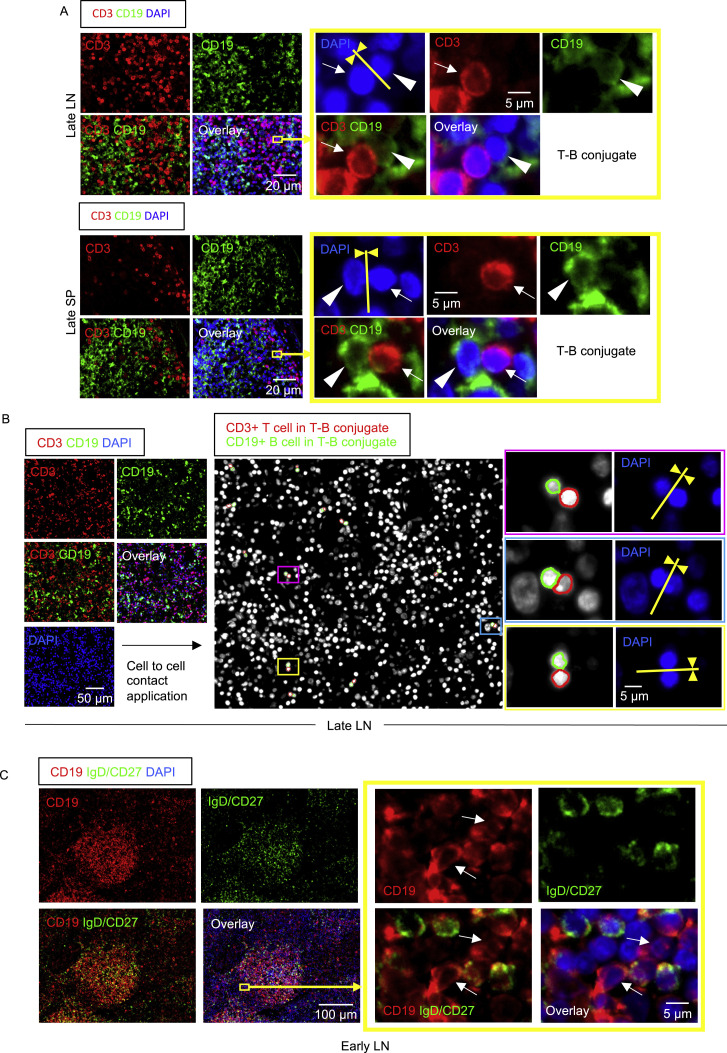
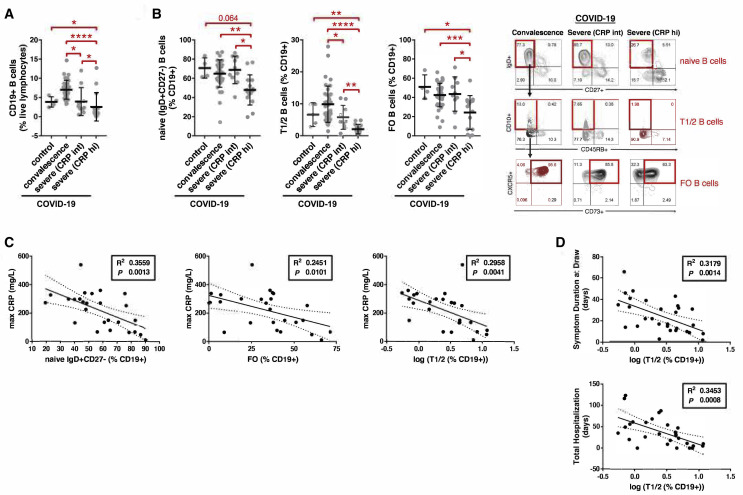
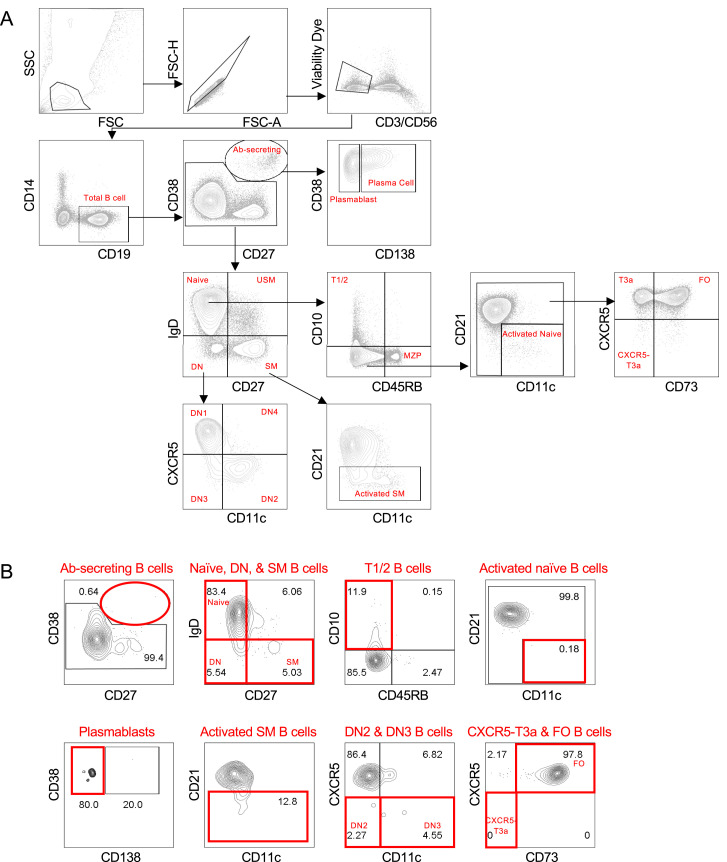
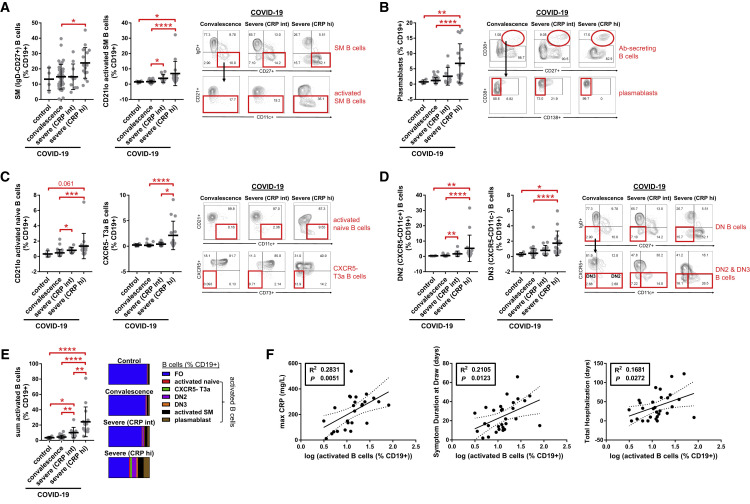
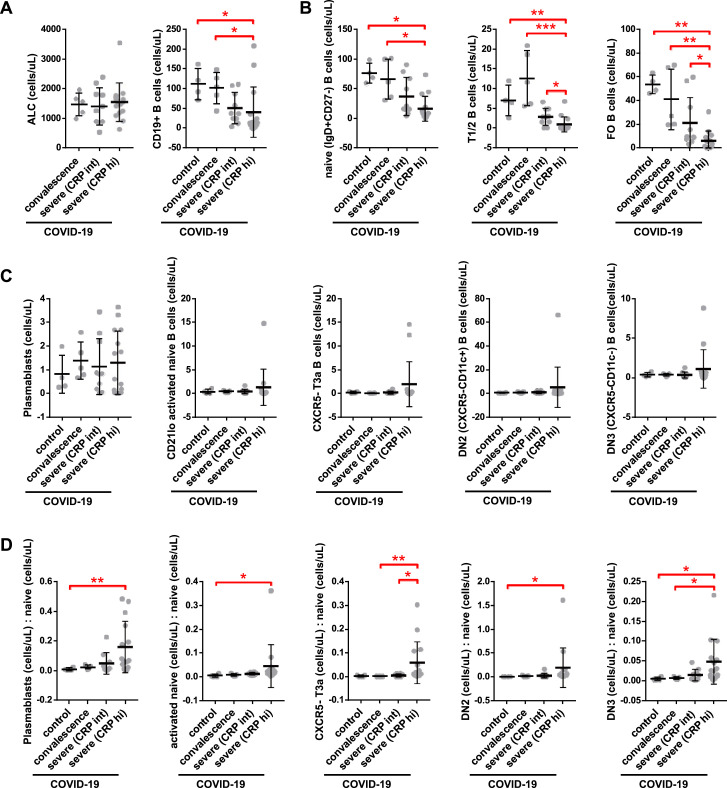
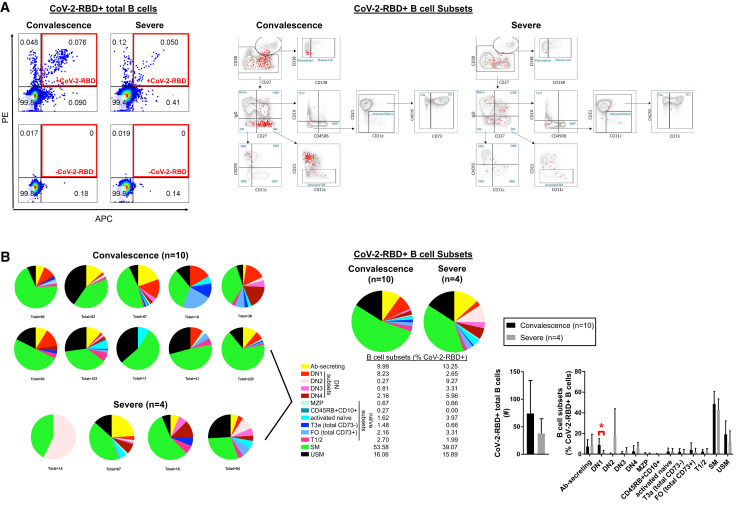
Humoral responses in coronavirus disease 2019 (COVID-19) are often of limited durability, as seen with other human coronavirus epidemics. To address the underlying etiology, we examined post mortem thoracic lymph nodes and spleens in acute SARS-CoV-2 infection and observed the absence of germinal centers and a striking reduction in Bcl-6+ germinal center B cells but preservation of AID+ B cells. Absence of germinal centers correlated with an early specific block in Bcl-6+ TFH cell differentiation together with an increase in T-bet+ TH1 cells and aberrant extra-follicular TNF-α accumulation. Parallel peripheral blood studies revealed loss of transitional and follicular B cells in severe disease and accumulation of SARS-CoV-2-specific "disease-related" B cell populations. These data identify defective Bcl-6+ TFH cell generation and dysregulated humoral immune induction early in COVID-19 disease, providing a mechanistic explanation for the limited durability of antibody responses in coronavirus infections, and suggest that achieving herd immunity through natural infection may be difficult.

Keywords: COVID-19; SARS-CoV-2; T follicular helper cells; TNF-α; cytokine dysregulation; double-negative B cells; extra-follicular B cells; germinal centers; humoral immunity; plasmablasts.


Conflict of interest statement

Declaration of Interests S.P. is on the SAB of Abpro Inc. and Pulsar Biopharma. G.A. is founder of Seromyx Systems Inc.

Figures

None
Graphical abstract
Figure 1
Figure 1
Early Loss of Germinal Centers and Bcl-6-Expressing B Cells in COVID-19 Thoracic Lymph Nodes (A) Hematoxylin-eosin staining of lymph nodes from early (left) and late (right) COVID-19 patients. (B) Low-power images of CD3 (red), CD19 (green), Bcl-6 (orange), and DAPI (blue) staining in a lymph node from a late COVID-19 patient (left) and a non-COVID-19 thoracic lymph node (right). (C) Representative multi-color immunofluorescence images of CD3 (red), CD19 (green), Bcl-6 (orange), and AID (purple) staining in lymph nodes from early (left) and late (middle) COVID-19 patients and a non-COVID-19 lymph node (right). (D and E) Absolute numbers of CD19+ B cells (D) and CD3+ T cells (E) in lymph nodes from COVID-19 patients (purple, n = 11) and non-COVID-19 patients (blue, n = 6). COVID-19 samples include early (purple, n = 5) and late (red, n = 6) COVID-19 patients. (F and G) Absolute numbers and relative proportion of Bcl6+ B cells (F) and AID+ B cells (G) in the pool of CD19+ B cells in lymph nodes from COVID-19 patients (purple, n = 11) and non-COVID-19 patients (blue, n = 6). COV-19, COVID-19; LN, lymph node. Mann-Whitney U test was used to calculate p value. Error bars represent mean ± SEM. ∗∗p < 0.01; ∗∗∗p < 0.001. See also Figure S1 and Tables S1 and S2.
Figure 2
Figure 2
White Pulp Attrition, Early Loss of Germinal Centers, and Bcl-6-Expressing B Cells in COVID-19 Spleens (A) Cross-sectional view of whole spleen and hematoxylin-eosin staining from early (left) and late (right) COVID-19 patients. (B) Low-power images of CD3 (red), CD19 (green), Bcl-6 (orange), and DAPI (blue) staining in a spleen from a late COVID-19 patient (left) and a control (right). (C) Representative multi-color immunofluorescence image of CD3 (red), CD19 (green), Bcl-6 (orange), and AID (purple) staining in spleens from a late COVID-19 patient (left) and a control (right). (D and E) Absolute numbers of CD19+ B cells (D) and CD3+ T cells (E) in spleens from early (purple, n = 4) and late (red, n = 6) COVID-19 patients and controls (blue, n = 7). (F and G) Absolute numbers and relative proportion of Bcl-6+ B cells (F) and AID+ B cells (G) in spleens from early (purple, n = 4) and late (red, n = 6) COVID-19 patients and controls (blue, n = 7). SP, spleen. Multiple comparisons are controlled for by Kruskal-Wallis test. Error bars represent mean ± SEM. p < 0.05. See also Tables S2 and S3.
Figure S1
Figure S1
FDCs Are Not Lost in COVID-19 Lymph Nodes, Related to Figure 1 Representative multi-color immunofluorescence images of CD19 (red), Bcl6 (white), CD35 (green) and DAPI (blue) staining in lymph nodes from late COVID-19 patient (lower panel) and controls (upper panels).
Figure 3
Figure 3
Loss of Germinal Center Type Bcl-6+ T Follicular Helper Cells in COVID-19 Lymph Nodes and Spleens (A) Representative multi-color immunofluorescence image of CD4 (red), ICOS (green), and DAPI (blue) staining in lymph nodes from early (left) and late (middle) COVID-19 patients and a non-COVID-19 control (right). Arrows indicate CD4+ ICOS+ TFH cells. (B) Representative multi-color immunofluorescence images of CD4 (red), Bcl-6 (white), and DAPI (blue) staining in lymph nodes from early (left) and late (middle) COVID-19 patients and a non-COVID-19 control (right). Arrows indicate CD4+ Bcl6+ GC-type TFH cells. (C) Representative multi-color immunofluorescence images of CD4 (red), ICOS (green), and DAPI (blue) staining in spleens from early (left) and late (middle) COVID-19 patients and a control (right). (D) Representative multi-color immunofluorescence images of CD4 (red), Bcl-6 (white), and DAPI (blue) staining in spleens from early (left) and late (middle) COVID-19 patients and a control (right). (E and F) Absolute numbers and relative proportions of CD4+ ICOS+ TFH cells (E) and CD4+ Bcl-6+ GC-type TFH cells (F) in lymph nodes from COVID-19 patients (purple, n = 11) and non-COVID-19 patients (blue, n = 6). COVID-19 samples include early (purple, n = 5) and late (red, n = 6) COVID-19 patients. (G and H) Relative proportions of CD4+ ICOS+ TFH cells (G) and CD4+ Bcl-6+ GC-type TFH (H) in spleens from COVID-19 patients (purple, n = 10) and controls (blue, n = 7). COVID-19 samples include early (purple, n = 4) and late (red, n = 6) COVID-19 patients. Mann-Whitney U test used to calculate p value. Error bars represent mean ± SEM. p < 0.05; ∗∗p < 0.01; ∗∗∗p < 0.001. See also Figures S2, S3, and S4 and Tables S1, S2, and S3.
Figure S2
Figure S2
Decrease in CXCR5+ T Follicular Helper Cells in COVID-19 Lymph Nodes and Spleens, Related to Figure 3 (A) Representative multi-color immunofluorescence images of CD4 (red), CXCR5 (green) and DAPI (blue) staining in lymph nodes from early (left) and late (middle) COVID-19 patients and a non-COVID-19 lymph node (right). Arrows indicate CD4+ CXCR5+ TFH cells. (B) Representative multi-color immunofluorescence images of CD4 (red), CXCR5 (green) and DAPI (blue) staining in spleens from early (left) and late (middle) COVID-19 patients and a control (right). (C and D) Absolute numbers (C) and relative proportions (D) of CD4+ CXCR5+ TFH cells in lymph nodes and spleens from COVID-19 patients and non-COVID-19 lymph nodes (blue) (n = 6) and control spleens (blue) (n = 7). COVID-19 samples include early (purple; lymph node; n = 5) (spleen; n = 4) and late (red dots) (n = 6) COVID-19 patients. Mann-Whitney U test used to calculate p value. Error bars represent mean ± SEM. ∗∗p < 0.01; ∗∗∗p < 0.001.
Figure S3
Figure S3
Increased T reg Cells but No Differentiation into TFR Cells in COVID-19 Lymph Nodes, Related to Figure 3 (A) Representative multi-spectral 7 color immunofluorescence images showing CD4 (red), CD19 (green), CXCR5 (purple), Bcl6 (white), FoxP3 (yellow), IgG (light blue) and DAPI (blue) staining of lymph nodes from late COVID-19 patients. Images in the green box show high-power images. No FoxP3+/Bcl6+ cells were seen (white staining with no yellow overlap) in follicles. (B) IgG+ plasmablasts are found in follicular and extra-follicular areas in COVID-19 lymph nodes. Related to Figure 3. Representative multi-color immunofluorescence images of Bcl6 (white) and IgG (light blue) in lymph nodes of a late COVID-19 patient (left) and a control (right). IgG+ cells were abundant in follicular and extrafollicular areas in both COVID-19 lymph nodes and controls. (C and D) Large increase in TNF-α production at both follicular and extra-follicular sites in COVID-19 lymph nodes, while controls have low levels of TNF-α localized to follicles. Related to Figure 3. (C) Representative multi-color immunofluorescence images of TNF-α (green) and DAPI (blue) staining in lymph nodes from early and late COVID-19 patients and a control. (D) Absolute numbers (left) and percentages (right) of TNF-α+ cells in lymph nodes from early (purple) (n = 5) and late (red; n = 6) COVID-19 patients and controls (blue; n = 10). Multiple comparisons were controlled for by Kruskal-Wallis test. Error bars represent mean ± SEM. p < 0.05; ∗∗p < 0.01.
Figure 4
Figure 4
TH1 Cells Are Expanded in Comparison to Other CD4+ T Cell Subsets in COVID-19 Thoracic Lymph Nodes and Spleens (A) Representative multi-color staining showing TH1, TH2, TH17, and T reg cells in lymph nodes form early (left) and late (middle) COVID-19 patients and a non-COVID-19 control (right; TH1: CD4+ [red] T-bet+ [light blue]; TH2: CD4+ [red] GATA3+ [purple]; TH17: CD4+ [red] RORγ+ [yellow]; T reg cell: CD4+ [red] FOXP3+ [green]). (B) Absolute numbers and relative proportions of TH1, TH2, TH17, and T reg cells in lymph nodes and spleens (purple) from early (purple, lymph nodes: n = 5; spleens: n = 4) and late (red, n = 6) COVID-19 patients and controls (blue, lymph nodes: n = 6; spleens: n = 7). Mann-Whitney U test was used to calculate p value. Error bars represent mean ± SEM. p < 0.05; ∗∗p < 0.01. See also Figures S5, S6, and S7 and Tables S1, S2, and S3.
Figure S4
Figure S4
Increase in CD4+/CD8+ T Cell Ratio in Lymph Nodes and Spleens in COVID-19, Related to Figure 4 (A) Representative multi-color immunofluorescence images of CD4 (red), CD8 (green) and DAPI (blue) staining in lymph nodes (top 2 rows of images) and spleens (bottom 2 rows of pictures) from early (left) and late (middle) COVID-19 patients and controls (right). (B) Relative ratios of CD4 and CD8 T cells (No./mm2) in lymph nodes (left) and spleens (right) from early (purple) (n = 5/4) and late (red) (n = 6) COVID-19 patients and controls (blue) (n = 10/7).
Figure S5
Figure S5
Follicular and Extra-follicular T-B Conjugates and IgDCD27 B Cells in COVID-19 Lymph Nodes, Related to Figure 4 (A) Immunofluorescence staining of CD3 (red), CD19 (green) and DAPI (blue) in a lymph node (top) and a spleen (bottom) in a late COVID-19 patient. Arrows and arrowheads indicate CD3+ T cells and CD19+ B cells respectively. T cell and B cells formed close and extensive intercellular plasma membrane contacts as highlighted in the yellow box. (B) Immunofluorescence staining (left panels) and visualization of T-B conjugates (middle and right panels) in a lymph node from a late COVID-19 patient using the StrataQuest cell-to-cell contact application. Masks of the nuclei based on DAPI staining establish the inner boundary of the cytoplasm and the software “looks” outward toward the plasma membrane boundary. An overlap of at least 3 pixels of adjacent cell markers was required to establish each “contact” criterion. Details are in the STAR Methods section. Nuclei circled in red and green respectively depict CD3+ T cells and CD19+ B cells in T-B conjugates. Each box (purple, light blue and yellow) highlights a T-B conjugate. (C) Representative multi-color immunofluorescence image of CD19 (red), IgD and CD27 (both in green) and DAPI (blue) staining in a lymph node from an early COVID-19 patient. IgD-/CD27- double negative B cells (red staining with no green overlap) are abundant inside the follicle and also outside. Boxed area depicts some of these cells outside the follicle. White arrows show IgD-/CD27- double negative B cells.
Figure 5
Figure 5
Decreased Early Transitional and Follicular B Cells in the Peripheral Blood of Patients with Severe COVID-19 (A and B) Quantitation of (A) total CD19+ B cells and (B) naive, early transitional (T1/2), and follicular (FO) B cell subsets in the peripheral blood of patients with COVID-19 at states of convalescence (n = 39), severe illness with an intermediate maximum CRP level during hospitalization (<200 mg/L; severe [CRP int]; n = 10), and severe illness with a high maximum CRP level during hospitalization (>200 mg/L; severe [CRP hi]; n = 15) as defined by the clinical criteria listed in Table S4 and compared to healthy controls (n = 4). Quantitation is shown by B cell level for each individual patient with mean, standard deviation, and significance by one-way ANOVA of log % B cell value indicated (p < 0.05; ∗∗p < 0.01; ∗∗∗p < 0.001; ∗∗∗∗p < 0.0001). Representative COVID-19 contour plots shown (B) with healthy control contour plots and full B cell flow cytometry gating strategy outlined (Figure S6). (C and D) Association of peripheral blood B cell frequency with maximum CRP level (C) and the clinical parameters of symptom duration at blood draw and total length of hospital stay (D) in all symptomatic COVID-19 patients (n = 29) with moderate to severe illness as defined by the clinical criteria listed in Table S4. Correlation is shown by linear regression with individual patients, 95% confidence bands, R2, and p values shown. See also Figures S6 and S7 and Table S4.
Figure S6
Figure S6
Analysis of Circulating B Cell Subsets by Flow Cytometry, Related to Figures 5, 6, and 7 (A) Gating strategy for COVID-19 PBMCs. (B) Representative flow plots of relevant B cell subsets from PBMCs derived from a healthy donor. Antibody-secreting (Ab-secreting), double negative (DN), follicular (FO), marginal zone precursor (MZP), switched memory (SM), transitional (T), unswitched memory (USM).
Figure 6
Figure 6
Increased Proportions of Activated B Cell Subsets in the Peripheral Blood of Patients with Severe COVID-19 (A–E) Proportions of (A) switched memory (SM) B cells, (B) plasmablasts, (C) activated naive and CXCR5-late transitional (T3a) B cells, (D) IgDCD27 double-negative (DN) B cells, and (E) total (sum) activated B cells in the peripheral blood of patients with COVID-19 at states of convalescence (n = 39), severe illness with an intermediate maximum CRP level during hospitalization (<200 mg/L; severe CRP int; n = 10), and severe illness with a high maximum CRP level during hospitalization (>200 mg/L; severe CRP hi; n = 15), as defined by the clinical criteria listed in Table S4 and compared to healthy controls (n = 4). Quantitation is shown by B cell level for each individual patient with mean, standard deviation, and significance by one-way ANOVA of log % B cell value indicated (p < 0.05; ∗∗p < 0.01; ∗∗∗p < 0.001; ∗∗∗∗p < 0.0001). Representative COVID-19 contour plots are shown with healthy control contour plots and full B cell flow cytometry gating strategy outlined (Figure S6). (F) Association of activated B cell frequency in peripheral blood with maximum CRP level, symptom duration at blood draw, and total length of hospital stay in all symptomatic COVID-19 patients (n = 29) with moderate to severe illness as defined by the clinical criteria listed in Table S4. Correlation is shown by linear regression with individual patients, 95% confidence bands, R2, and p values shown. See also Figures S6 and S7 and Table S4.
Figure S7
Figure S7
Quantitation of B Cells, Related to Figures 5 and 6 Quantitation of absolute B cell counts was undertaken in all COVID-19 patients in whom a proximal absolute lymphocyte count (ALC) was available in the electronic medical record at states of convalescence (n = 5), severe illness with an intermediate maximum CRP level during hospitalization (< 200 mg/L; severe (CRP int); n = 10), and severe illness with a high maximum CRP level during hospitalization (> 200 mg/L; severe (CRP hi); n = 15) as defined by the clinical criteria listed in Table S4. Data are compared to healthy controls (n = 4), assuming a healthy control ALC of 2.9 (K/uL). Quantitation shown by B cell level for each individual patient with mean, standard deviation, and significance by one-way ANOVA of log % B cell value indicated (p < 0.05, ∗∗p < 0.01, ∗∗∗p < 0.001) for (A) total CD19+ B cells, (B) naive, early transitional (T1/2), and follicular (FO) B cell subsets, (C) activated and double negative (DN) B cell subsets as indicated, and (D) activated and DN B cell subsets as a ratio to the available precursor population (naive, IgD+CD27-).
Figure 7
Figure 7
Activated B Cell Subsets in the Peripheral Blood of Patients with COVID-19 Are Specific for SARS-CoV-2-RBD (A) Representative dot plots showing positive SARS-CoV-2-RBD staining in total CD19+ B cells (left; boxed in red) and B cell subsets (right; colored in red). (B) All CD19+ B cells binding to SARS-CoV-2-RBD shown for COVID-19 patients at states of convalescence (n = 10) and severe illness (n = 4) with summation of total % CoV-2-RBD reactivity by indicated B cell subset and quantitated as mean ± SD with significance by Student’s t test of log % B cell value indicated (p < 0.05). DN2 and DN3 double-negative B cells are CXCR5 low, although DN1 and DN4 B cells are CXCR5 high. Ab-secreting, antibody secreting; DN, double-negative; MZP, marginal zone precursor; SM, switched memory; T, transitional; USM, unswitched memory. Ab-secreting cells included both plasmablasts and plasma cell, though the latter were very rare. See also Figure S6 and Table S4.

Update of

  • The Loss of Bcl-6 Expressing T Follicular Helper Cells and the Absence of Germinal Centers in COVID-19.
    Kaneko N, Kuo HH, Boucau J, Farmer JR, Allard-Chamard H, Mahajan VS, Piechocka-Trocha A, Lefteri K, Osborn M, Bals J, Bartsch YC, Bonheur N, Caradonna TM, Chevalier J, Chowdhury F, Diefenbach TJ, Einkauf K, Fallon J, Feldman J, Finn KK, Garcia-Broncano P, Hartana CA, Hauser BM, Jiang C, Kaplonek P, Karpell M, Koscher EC, Lian X, Liu H, Liu J, Ly NL, Michell AR, Rassadkina Y, Seiger K, Sessa L, Shin S, Singh N, Sun W, Sun X, Ticheli HJ, Waring MT, Zhu AL, Li J, Lingwood D, Schmidt AG, Lichterfeld M, Walker BD, Yu X, Padera RF Jr, Pillai S; Massachusetts Consortium on Pathogen Readiness Specimen Working Group. Kaneko N, et al. SSRN [Preprint]. 2020 Jul 16:3652322. doi: 10.2139/ssrn.3652322. SSRN. 2020. Update in: Cell. 2020 Oct 1;183(1):143-157.e13. doi: 10.1016/j.cell.2020.08.025. PMID: 32742244 Free PMC article. Updated. Preprint.

Comment in

References

    1. Amanat F., Stadlbauer D., Strohmeier S., Nguyen T.H.O., Chromikova V., McMahon M., Jiang K., Arunkumar G.A., Jurczyszak D., Polanco J. A serological assay to detect SARS-CoV-2 seroconversion in humans. Nat. Med. 2020;26:1033–1036. - PMC - PubMed
    1. Brouwer P.J.M., Caniels T.G., van der Straten K., Snitselaar J.L., Aldon Y., Bangaru S., Torres J.L., Okba N.M.A., Claireaux M., Kerster G. Potent neutralizing antibodies from COVID-19 patients define multiple targets of vulnerability. Science. 2020;369:643–650. - PMC - PubMed
    1. Buja L.M., Wolf D.A., Zhao B., Akkanti B., McDonald M., Lelenwa L., Reilly N., Ottaviani G., Elghetany M.T., Trujillo D.O. The emerging spectrum of cardiopulmonary pathology of the coronavirus disease 2019 (COVID-19): report of 3 autopsies from Houston, Texas, and review of autopsy findings from other United States cities. Cardiovasc. Pathol. 2020;48:107233. - PMC - PubMed
    1. Crotty S. T follicular helper cell differentiation, function, and roles in disease. Immunity. 2014;41:529–542. - PMC - PubMed
    1. Ecker R.C., Steiner G.E. Microscopy-based multicolor tissue cytometry at the single-cell level. Cytometry A. 2004;59:182–190. - PubMed

Publication types

Substances