

Carex muskingumensis and Osmotic Stress: Identification of Reference Genes for Transcriptional Profiling by RT-qPCR
- PMID: 32878033
- PMCID: PMC7563777
- DOI: 10.3390/genes11091022
Carex muskingumensis and Osmotic Stress: Identification of Reference Genes for Transcriptional Profiling by RT-qPCR
Abstract
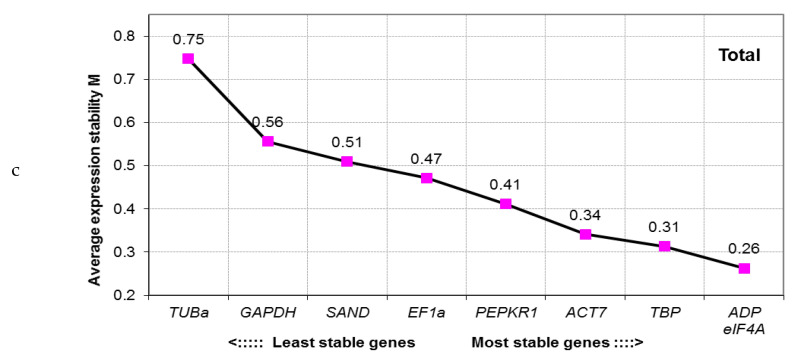
Carex muskingumensis is a highly valued perennial ornamental grass cultivated worldwide. However, there is limited genetic data regarding this species. Selection of proper reference genes (RGs) for reverse transcription quantitative PCR (RT-qPCR) data normalization has become an essential step in gene expression analysis. In this study, we aimed to examine expression stability of nine candidate RGs in C. muskingumensis plants, subjected to osmotic stress, generated either by salinity or PEG treatment. The identification of genes exhibiting high expression stability was performed by four algorithms (geNorm, NormFinder, BestKeeper and deltaCt method). The results showed that the combination of two genes would be sufficient for reliable expression data normalization. ADP (ADP-ribosylation factor) and TBP (TATA-box-binding protein) were identified as the most stably expressed under salinity treatment, while eIF4A (eukaryotic initiation factor 4A) and TBP were found to show the highest stability under PEG-induced drought. A set of three genes (ADP, eIF4A and TBP) displayed the highest expression stability across all experimental samples tested in this study. To our best knowledge, this is the first report regarding RGs selection in C. muskingumensis. It will provide valuable starting point information for conducting further analyses in this and related species concerning their responses to water shortage and salinity stress.
Keywords: RT-qPCR; drought; reference genes; salinity; sedges.
Conflict of interest statement
The authors declare no conflict of interest.
Figures


References
-
- Reznicek A.A. Sectional Names in Carex (Cyperaceae) for the Flora of North America. Novon. 2001;11:454–459. doi: 10.2307/3393160. - DOI
-
- Mohlenbrock R.H. The Illustrated Flora of Illinois. 2nd ed. Southern Illinois University Press; Carbondale, IL, USA: 2011. [(accessed on 14 April 2020)]. Sedges: Carex. Available online: https://opensiuc.lib.siu.edu/siupress_flora_of_illinois/8.
-
- Ansari W.A., Atri N., Pandey M., Singh A.K., Singh B., Pandey S. Influence of Drought Stress on Morphological, Physiological and Biochemical Attributes of Plants: A Review. Biosci. Biotechnol. Res. Asia. 2019;16:697–709. doi: 10.13005/bbra/2785. - DOI
-
- Safdar H., Amin A., Shafiq Y., Ali A., Yasin R., Shoukat A., Sarwar M.I. A review: Impact of salinity on plant growth. Nat. Sci. 2019;17:34–40.
MeSH terms
Substances
LinkOut - more resources
Full Text Sources
Miscellaneous
