. 2020 Nov 1;205(9):2437-2446.
doi: 10.4049/jimmunol.2000717. Epub 2020 Sep 2.

Expansion of SARS-CoV-2-Specific Antibody-Secreting Cells and Generation of Neutralizing Antibodies in Hospitalized COVID-19 Patients

Affiliations

Expansion of SARS-CoV-2-Specific Antibody-Secreting Cells and Generation of Neutralizing Antibodies in Hospitalized COVID-19 Patients

Renata Varnaitė et al. J Immunol. .

Abstract

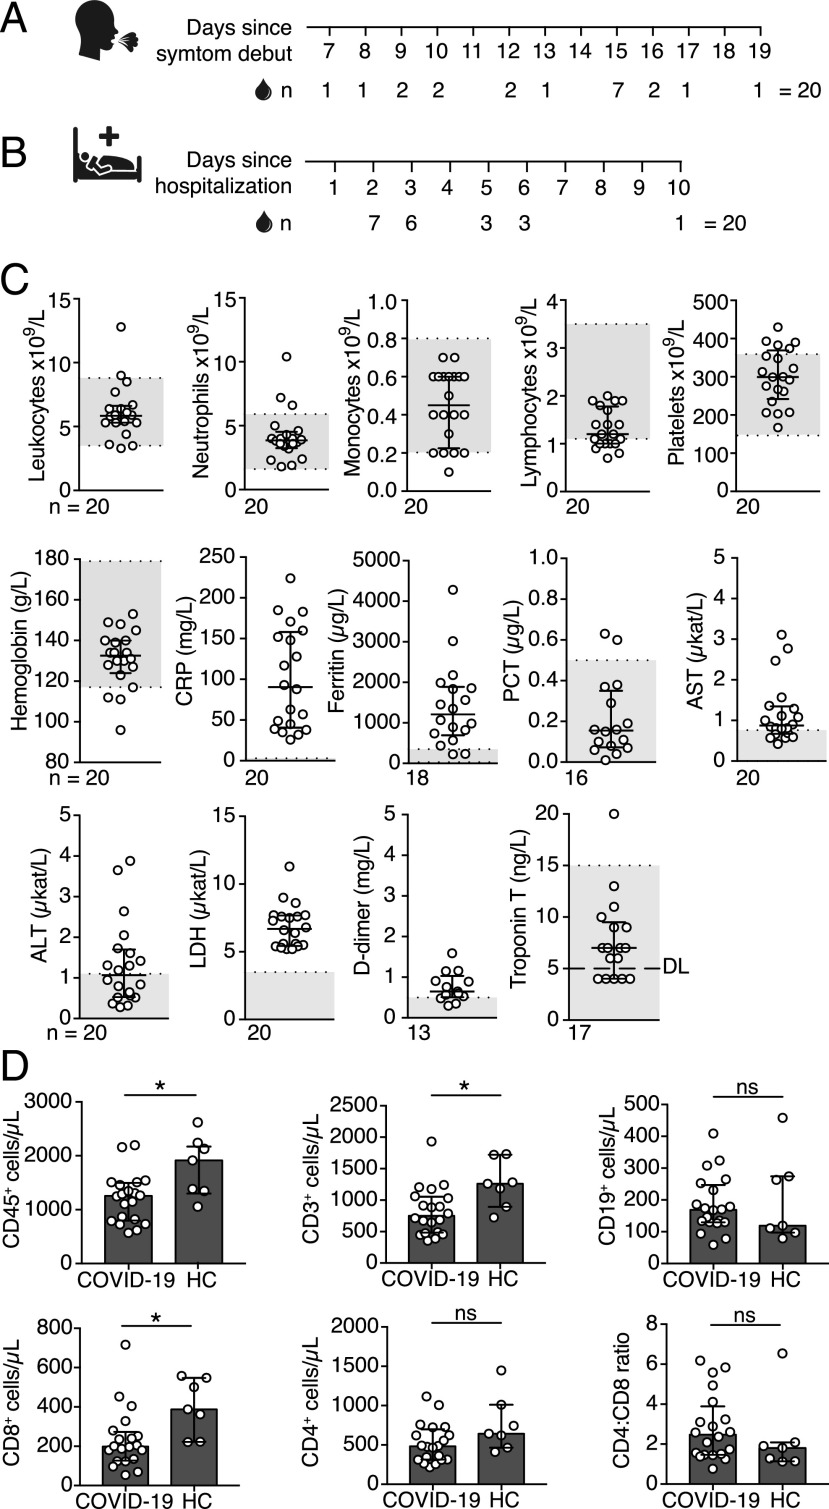
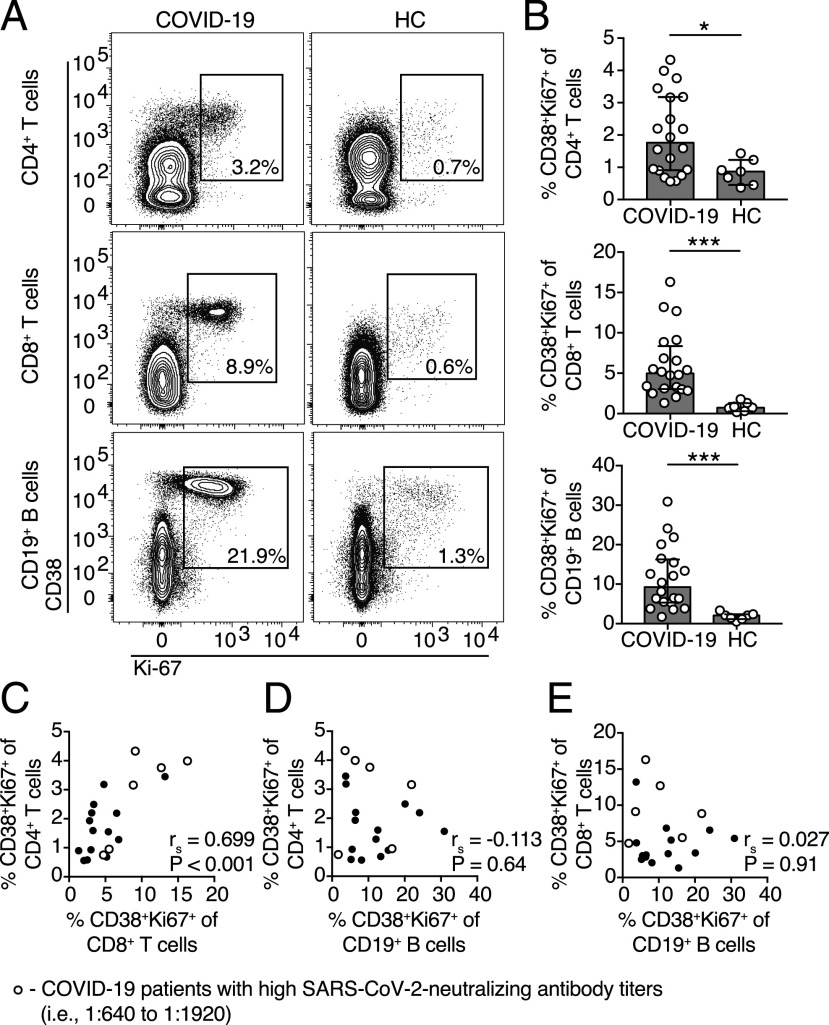
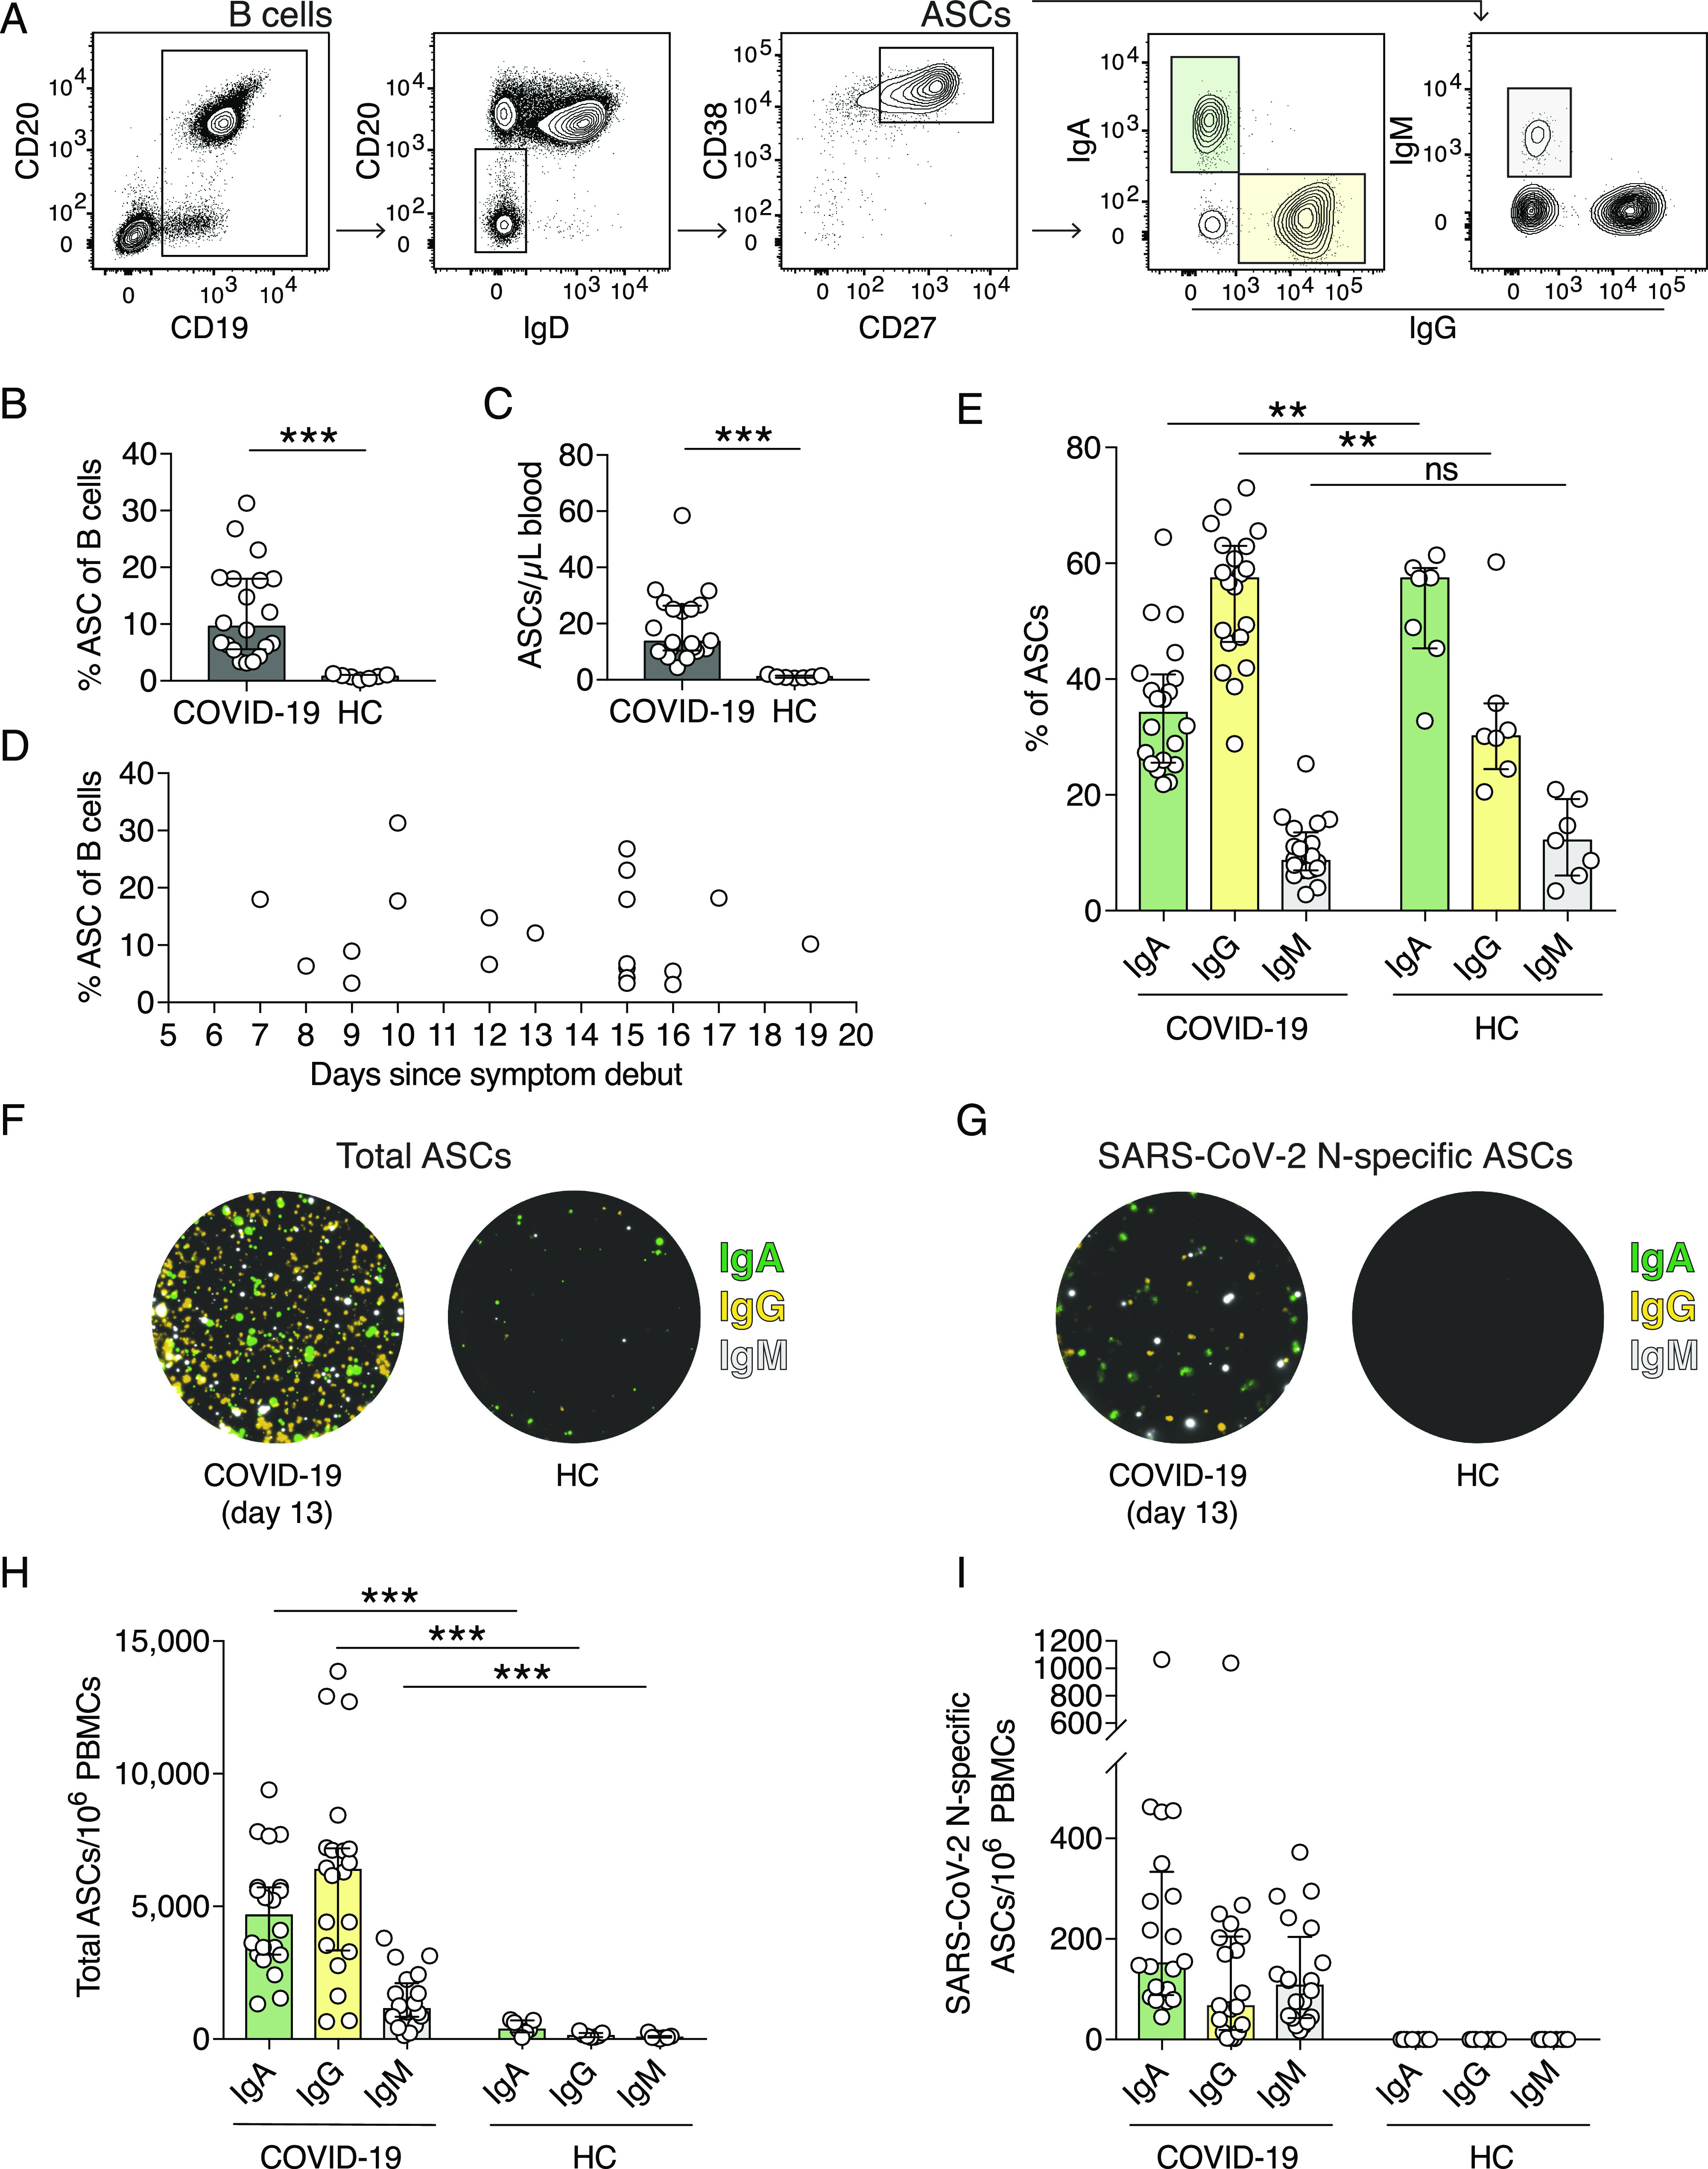
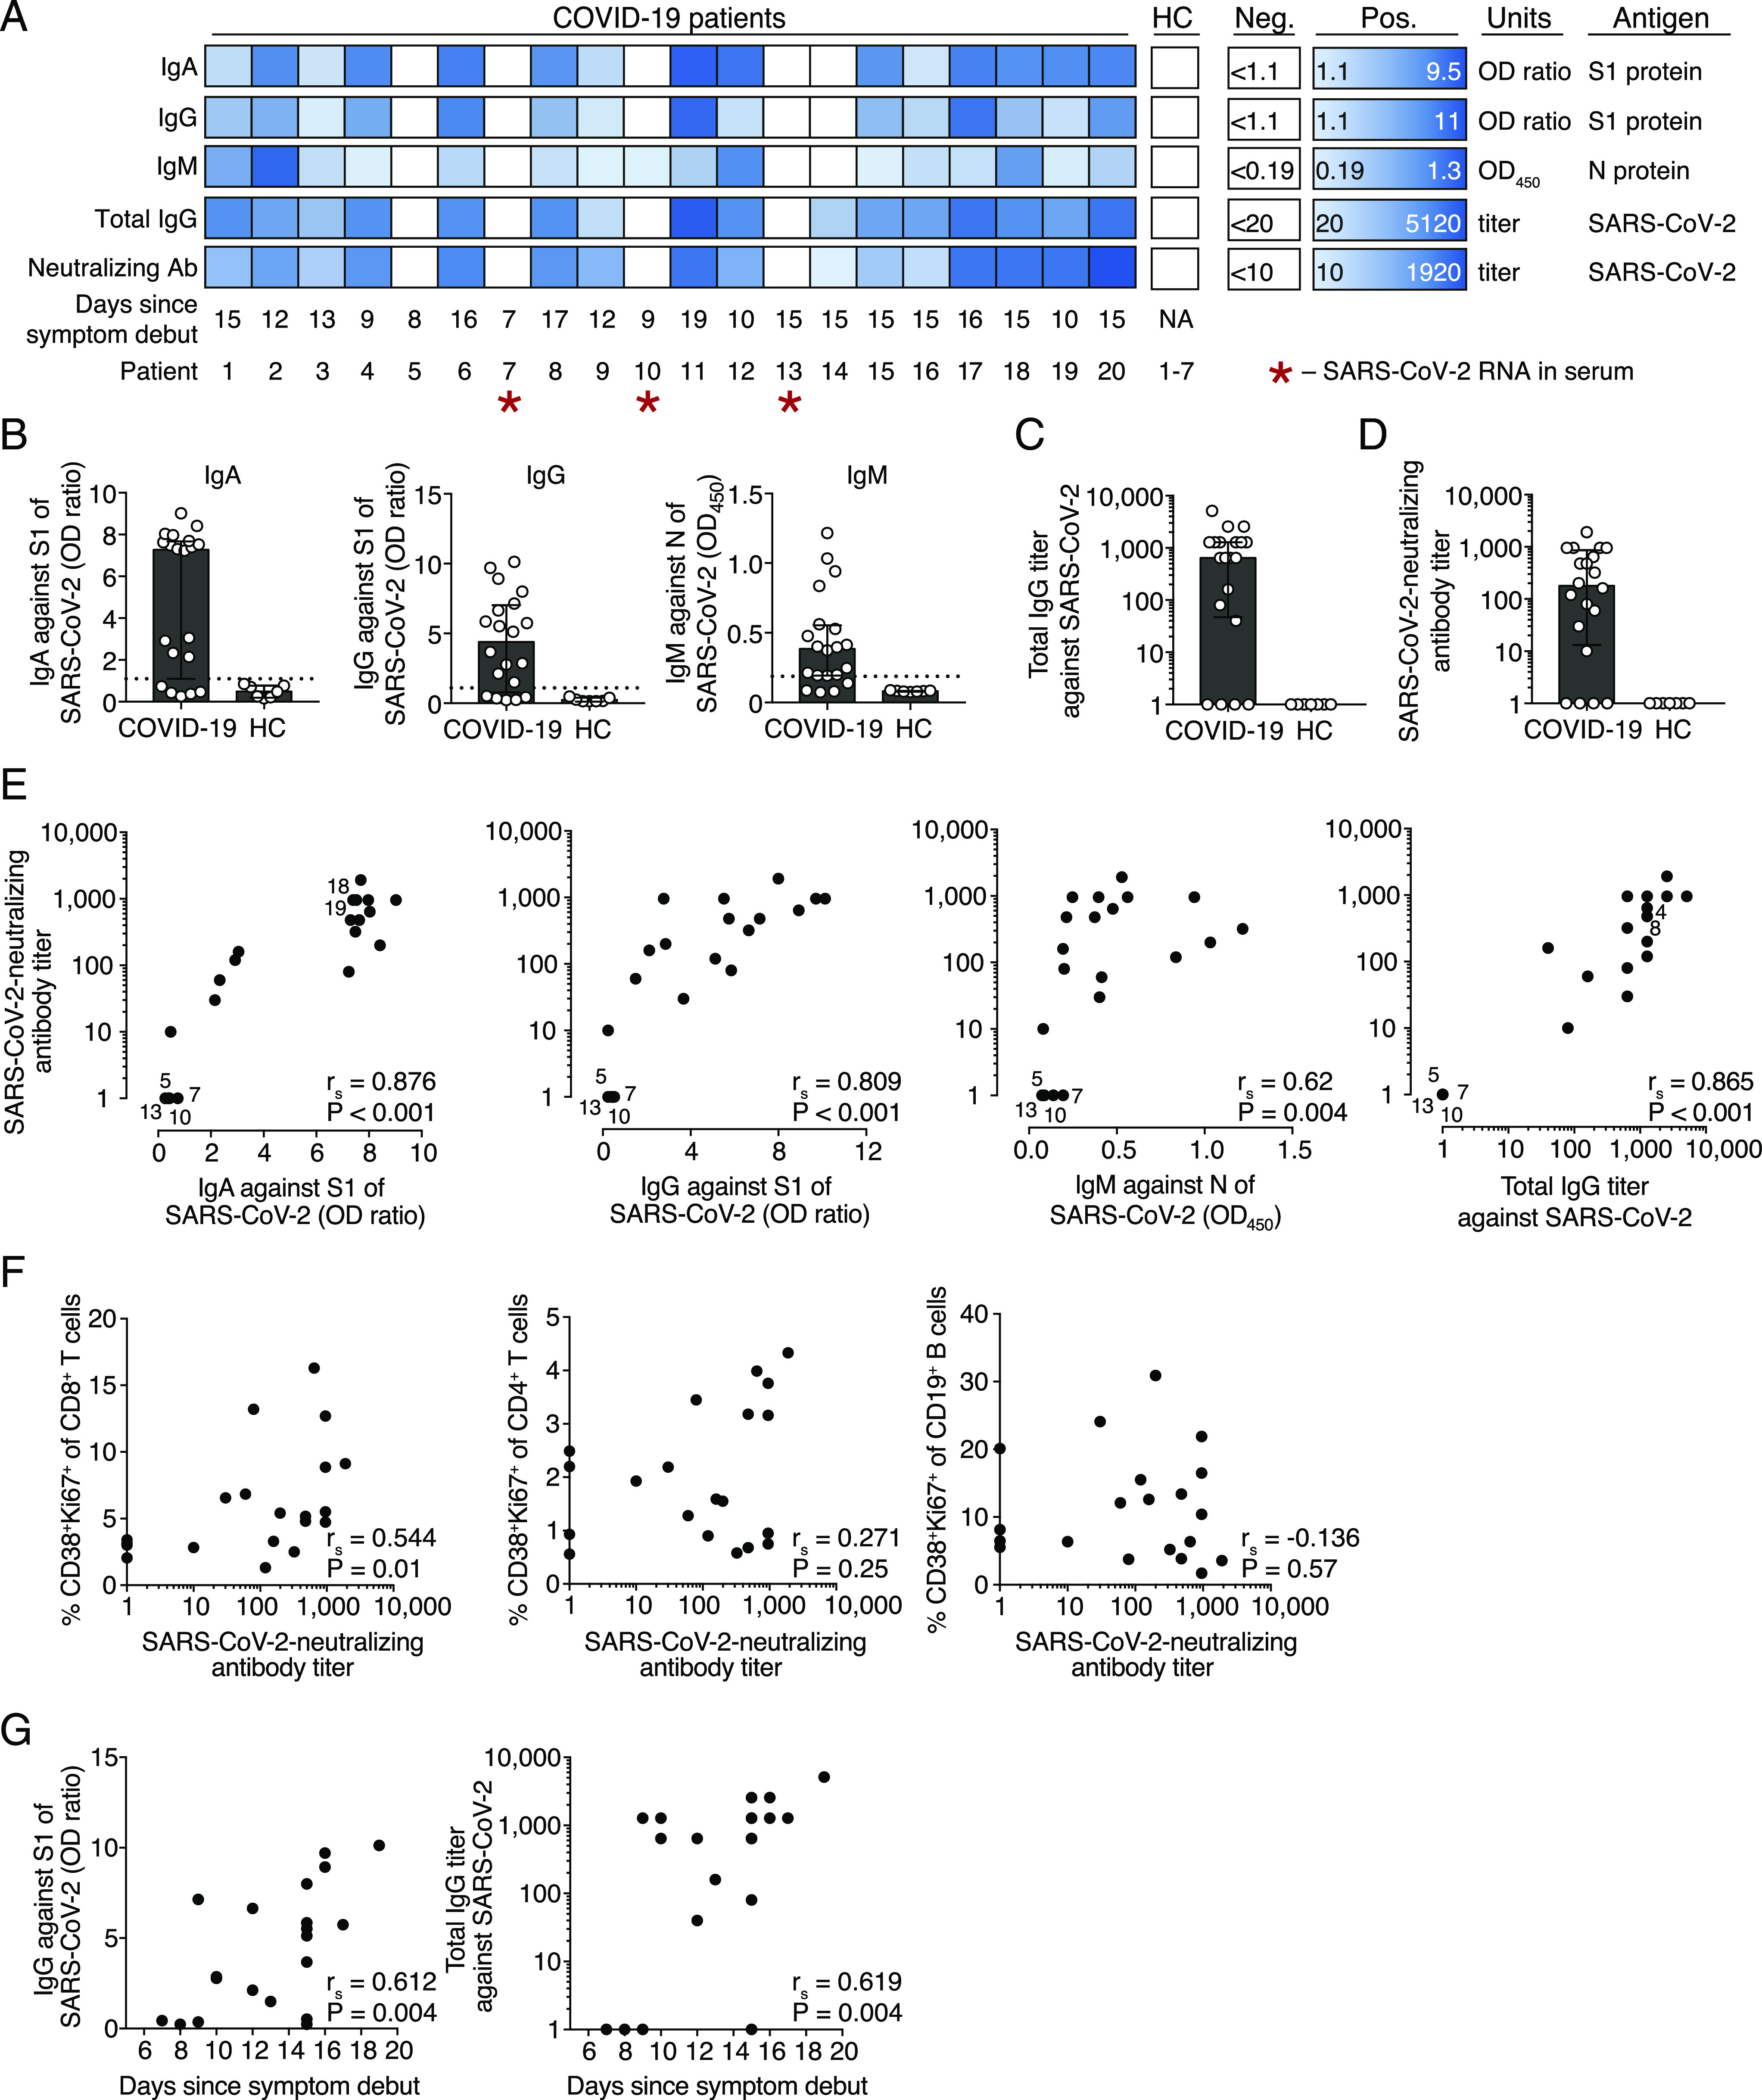
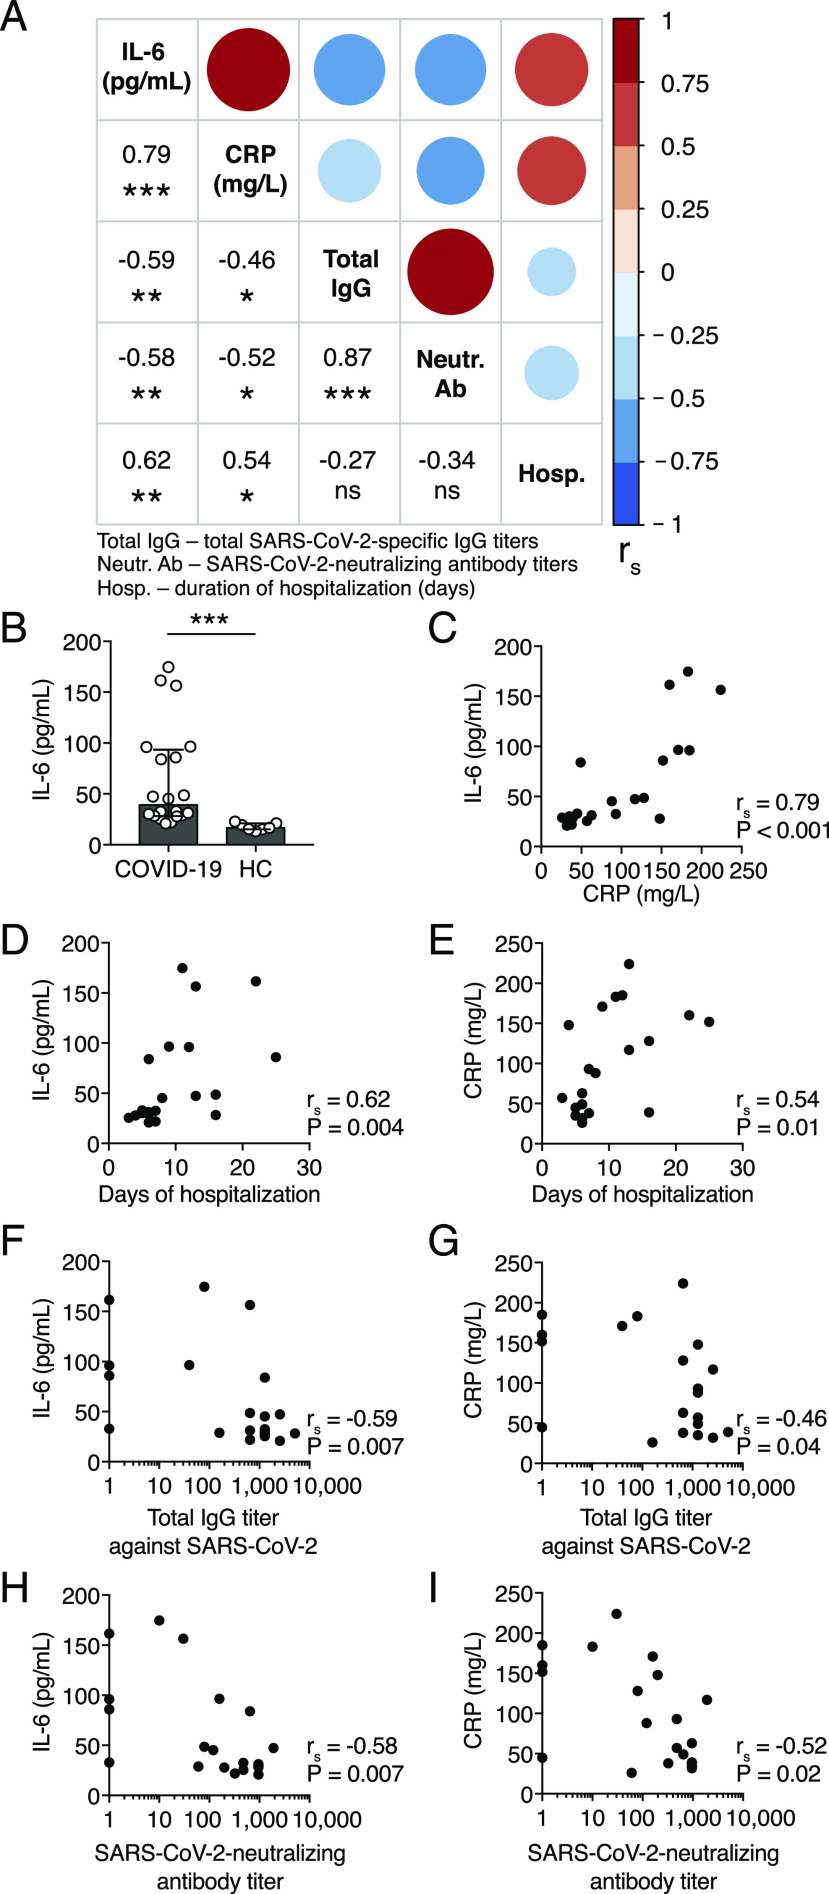
Coronavirus disease 2019 (COVID-19), caused by severe acute respiratory syndrome coronavirus 2 (SARS-CoV-2), emerged in late 2019 and has since become a global pandemic. Pathogen-specific Abs are typically a major predictor of protective immunity, yet human B cell and Ab responses during COVID-19 are not fully understood. In this study, we analyzed Ab-secreting cell and Ab responses in 20 hospitalized COVID-19 patients. The patients exhibited typical symptoms of COVID-19 and presented with reduced lymphocyte numbers and increased T cell and B cell activation. Importantly, we detected an expansion of SARS-CoV-2 nucleocapsid protein-specific Ab-secreting cells in all 20 COVID-19 patients using a multicolor FluoroSpot Assay. Out of the 20 patients, 16 had developed SARS-CoV-2-neutralizing Abs by the time of inclusion in the study. SARS-CoV-2-specific IgA, IgG, and IgM Ab levels positively correlated with SARS-CoV-2-neutralizing Ab titers, suggesting that SARS-CoV-2-specific Ab levels may reflect the titers of neutralizing Abs in COVID-19 patients during the acute phase of infection. Last, we showed that IL-6 and C-reactive protein serum concentrations were higher in patients who were hospitalized for longer, supporting the recent observations that IL-6 and C-reactive protein could be used as markers for COVID-19 severity. Altogether, this study constitutes a detailed description of clinical and immunological parameters in 20 COVID-19 patients, with a focus on B cell and Ab responses, and describes tools to study immune responses to SARS-CoV-2 infection and vaccination.


Conflict of interest statement

The authors have no financial conflicts of interest.

Figures

FIGURE 1.
FIGURE 1.
Clinical chemistry parameters in peripheral blood of COVID-19 patients. (A) Number of days between COVID-19 symptom debut and peripheral blood sampling. (B) Number of days between hospitalization and peripheral blood sampling. (C) Blood cell counts and clinical chemistry parameters in peripheral blood of COVID-19 patients measured on the day of the inclusion in this study (±24 h). Gray boxes indicate the range for reference values. (D) Absolute numbers of CD45+, CD3+, CD4+, CD8+, CD19+ cells, and CD4:CD8 T cell ratio in peripheral blood of COVID-19 patients (n = 20) and healthy controls (HC) (n = 7) measured by flow cytometry. Graphs display median and IQR. Statistical significance was determined using Mann–Whitney U test (D). *p < 0.05. ALT, alanine transaminase; AST, aspartate transaminase; DL, detection limit; LDH, lactate dehydrogenase; ns, not significant; PCT, procalcitonin.
FIGURE 2.
FIGURE 2.
T cells and B cells are activated in the peripheral blood of COVID-19 patients. (A) Representative flow cytometry plots of CD38 and Ki-67 coexpression in CD4+ and CD8+ T cells as well as CD19+ B cells in one representative COVID-19 patient (16 d after symptom onset) and one healthy control (HC). (B) Frequencies of CD38 and Ki-67 coexpressing CD4+ T cells, CD8+ T cells, and CD19+ B cells in COVID-19 patients (n = 20) and healthy donors (n = 7). (CE) Spearman correlation between the frequencies of CD38 and Ki-67 coexpressing CD4+ T cells, CD8+ T cells, and CD19+ B cells in COVID-19 patients. Bar graphs display median and IQR. Statistical significance was determined using Mann–Whitney U test. p < 0.05 was considered statistically significant. *p < 0.05, ***p < 0.001.
FIGURE 3.
FIGURE 3.
SARS-CoV-2 N protein–specific ASCs expand in COVID-19 patients. (A) Flow cytometry gating strategy used to identify ASCs and the IgA–, IgG–, and IgM–ASC subsets. B cells are gated on live CD14CD123CD3CD4 cells. (B) Frequencies of ASCs within all B cells in COVID-19 patients and in healthy controls (HCs). ASCs were defined as CD19+CD20low/−IgDCD38highCD27high. (C) Numbers of ASCs per microliter of whole blood calculated using absolute CD19+ B cell numbers and frequencies of ASCs measured by flow cytometry. (D) ASC frequencies within all B cells in regards to the number of days since COVID-19 symptom debut. (E) Frequencies of IgA–, IgG–, and IgM–ASCs within the total ASC population measured by flow cytometry. (F and G) Representative images of wells from a FluoroSpot Assay showing total IgA–, IgG–, and IgM–ASCs (F) and SARS-CoV-2 N protein–specific ASCs (G) from one COVID-19 patient (13 d after symptom onset) and one healthy control. IgM fluorescence is originally red but replaced with white in this figure for visualization purposes. (H) Numbers of total IgA–, IgG–, and IgM–ASCs per million PBMCs as measured by FluoroSpot Assay. (I) Numbers of SARS-CoV-2 N protein–specific IgA–, IgG–, and IgM–ASCs per million PBMCs. Experiments were performed on all COVID-19 patients (n = 20) and healthy controls (n = 7). Bar graphs display median and IQR. Statistical significance was determined using Mann–Whitney U test (B, C, E, and H). **p < 0.01, ***p < 0.001. ns, not significant.
FIGURE 4.
FIGURE 4.
SARS-CoV-2–specific and neutralizing Ab levels in COVID-19 patients. (A) Individual Ab responses to SARS-CoV-2 in COVID-19 patients (n = 20) and healthy controls (HC) (n = 7). Positivity for IgA against S1 protein, IgG against S1 protein, IgM against N protein, total IgG Abs against whole SARS-CoV-2, and SARS-CoV-2–neutralizing Ab titers are presented in the heatmap. The color scale is adjusted for the smallest and the highest positive value recorded in the patient cohort within each assay (Pos.). White boxes indicate values below positive threshold or below detection level for each assay (Neg.). (B) IgA, IgG, and IgM Ab levels in COVID-19 patients and controls, analyzed by ELISAs. Dotted horizontal line indicates the threshold for positive result. OD ratio is the OD of the sample divided by the OD of the calibrator. (C) Total SARS-CoV-2–specific IgG Ab titers determined by IFA. Patients with titers <20 were assigned a value of 1. (D) SARS-CoV-2–neutralizing Ab titers determined by microneutralization assay. Patients with titers <10 were assigned a value of 1. (E) Spearman correlation between SARS-CoV-2–specific IgA, IgG, and IgM Ab titers and SARS-CoV-2–neutralizing Ab titers. Overlapping data points are highlighted with patient numbers. (F) Spearman correlation between activated CD8+ T cells, CD4+ T cells, CD19+ B cells, and SARS-CoV-2–neutralizing Ab titers. (G) Spearman correlation between S1-specific IgG levels, total IgG titers against SARS-CoV-2 (measured by IFA), and the number of days between COVID-19 symptom debut and sampling. Bar graphs display median and IQR. p < 0.05 was considered statistically significant.
FIGURE 5.
FIGURE 5.
Correlations between the levels of IL-6, CRP, SARS-CoV-2–specific Abs, and the duration of COVID-19. (A) Spearman correlation matrix for serum concentration of IL-6, CRP, total SARS-CoV-2–specific IgG titers, SARS-CoV-2–neutralizing Ab titers, and the duration of hospitalization of COVID-19 patients. The color scale, circle sizes, and numbers represent the degree of correlation between the variables (i.e., rs). (B) Serum concentrations of IL-6 in COVID-19 patients and healthy controls. (CI) Spearman correlation between serum concentrations of IL-6, CRP, the number of days of hospitalization, total SARS-CoV-2–specific IgG, and SARS-CoV-2–neutralizing Ab titers for COVID-19 patients. Bar graph displays median and IQR. Statistical significance was determined using Mann–Whitney U test. Correlations were examined by Spearman correlation. *p < 0.05, **p < 0.01, ***p < 0.001. ns, not significant.

Similar articles

Cited by

References

    1. Zhou P., Yang X.-L., Wang X.-G., Hu B., Zhang L., Zhang W., Si H. R., Zhu Y., Li B., Huang C. L., et al. 2020. A pneumonia outbreak associated with a new coronavirus of probable bat origin. Nature 579: 270–273. - PMC - PubMed
    1. Huang C., Wang Y., Li X., Ren L., Zhao J., Hu Y., Zhang L., Fan G., Xu J., Gu X., et al. 2020. Clinical features of patients infected with 2019 novel coronavirus in Wuhan, China. [Published erratum appears in 2020 Lancet 395: 496.] Lancet 395: 497–506. - PMC - PubMed
    1. Nutt S. L., Hodgkin P. D., Tarlinton D. M., Corcoran L. M. 2015. The generation of antibody-secreting plasma cells. Nat. Rev. Immunol. 15: 160–171. - PubMed
    1. Huang K.-Y. A., Li C. K.-F., Clutterbuck E., Chui C., Wilkinson T., Gilbert A., Oxford J., Lambkin-Williams R., Lin T.-Y., McMichael A. J., Xu X.-N. 2014. Virus-specific antibody secreting cell, memory B-cell, and sero-antibody responses in the human influenza challenge model. J. Infect. Dis. 209: 1354–1361. - PubMed
    1. Wrammert J., Onlamoon N., Akondy R. S., Perng G. C., Polsrila K., Chandele A., Kwissa M., Pulendran B., Wilson P. C., Wittawatmongkol O., et al. 2012. Rapid and massive virus-specific plasmablast responses during acute dengue virus infection in humans. J. Virol. 86: 2911–2918. - PMC - PubMed

Publication types

MeSH terms