. 2020 Oct 1;133(19):jcs250837.
doi: 10.1242/jcs.250837.

Amalgam regulates the receptor tyrosine kinase pathway through Sprouty in glial cell development in the Drosophila larval brain

Affiliations

Amalgam regulates the receptor tyrosine kinase pathway through Sprouty in glial cell development in the Drosophila larval brain

Majd M Ariss et al. J Cell Sci. .

Abstract

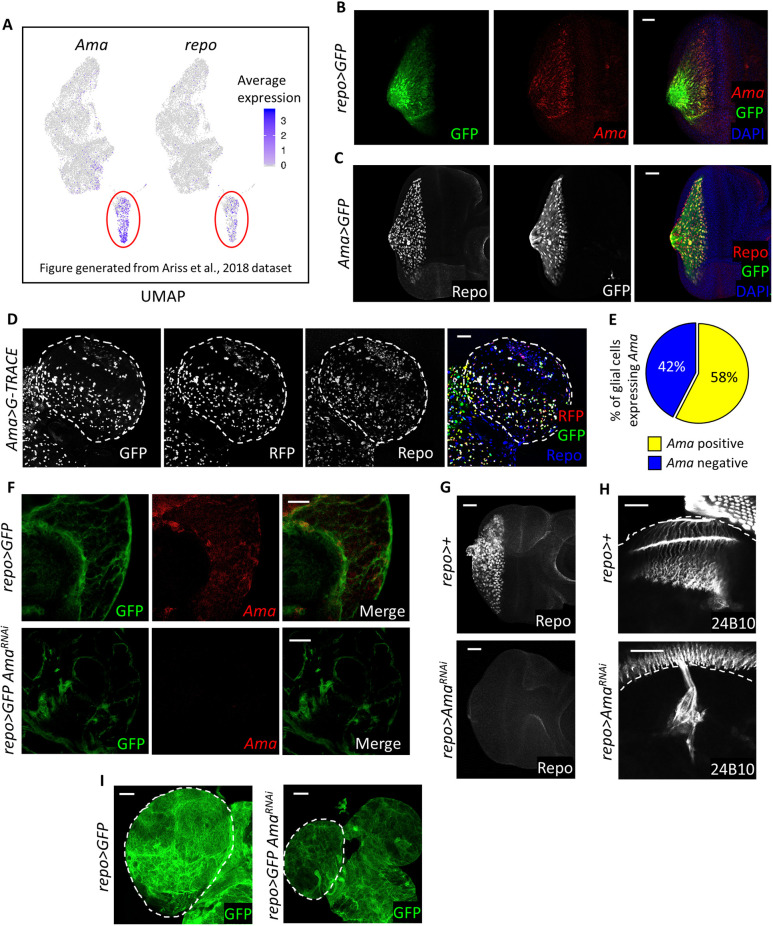
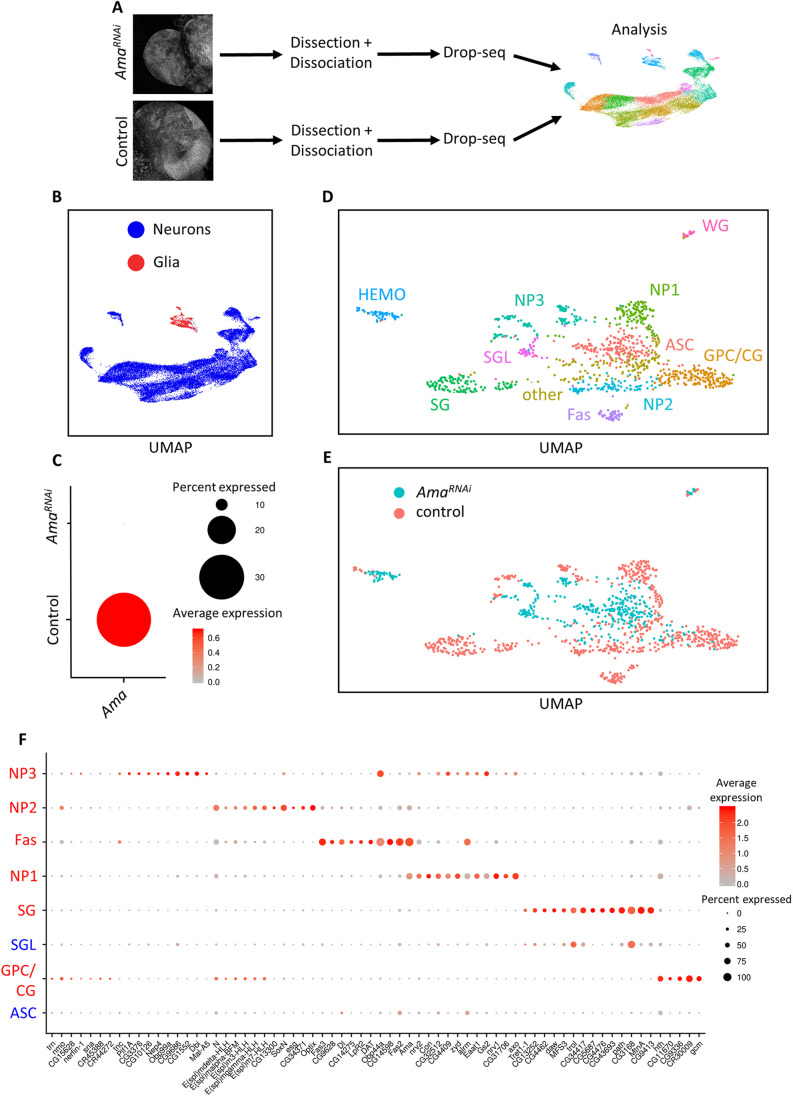
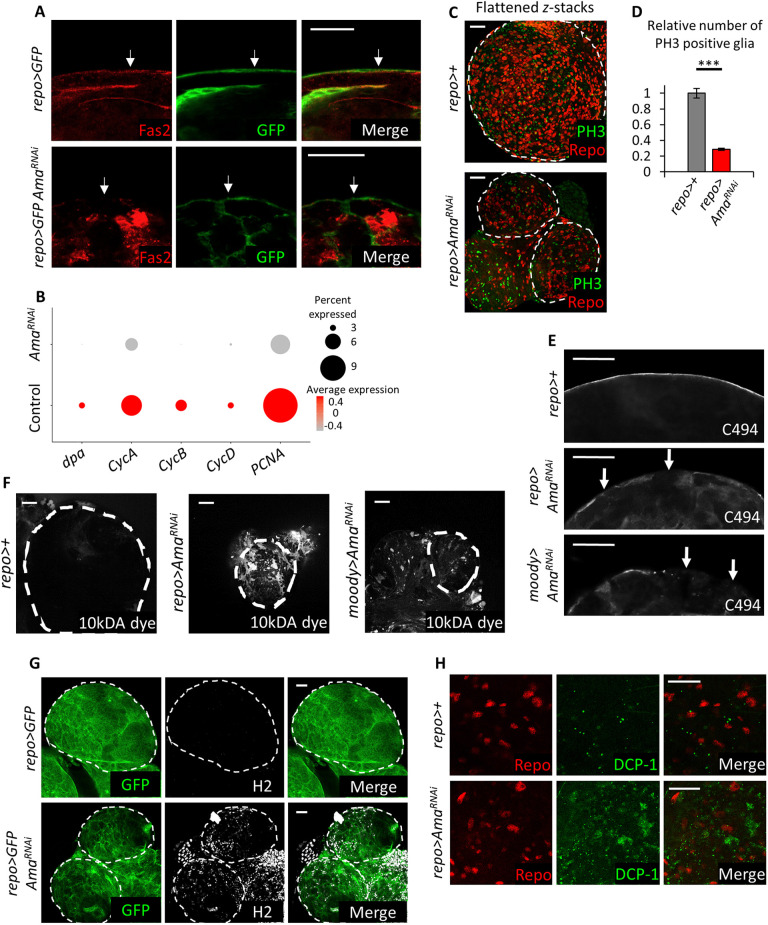
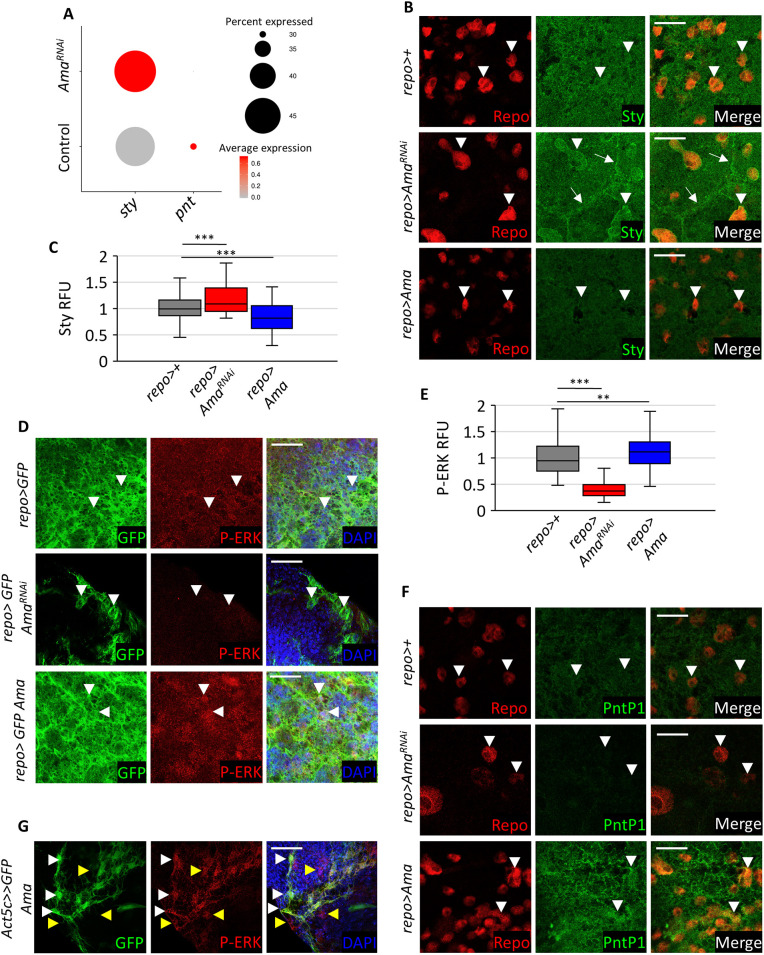
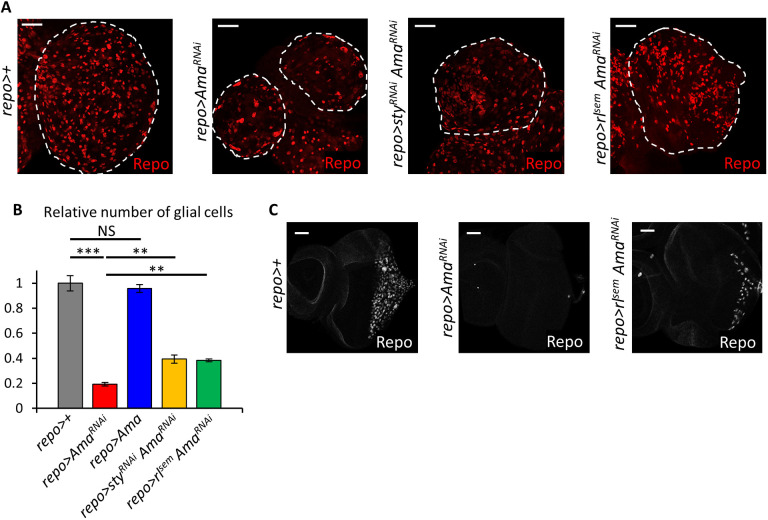
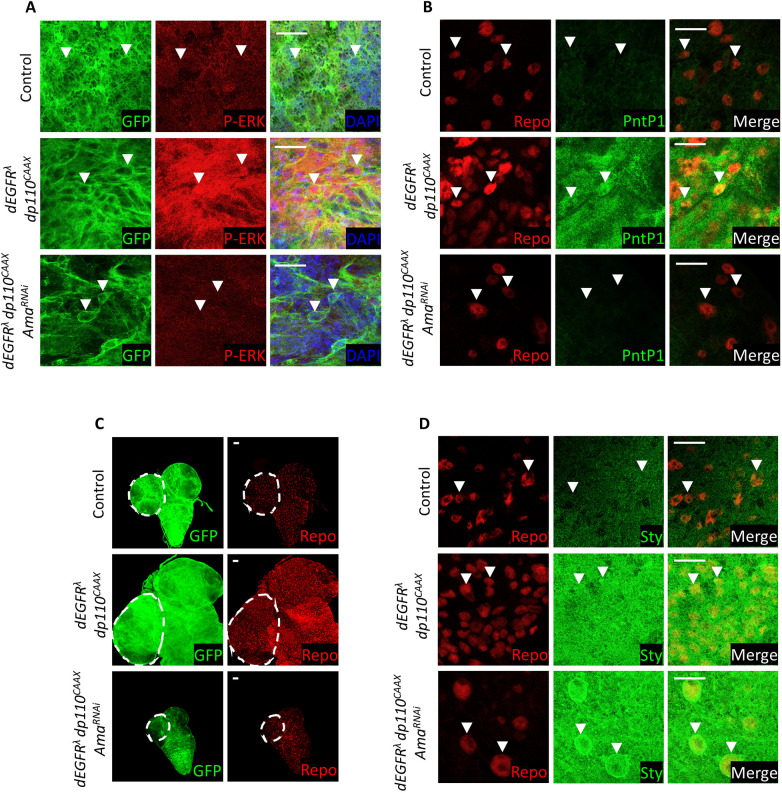
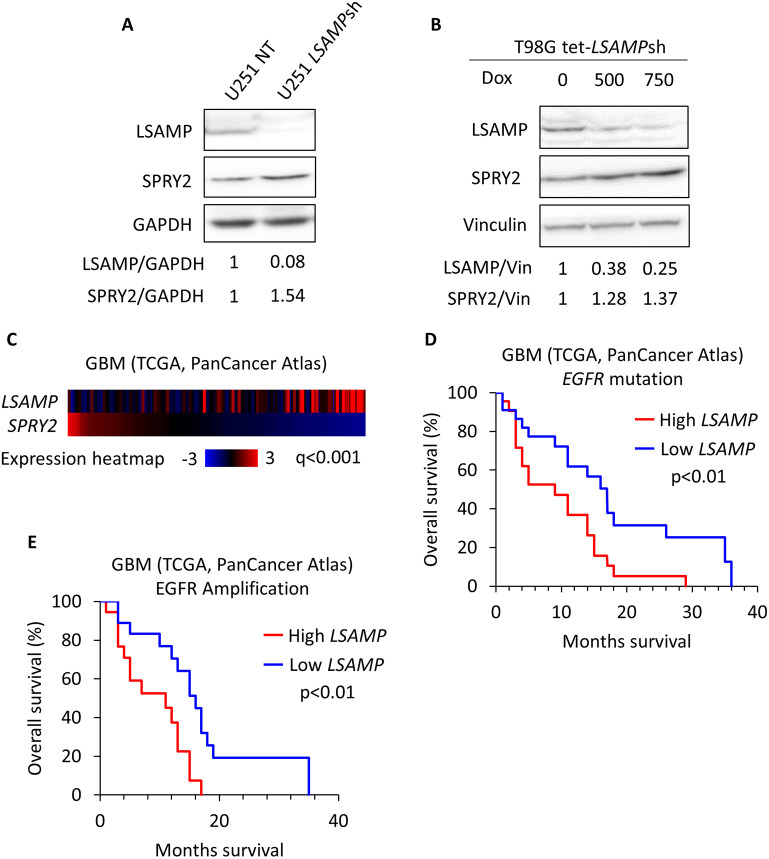
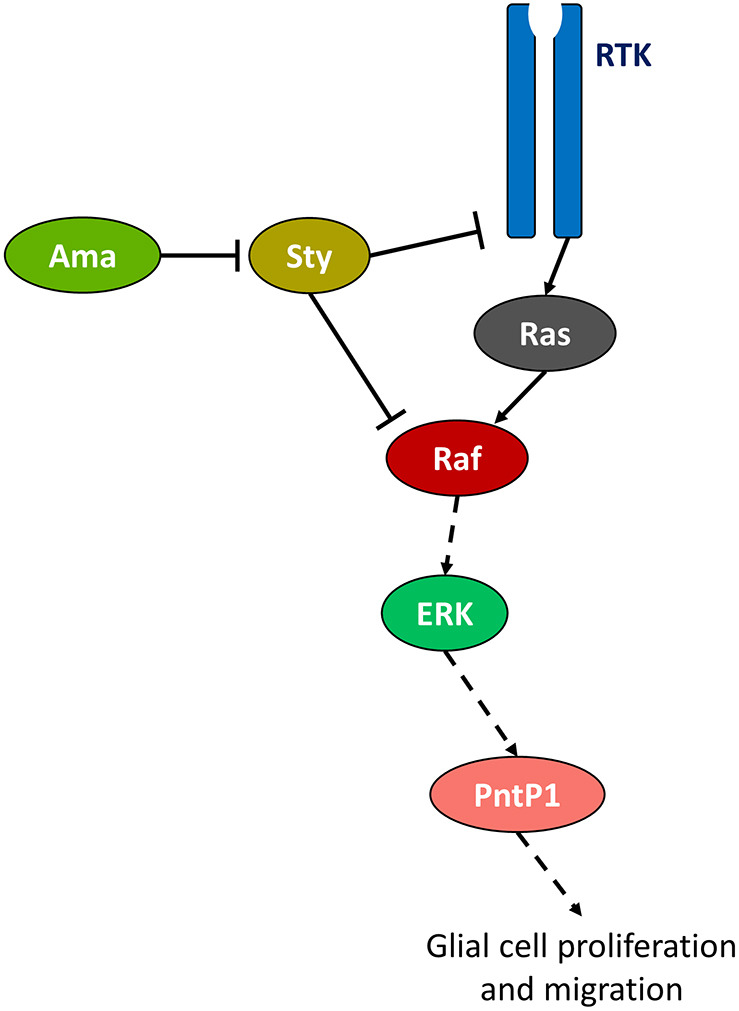
The receptor tyrosine kinase (RTK) pathway plays an essential role in development and disease by controlling cell proliferation and differentiation. Here, we profile the Drosophila larval brain by single-cell RNA-sequencing and identify Amalgam (Ama), which encodes a cell adhesion protein of the immunoglobulin IgLON family, as regulating the RTK pathway activity during glial cell development. Depletion of Ama reduces cell proliferation, affects glial cell type composition and disrupts the blood-brain barrier (BBB), which leads to hemocyte infiltration and neuronal death. We show that Ama depletion lowers RTK activity by upregulating Sprouty (Sty), a negative regulator of the RTK pathway. Knockdown of Ama blocks oncogenic RTK signaling activation in the Drosophila glioma model and halts malignant transformation. Finally, knockdown of a human ortholog of Ama, LSAMP, results in upregulation of SPROUTY2 in glioblastoma cell lines, suggesting that the relationship between Ama and Sty is conserved.

Keywords: Blood–brain barrier; Drosophila; LSAMP; Receptor tyrosine kinase; Single-cell RNA-sequencing; Sprouty.


Conflict of interest statement

Competing interestsThe authors declare no competing or financial interests.

Figures

Fig. 1.
Fig. 1.
Ama is expressed in glia and is required in glial development. (A) Feature plots displaying the expression of genes on the UMAP clusters of a previously published third-instar eye disc scRNA-seq dataset (Ariss et al., 2018), showing that Ama and repo are co-expressed in the same cluster. (B) FISH for Ama mRNA in the eye disc showing expression in glial cells with glial membranes labeled by GFP. Final genotype: repo>mCD8GFP. (C) Repo immunofluorescence in the eye disc displaying expression in Ama-positive cells labeled by GFP. (D) Repo immunofluorescence in the third-instar brain (dashed outline) of Ama>G-TRACE showing the lineage and real-time expression of Ama-Gal4. GFP labels the lineage, whereas RFP represents the real-time expression. (E) Pie chart outlying the percentage of glial cells expressing Ama. Z-stacks of Ama>G-TRACE brains were counted. Data represent means of three experiments (Table S8). (F) FISH for Ama mRNA in the brain showing that there is expression in glial cells, with glial membranes labeled by GFP. Knockdown of Ama in glia results in loss of the FISH signal. Final genotypes: repo>mCD8GFP (top panel) repo>mCD8GFP AmaRNAi (bottom panel). (G) Repo immunofluorescence shows the lack of glia in the eye disc following Ama depletion. (H) Immunofluorescence using 24B10 antibody to label photoreceptor axons indicates defects in axons guidance in repo>AmaRNAi. The dashed lines indicate the outline of the brain. (I) Brains (outlined by dashed lines) are smaller in repo>AmaRNAi than in repo>GFP. GFP labels glial cell membranes. Final genotypes: repo>mCD8GFP (left panel) repo>mCD8GFP AmaRNAi (right panel). Scale bars: 20 µm.
Fig. 2.
Fig. 2.
scRNA-seq identifies cellular perturbations following Ama knockdown. (A) Illustration of scRNA-seq pipeline. Third-instar larval brains from Control (repo>+) and AmaRNAi (repo>AmaRNAi) were dissected then dissociated into a single-cell suspension. Drop-seq was performed to capture single cells and generate cDNA libraries. Following alignment and generating a single-cell gene expression matrix, the samples were analyzed using Seurat to unbiasedly find cell clusters having distinct gene expression profiles. (B) UMAP of 25,700 cells outlying the neuronal and glial cells from the combined repo>+ (16,553 cells) and repo>AmaRNAi (9147 cells) scRNA-seq brains. (C) Dot plot in repo>+ and repo>AmaRNAi brains displaying the depletion of Ama expression using scRNA-seq. The red color represents the average expression of Ama (average log fold change), whereas the size of the dot represents the percentage of cells expressing Ama. (D) UMAP from the supervised analysis on glial cells from repo>+ and repo>AmaRNAi brains displaying ten distinct clusters. GPC/CG, glia precursor cells/cortex glia; ASC, AmaRNAi specific cluster; SG, surface glia; SGL, surface glia-like; NP1, neuropil glia 1; NP2, neuropil glia 2; NP3=neuropil glia 3; Fas, fasciclin cluster. (E) UMAP from D showing the genotype of each cell. (F) Dot plot displaying the top markers in different clusters from the analysis in D. The red color gradient shows the average expression of the genes (average log fold change), whereas the dot size shows the percentage of cells in the cluster expressing the gene. ASC glia do not share markers of other control glial cluster. SGL share markers with SG cells. Clusters labeled in red are observed in the repo>+ supervised glial analysis. Clusters labeled in blue are additional clusters that appeared after pooling repo>+ cells with repo>AmaRNAi brains. HEMO and WG are excluded as they originate from the hemolymph and the peripheral nervous system, respectively, and not the brain. In this analysis, GPC and CG results were pooled.
Fig. 3.
Fig. 3.
Ama depletion decreases glial cell proliferation and disrupts the BBB. (A) Immunofluorescence images showing that there is a decrease in Fas2 in surface glia following Ama knockdown. Final genotype: repo>mCD8GFP (top panel) repo>mCD8GFP AmaRNAi (bottom panel). White arrow points at surface glia. (B) Dot plot indicating a decrease in expression level of cell cycle genes dpa, CycA, CycB, CycD, and PCNA using scRNA-seq in repo>+ and repo>AmaRNAi glia. The red color gradient represents the average expression of the genes (average log fold change), whereas the size of the dot represents the percentage of cells expressing the genes. (C) Flattened z-stacks of repo>+ and repo>AmaRNAi brain immunofluorescence with REPO and PH3 showing that Ama knockdown decreases overall Repo and PH3 colocalization. (D) Quantification of Repo and PH3 colocalization in C reveals a significant reduction in mitotically active glia following Ama depletion. Z-stacks from repo>+ (n=5) and repo>AmaRNAi (n=6) brains were counted and normalized to the average count in repo>+ (set at 1). Data represents the mean±s.e.m. after normalization. ***P<0.001 (Student's t-test; Table S9). (E) C494 immunofluorescence labeling SPG of third-instar larval brains showing discontinuous surface glia membranes following Ama knockdown. White arrows point to discontinuous membranes. (F) Brains labeled with 10 kDa dextran dye indicates that Ama knockdown increases dye penetration in the tissue, implying a damaged BBB. (G) Immunofluorescence using pan hemocyte H2 antibody shows a strong signal in the brain in repo>AmaRNAi. (H) Cleaved DCP-1 immunofluorescence shows a neuronal apoptotic signal in repo>AmaRNAi. Dashed outlines show brain regions. Scale bars: 20 µm.
Fig. 4.
Fig. 4.
Ama knockdown decreases RTK signaling. (A) Dot plot showing an increase in sty and a decrease in pnt as determined through scRNA-seq in repo>AmaRNAi relative to repo>+. The red color gradient represents the average expression of sty or pnt (average log fold change), whereas the size of the dot represents the percentage of cells expressing sty or pnt. (B) Sty immunofluorescence in surface glia shows an increase in Sty especially at the membrane in repo>AmaRNAi and a modest decrease in basal Sty in repo>Ama. White arrowheads point to Repo-positive glial cells, whereas white arrows point to SPG membranes. (C) Box plot displaying the Sty relative fluorescence units (RFU) measured in surface glia in each repo>+ (n=70 nuclei, across 5 brains), repo>AmaRNAi (n=84 nuclei, across 8 brains), and repo>Ama (n=162 nuclei, across 9 brains). The RFUs were normalized to the average Sty RFU value in 70 repo>+ nuclei. The line in the center of the box represents the median. The lower and upper box limits are the first and third quartiles, respectively. The Tukey whiskers extend to show the minimum and maximum values outside the first and third quartiles. ***P<0.001 (Student's t-test) to compare each genotype to repo>+ (Table S10). (D) P-ERK immunofluorescence in surface glia shows a decrease in P-ERK signal in repo>AmaRNAi and a modest increase in P-ERK in repo>Ama. White arrowheads point at glia nuclei. Final genotypes: repo>mCD8GFP (top panel), repo>mCD8GFP Ama (middle panel), repo>mCD8GFP AmaRNAi (bottom panel). (E) Box plot displaying the P-ERK RFU measured in surface glia in each repo>+ (n=171 nuclei, across 17 brains), repo>AmaRNAi (n=173 nuclei, across 15 brains), and repo>Ama (n=118 nuclei, across 15 brains). The RFUs were normalized to the average P-ERK RFU value in 171 repo>+ nuclei. The line in the center of the box represents the median. The lower and upper box limits are the first and third quartiles, respectively. The Tukey whiskers extend to show the minimum and maximum values outside the first and third quartiles. **P<0.01, ***P<0.001 (Student's t-test) to compare each genotype to repo>+ (Table S11). (F) Immunofluorescence images in SG using PntP1 antibodies reveals that there is a decrease in signal in repo>AmaRNAi and a modest increase in PntP1 in repo>Ama. White arrowheads point at Repo-positive glia nuclei. Final genotypes: repo>mCD8GFP (top panel), repo>mCD8GFP Ama (middle panel), repo>mCD8GFP AmaRNAi (bottom panel). (G) P-ERK immunofluorescence in a clone of cells using FLP-Out to overexpress Ama. GFP labels PG cells in the clone on the surface of the brain that over express Ama. White arrowheads point at cell autonomous increase of P-ERK. Yellow arrowheads point at cell non-autonomous increase of P-ERK. Scale bars: 20 µm.
Fig. 5.
Fig. 5.
Sty knockdown largely rescues the phenotype of Ama depletion. (A) Repo immunofluorescence of third-instar larval brains show a partial increase in size in repo>styRNAi AmaRNAi, and repo>rlsem AmaRNAi relative to that in repo>AmaRNAi. Dashed outlines show brain regions. (B) Quantification of Repo in brains in A reveal that sty knockdown or overexpressing activated ERK in Ama-depleted brains partially rescues the number of glia repo>AmaRNAi. Z-stacks from repo>+ (n=4), repo>AmaRNAi (n=4), repo>Ama (n=3), repo>AmaRNAi (n=4), repo>styRNAi AmaRNAi (n=4), repo>rlsem AmaRNAi (n=4) brains were counted and values normalized to the average count in repo>+ (set at 1). Data represents the mean±s.e.m. after normalization. **P<0.01; ***P<0.001; NS, not significant (Student's t-test) to compare each genotype to repo>+ (Table S12). (C) Repo immunofluorescence of eye discs indicates that overexpression of activated ERK in Ama-depleted brains partially rescues glial cell migration in repo>AmaRNAi eye discs. Scale bars: 20 µm.
Fig. 6.
Fig. 6.
Ama depletion suppresses neoplastic growth in the Drosophila glioma model. (A) P-ERK immunofluorescence in surface glia reveals that knockdown of Ama in the Drosophila glioma model causes a striking decrease in P-ERK. White arrowheads point at glial cells. (B) PntP1 immunofluorescence in surface glia indicates that there is a drastic decrease in PntP1 following Ama depletion in the Drosophila glioma model. White arrowheads point at Repo-positive glial cells. (C) Repo immunofluorescence in surface glia shows that Ama depletion in a Drosophila glioma model drastically decreases the brain size and number of glia. GFP labels glial cell membranes. Dashed outlines show brain regions. (D) Immunofluorescence reveals that there is an increase in Sty levels following Ama knockdown in the Drosophila glioma model in surface glia. White arrowheads point at Repo-positive glial cells. Scale bars: 20 µm. Final genotypes in A–D: repo>mCD8GFP (top panel), repo>dEGFRλ dp110CAAX mCD8GFP (middle panel), repo>dEGFRλ dp110CAAX mCD8GFP AmaRNAi (bottom panel).
Fig. 7.
Fig. 7.
The relationship between Ama and Sprouty is conserved in human glioblastoma cell lines. (A) Immunoblot showing LSAMP, SPRY2 and GAPDH levels in U251 cells stably expressing non-targeting shRNA (NT) or LSAMP shRNA (LSAMPsh). Knockdown of LSAMP increases SPRY2, with relative densitometry levels for each target labeled below. (B) Immunoblot showing LSAMP, SPRY2 and vinculin levels in T98G cells expressing a doxycycline-inducible shRNA. Cells were treated for 3 days with the corresponding amounts of doxycycline (ng/ml in 0.15% DMSO) before harvesting. Dose-dependent knockdown of LSAMP gradually increases SPRY2. Relative densitometry levels for each target are labeled below. Results in A and B are representative of three independent experiments. (C) Heatmap displaying mRNA expression z-score (RNA Seq V2 RSEM) of LSAMP and SPRY2 in each row in GBM human patients (TCGA PanCancer Atlas) showing a significant inverse correlation between those genes. Each column represents a tumor tissue sample. The q-value was generated from a two-sample t-test. (D) Kaplan–Meier plot revealing that GBM patients (TCGA PanCancer Atlas) with EGFR mutations have a significant decrease in survivability with high levels of LSAMP mRNA. The P-value was generated from a logrank test. (E) Kaplan–Meier plot of GBM patients with EGFR amplifications reveals that patients with high LSAMP mRNA have a significant decrease in survivability. The P-value was generated using a logrank test.
Fig. 8.
Fig. 8.
Ama affects RTK signaling. Illustration of the molecular mechanism of Ama acting through Sty to inhibit RTK signaling.

References

    1. Akeel M., McNamee C. J., Youssef S. and Moss D. (2011). DIgLONs inhibit initiation of neurite outgrowth from forebrain neurons via an IgLON-containing receptor complex. Brain Res. 1374, 27-35. 10.1016/j.brainres.2010.12.028 - DOI - PubMed
    1. Ariss M. M., Islam A. B. M. M. K., Critcher M., Zappia M. P. and Frolov M. V. (2018). Single cell RNA-sequencing identifies a metabolic aspect of apoptosis in Rbf mutant. Nat. Commun. 9, 1-13. 10.1038/s41467-018-07540-z - DOI - PMC - PubMed
    1. Avet-Rochex A., Kaul A. K., Gatt A. P., McNeill H. and Bateman J. M. (2012). Concerted control of gliogenesis by InR/TOR and FGF signalling in the Drosophila post-embryonic brain. Development 139, 2763-2772. 10.1242/dev.074179 - DOI - PMC - PubMed
    1. Babatz F., Naffin E. and Klämbt C. (2018). The Drosophila blood-brain barrier adapts to cell growth by unfolding of pre-existing septate junctions. Dev. Cell 47, 697-710.e3. 10.1016/j.devcel.2018.10.002 - DOI - PubMed
    1. Bainton R. J., Tsai L. T.-Y., Schwabe T., DeSalvo M., Gaul U. and Heberlein U. (2005). moody encodes two GPCRs that regulate cocaine behaviors and blood-brain barrier permeability in Drosophila. Cell 123, 145-156. 10.1016/j.cell.2005.07.029 - DOI - PubMed

Publication types

MeSH terms

LinkOut - more resources