. 2020 Oct;30(10):1458-1467.
doi: 10.1101/gr.262204.120. Epub 2020 Sep 2.

Pooled analysis of radiation hybrids identifies loci for growth and drug action in mammalian cells

Affiliations

Pooled analysis of radiation hybrids identifies loci for growth and drug action in mammalian cells

Arshad H Khan et al. Genome Res. 2020 Oct.

Abstract

Genetic screens in mammalian cells commonly focus on loss-of-function approaches. To evaluate the phenotypic consequences of extra gene copies, we used bulk segregant analysis (BSA) of radiation hybrid (RH) cells. We constructed six pools of RH cells, each consisting of ∼2500 independent clones, and placed the pools under selection in media with or without paclitaxel. Low pass sequencing identified 859 growth loci, 38 paclitaxel loci, 62 interaction loci, and three loci for mitochondrial abundance at genome-wide significance. Resolution was measured as ∼30 kb, close to single-gene. Divergent properties were displayed by the RH-BSA growth genes compared to those from loss-of-function screens, refuting the balance hypothesis. In addition, enhanced retention of human centromeres in the RH pools suggests a new approach to functional dissection of these chromosomal elements. Pooled analysis of RH cells showed high power and resolution and should be a useful addition to the mammalian genetic toolkit.


Figures

Figure 1.
Figure 1.
Creating the RH pools.
Figure 2.
Figure 2.
Genome copy number in the RH pools. (A) Hamster copy number deduced from reads in the A23 cells, normalized to a mean value of 1. (B) Hamster copy number averaged across the six RH pools. (C) Human copy number in the HEK293 cells. (D) Human DNA copy number (retention) averaged across the six RH pools. TK1 assigned retention of 1. (E) Increased retention of human centromere on Chromosome 2. (F) Increased retention of human centromere and TK1 on Chromosome 17.
Figure 3.
Figure 3.
Copy number changes at week 4. (A) Hamster genome, growth at week 4 compared to week 0; 0 nM paclitaxel. (B) Human genome, growth at week 4 compared to week 0; 0 nM paclitaxel. (C) Hamster genome, 75 nM paclitaxel compared to 0 nM paclitaxel; week 4. (D) Human genome, 75 nM paclitaxel compared to 0 nM paclitaxel; week 4. Changes on log2 scale averaged across the six RH pools.
Figure 4.
Figure 4.
Loci for average conditional effects of growth and paclitaxel. (A) Significance values for growth. (B) Significance values for paclitaxel. Red dotted line, permutation significance threshold.
Figure 5.
Figure 5.
Close up views of growth loci. (A) Chromosome 1. (B) Chromosome 3. (C) Chromosome 16. (D) Sequence read changes on log2 scale for six significant growth loci. Colored lines, best fit. Gray bands, 95% confidence intervals. (E) Locus for CTTNBP2 on Chromosome 7. (F) Locus for MCTP2 on Chromosome 15. Horizontal red and black lines, permutation significance thresholds.
Figure 6.
Figure 6.
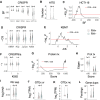
RH growth genes. (A) RH growth genes (RH+) have weaker CRISPR effects (Hart et al. 2015) than nongrowth RH genes (RH−). (BF) Bayes factor for growth effects in each cell line, P-values shown above comparisons. (B) Mean number of cell lines with a CRISPR hit is lower for RH growth genes. (C) Lack of overlap between RH and CRISPR growth genes in HCT116 cells. Abscissa shows threshold BF used to calculate overlap. (D) CRISPR scores (CS) for growth effects (Wang et al. 2015) multiplied by −1, so that higher scores mean stronger effects. (E) Lack of overlap between RH and CRISPR growth genes in KBM7 cells. (F) RH growth genes show weaker CRISPRi, but not CRISPRa, effects (−γ) in K562 cells (Gilbert et al. 2014). (G) RH growth genes have increased numbers of low-confidence protein–protein interactions and decreased numbers of high-confidence interactions. Score threshold (abscissa) is a measure of confidence. (H) Number of protein–protein interactions at most significant low-confidence score threshold (160) and most significant high-confidence threshold (995). (I) RH coding region growth genes have decreased expression compared to nongrowth genes in microarray data from a human RH panel. (J) Coding region (cr) RH growth genes have decreased expression compared to cr nongrowth genes in GTEx RNA-seq data from substantia nigra. (K) Noncoding (nc) RH growth and nongrowth genes show no significant expression differences in substantia nigra. (L) Decreased number of human paralogs (duplicates) for RH growth genes. P-values, Welch's two-sample t-test except in C and E, Fisher's exact test. (FDR) False discovery rate (Benjamini and Hochberg 1995). Transcripts per million (TPM) thresholded at ≥5.

References

    1. Ahn S, Wang RT, Park CC, Lin A, Leahy RM, Lange K, Smith DJ. 2009. Directed mammalian gene regulatory networks using expression and comparative genomic hybridization microarray data from radiation hybrids. PLoS Comput Biol 5: e1000407 10.1371/journal.pcbi.1000407 - DOI - PMC - PubMed
    1. Alagia A, Eritja R. 2016. siRNA and RNAi optimization. Wiley Interdiscip Rev RNA 7: 316–329. 10.1002/wrna.1337 - DOI - PubMed
    1. Aldrup-MacDonald ME, Kuo ME, Sullivan LL, Chew K, Sullivan BA. 2016. Genomic variation within α satellite DNA influences centromere location on human chromosomes with metastable epialleles. Genome Res 26: 1301–1311. 10.1101/gr.206706.116 - DOI - PMC - PubMed
    1. Aoki J, Kai W, Kawabata Y, Ozaki A, Yoshida K, Tsuzaki T, Fuji K, Koyama T, Sakamoto T, Araki K. 2014. Construction of a radiation hybrid panel and the first yellowtail (Seriola quinqueradiata) radiation hybrid map using a nanofluidic dynamic array. BMC Genomics 15: 165 10.1186/1471-2164-15-165 - DOI - PMC - PubMed
    1. Arnoldo A, Kittanakom S, Heisler LE, Mak AB, Shukalyuk AI, Torti D, Moffat J, Giaever G, Nislow C. 2014. A genome scale overexpression screen to reveal drug activity in human cells. Genome Med 6: 32 10.1186/gm549 - DOI - PMC - PubMed

Publication types