. 2020 Oct;30(10):1434-1448.
doi: 10.1101/gr.266221.120. Epub 2020 Sep 2.

Mapping genome variation of SARS-CoV-2 worldwide highlights the impact of COVID-19 super-spreaders

Affiliations

Mapping genome variation of SARS-CoV-2 worldwide highlights the impact of COVID-19 super-spreaders

Alberto Gómez-Carballa et al. Genome Res. 2020 Oct.

Abstract

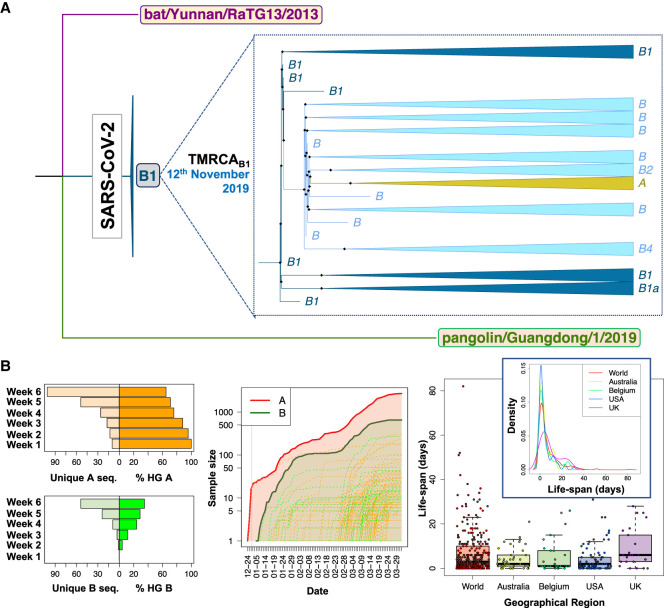
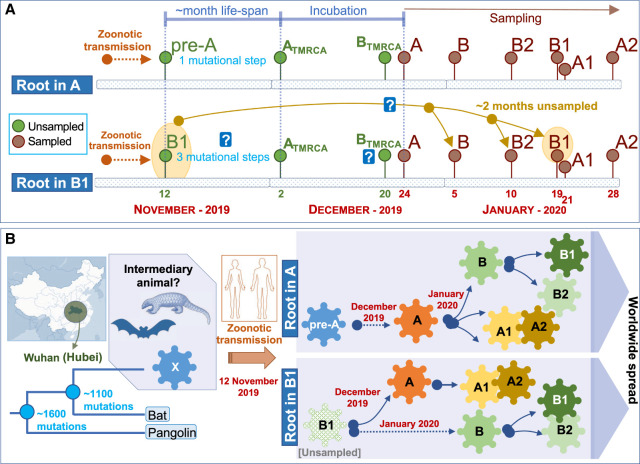
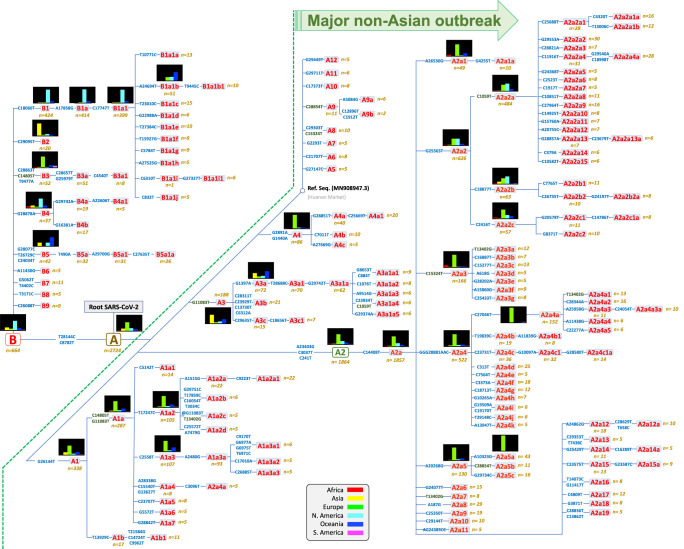
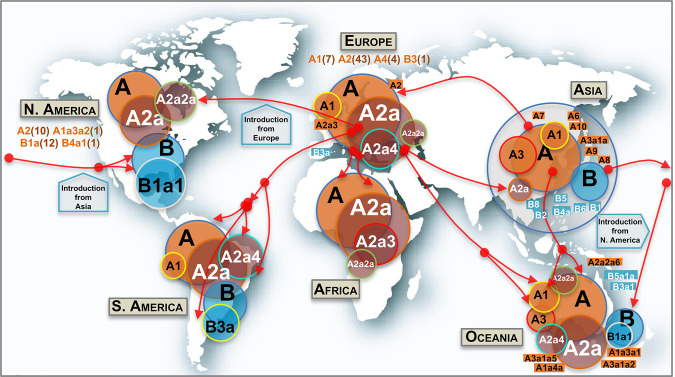
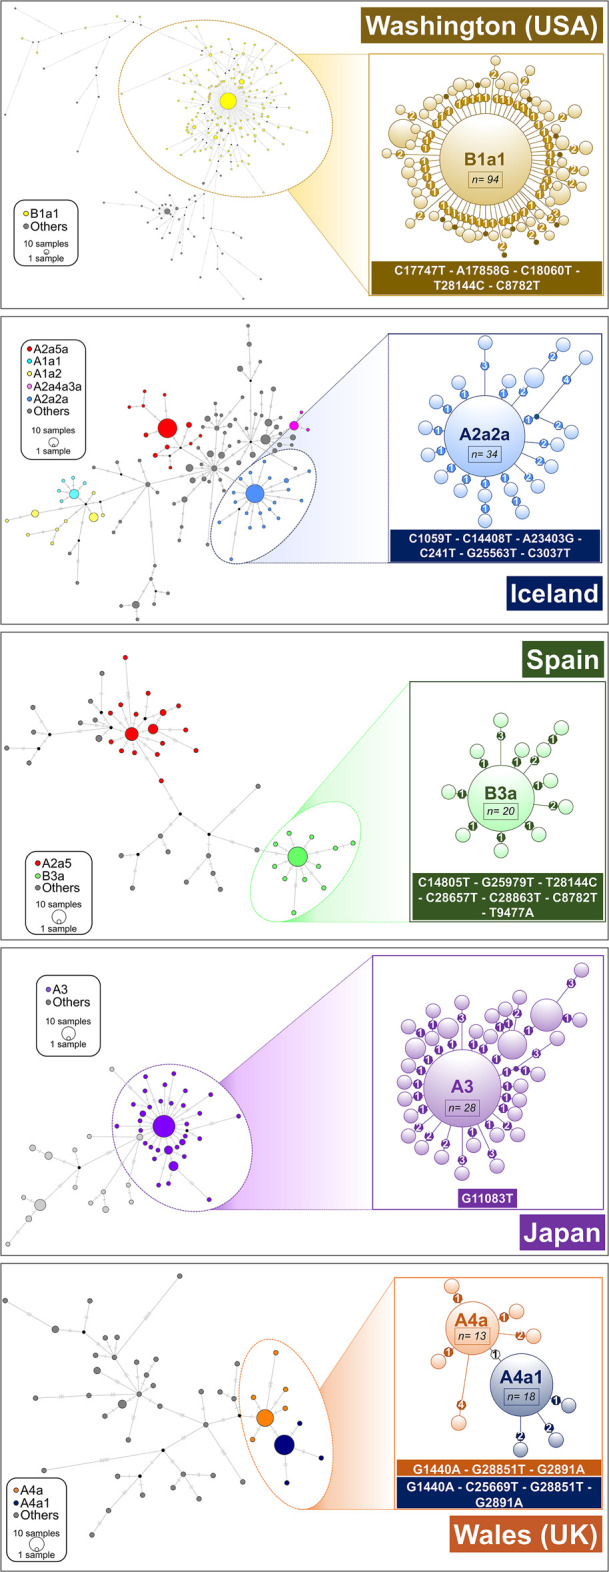
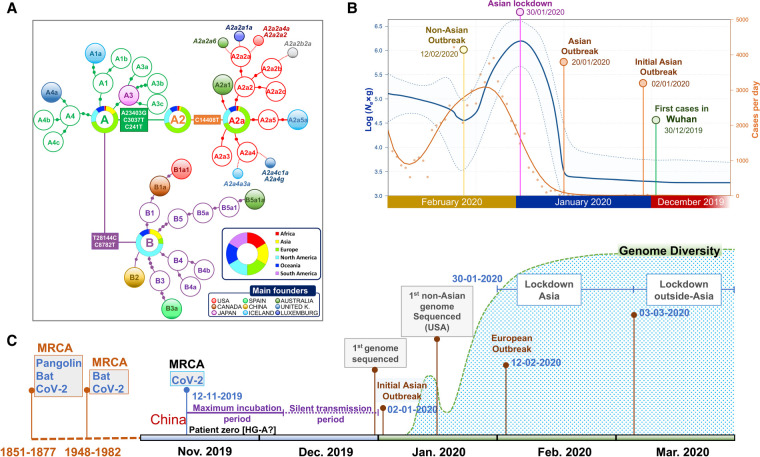
The human pathogen severe acute respiratory syndrome coronavirus 2 (SARS-CoV-2) is responsible for the major pandemic of the twenty-first century. We analyzed more than 4700 SARS-CoV-2 genomes and associated metadata retrieved from public repositories. SARS-CoV-2 sequences have a high sequence identity (>99.9%), which drops to >96% when compared to bat coronavirus genome. We built a mutation-annotated reference SARS-CoV-2 phylogeny with two main macro-haplogroups, A and B, both of Asian origin, and more than 160 sub-branches representing virus strains of variable geographical origins worldwide, revealing a rather uniform mutation occurrence along branches that could have implications for diagnostics and the design of future vaccines. Identification of the root of SARS-CoV-2 genomes is not without problems, owing to conflicting interpretations derived from either using the bat coronavirus genomes as an outgroup or relying on the sampling chronology of the SARS-CoV-2 genomes and TMRCA estimates; however, the overall scenario favors haplogroup A as the ancestral node. Phylogenetic analysis indicates a TMRCA for SARS-CoV-2 genomes dating to November 12, 2019, thus matching epidemiological records. Sub-haplogroup A2 most likely originated in Europe from an Asian ancestor and gave rise to subclade A2a, which represents the major non-Asian outbreak, especially in Africa and Europe. Multiple founder effect episodes, most likely associated with super-spreader hosts, might explain COVID-19 pandemic to a large extent.


Figures

Figure 1.
Figure 1.
Contrasting evidence supporting different roots for SARS-CoV-2 genomes. (A) Interspecific ML tree using genomes sampled in GISAID before March 2020, indicating the root in haplogroup B1 for all existing SARS-CoV-2 genomes. (B, left) The histograms on the right represent the number of unique haplotypes belonging to haplogroups A and B accumulated during the first 6 wk of the pandemic, whereas the histograms on the left show the evolution of the frequencies of haplogroups A and B in the same period (note that A and B frequencies are complementary); (middle) growth of sample size of the main A branch (red solid line) and A sub-branches (red dashed lines) and the main B branch (green solid line) and B sub-branches (green dashed lines), indicating that B and derivative clades appear at a later moment of the pandemic than A and its subclades. The gray vertical line separates year 2019 from year 2020; (right) boxplot and density function of the life-span period of identical haplotypes in the database (as a proxy for the life-span period of a SARS-CoV-2 genome) worldwide and in various countries (by way of example, we only included those data sets having high sample sizes).
Figure 2.
Figure 2.
Scheme explaining two alternative models for the location of the root of the SARS-CoV-2 genomes according to their chronologies. (A) Locating the root in haplogroup A would be consistent with a logical evolutionary time line that accounts for the number of mutations accumulated from an alleged pre-A ancestor originating from a zoonotic transmission between an intermediary animal and humans (occurring ∼November 12, 2019) and also consistent with TMRCA values estimated for Chinese A, B, B1, and B2 haplotypes (see text). The alternative of considering B1 as the root would enter into conflict (represented by a question mark) with mutation rates of SARS-CoV-2 genomes, coupled with the large unsampled period needed to explain the hypothetical first appearance of B1 on approximately November 12, 2019 and its first sampling on January 19, 2020, as well as TMRCA for haplogroups A, B, B1, and B2 (see text). (B) The scheme summarizes the two alternative evolutionary scenarios assuming roots in haplogroup A or B1, according to the time lines outlined in the upper panel.
Figure 3.
Figure 3.
Maximum parsimony tree of SARS-CoV-2 genomes. Small histograms represent relative frequencies of the given haplogroup or sub-haplogroup in the different regions. Mutations along branches are referred to changes against the reference sequence. Mutations in dark green indicate parallel events along the different branches of the phylogeny. Mutations with an @ symbol indicate reversions.
Figure 4.
Figure 4.
Map showing the worldwide spread of the main SARS-CoV-2 clades. Circle areas are proportional to frequencies (e.g., A2a is contained within A, and so on), and the arrows indicate just an approximate reconstruction of the phylodynamics of SARS-CoV-2 from the beginning of the Asian outbreak to the non-Asian spread of the pathogen based on the phylogeny, genome chronology (as recorded in the metadata that indicates the sampling origin and dates), and genome variation. Classification of genomes into haplogroups is according to the phylogeny shown in Figure 3. Minor subclades are indicated in rectangular shapes with their corresponding labels. In addition, other minor haplogroups involved in the SARS-CoV-2 spread (in brackets are the number of subclades involved) are indicated below continental labels.
Figure 5.
Figure 5.
Network analysis of main super-spreader candidates (see also Supplemental Data; Supplemental Table S4) in various geographic regions. A network was first computed for all the haplotypes in the region, and a zoomed network was built for the main super-spreader candidates. Areas of the circles are proportional to the number of haplotypes. In the case of B1a1 representation (Washington state; USA), only derived haplotypes from the core with one or two mutations are represented in the left subgraph. Heptagons in branches indicate the number of mutations in the corresponding branch.
Figure 6.
Figure 6.
Phylogenetic and phylodynamics of SARS-CoV-2, and timeline of the pandemic. (A) Simplified SARS-CoV-2 phylogeny (schematic version of Fig. 3) illustrating the main worldwide branches and the haplogroups responsible for the main outbreaks (founders favored by super-spreading) occurring in Asia and outside Asia (colored filled circles). The overall distribution color keys refer only to pie charts, and the main founder color keys refer only to filled circles. (B) EBSP based on genomes sampled from the beginning of the pandemic until the end of February 2020 (n = 621). The orange distribution shows the real number of cases per day as recorded in https://ourworldindata.org for the same time period (we disregarded the abnormal peak occurring on February 13, 2020, because more than 15,000 new cases were reported in China in just 1 d, most likely representing unconfirmed cases). (C) Time line of the main events occurring during the pandemic, and indicating the MRCA of all SARS-CoV-2 genomes; the dotted area is a schematic representation of the real diversity values reported in Supplemental Figure S10 and Supplemental Table S3. Divergence dates between SARS-CoV-2 and bat sarbecoronavirus reservoir and between bat and pangolin coronaviruses were taken from Boni et al. (2020).

References

    1. Andersen KG, Rambaut A, Lipkin WI, Holmes EC, Garry RF. 2020. The proximal origin of SARS-CoV-2. Nat Med 26: 450–452. 10.1038/s41591-020-0820-9 - DOI - PMC - PubMed
    1. Artesi M, Bontems S, Gobbels P, Franckh M, Maes P, Boreux R, Meex C, Melin P, Hayette MP, Bours V, et al. 2020. A recurrent mutation at position 26,340 of SARS-CoV-2 is associated with failure of the E-gene qRT-PCR utilized in a commercial dual-target diagnostic assay. J Clin Microbiol doi.org/10.1128/JCM.01598-20 - DOI - PMC - PubMed
    1. Bandelt HJ, Salas A. 2012. Current next generation sequencing technology may not meet forensic standards. Forensic Sci Int Genet 6: 143–145. 10.1016/j.fsigen.2011.04.004 - DOI - PubMed
    1. Boni MF, Lemey P, Jiang X, Lam TT, Perry BW, Castoe TA, Rambaut A, Robertson DL. 2020. Evolutionary origins of the SARS-CoV-2 sarbecovirus lineage responsible for the COVID-19 pandemic. Nat Microbiol doi.org/10.1038/s41564-020-0771-4 - DOI - PubMed
    1. Ceraolo C, Giorgi FM. 2020. Genomic variance of the 2019-nCoV coronavirus. J Med Virol 92: 522–528. 10.1002/jmv.25700 - DOI - PMC - PubMed

Publication types

LinkOut - more resources