. 2020 Sep 2;12(559):eaaz1863.
doi: 10.1126/scitranslmed.aaz1863.

Effective combination immunotherapy using oncolytic viruses to deliver CAR targets to solid tumors

Affiliations

Effective combination immunotherapy using oncolytic viruses to deliver CAR targets to solid tumors

Anthony K Park et al. Sci Transl Med. .

Abstract

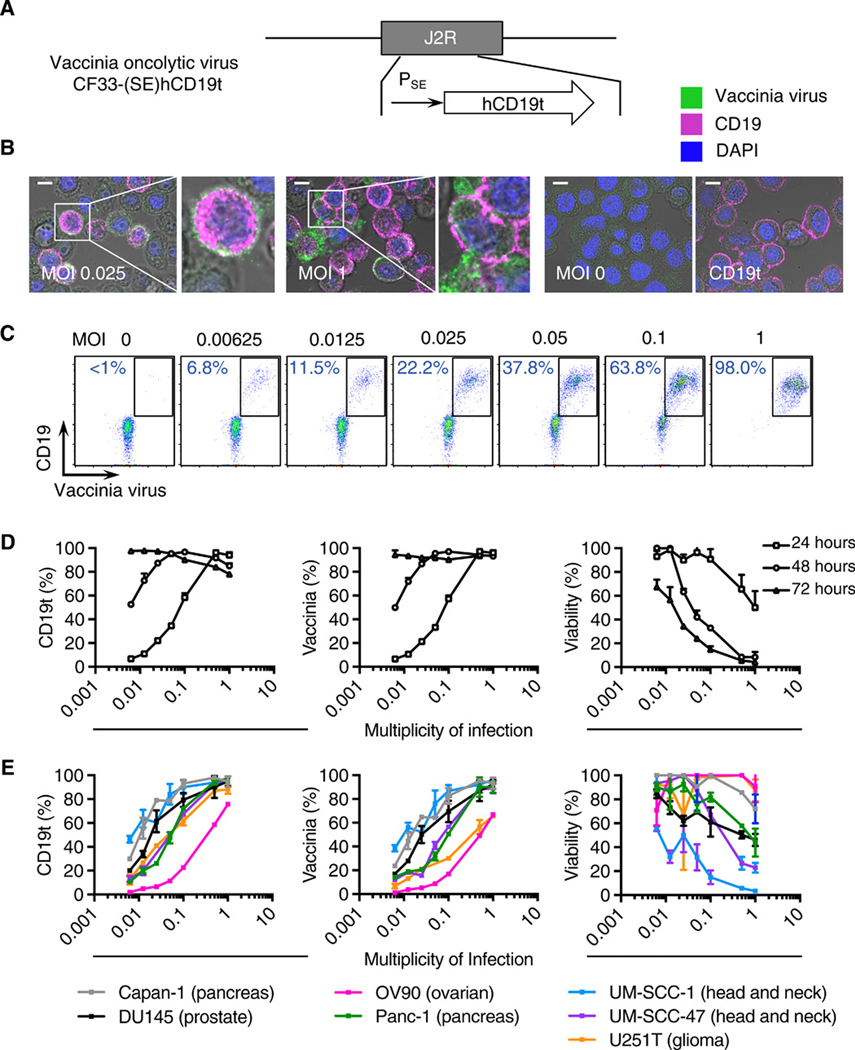
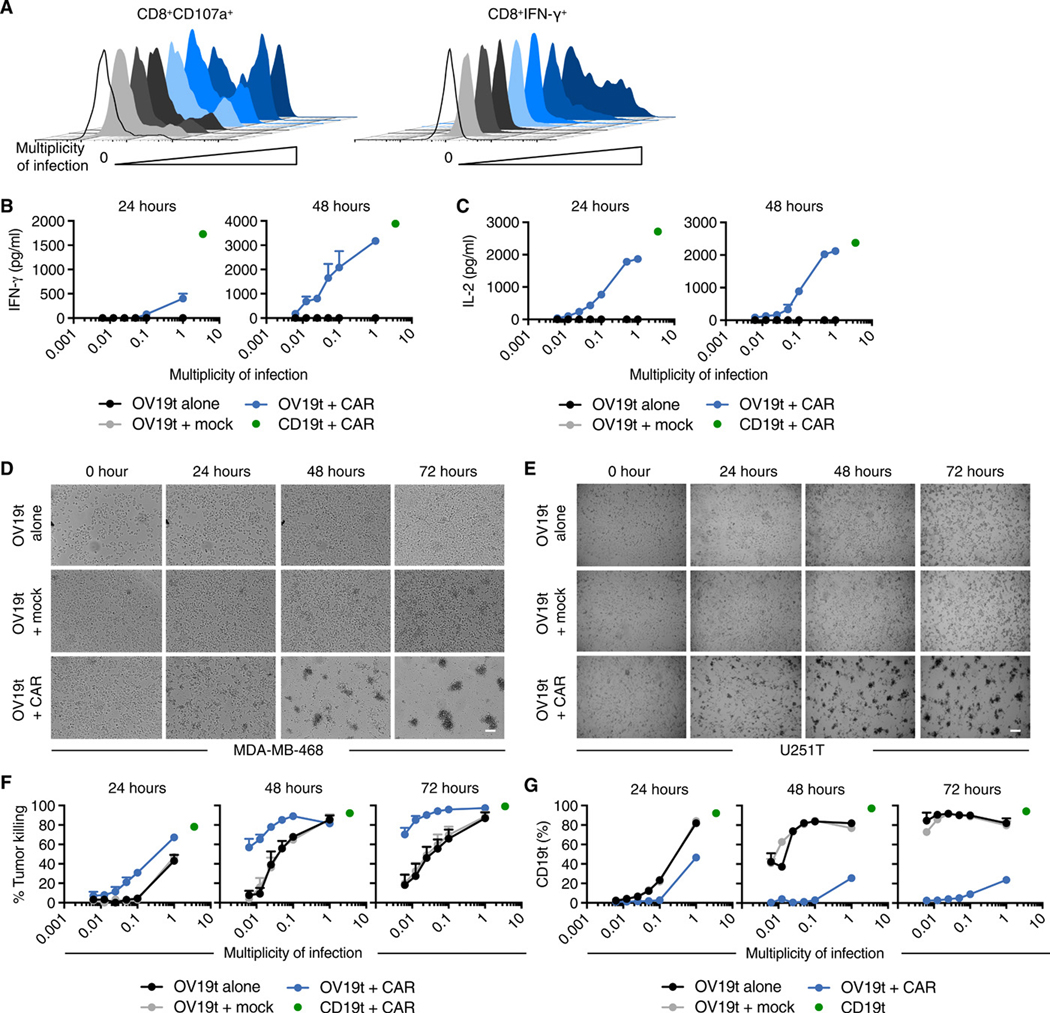
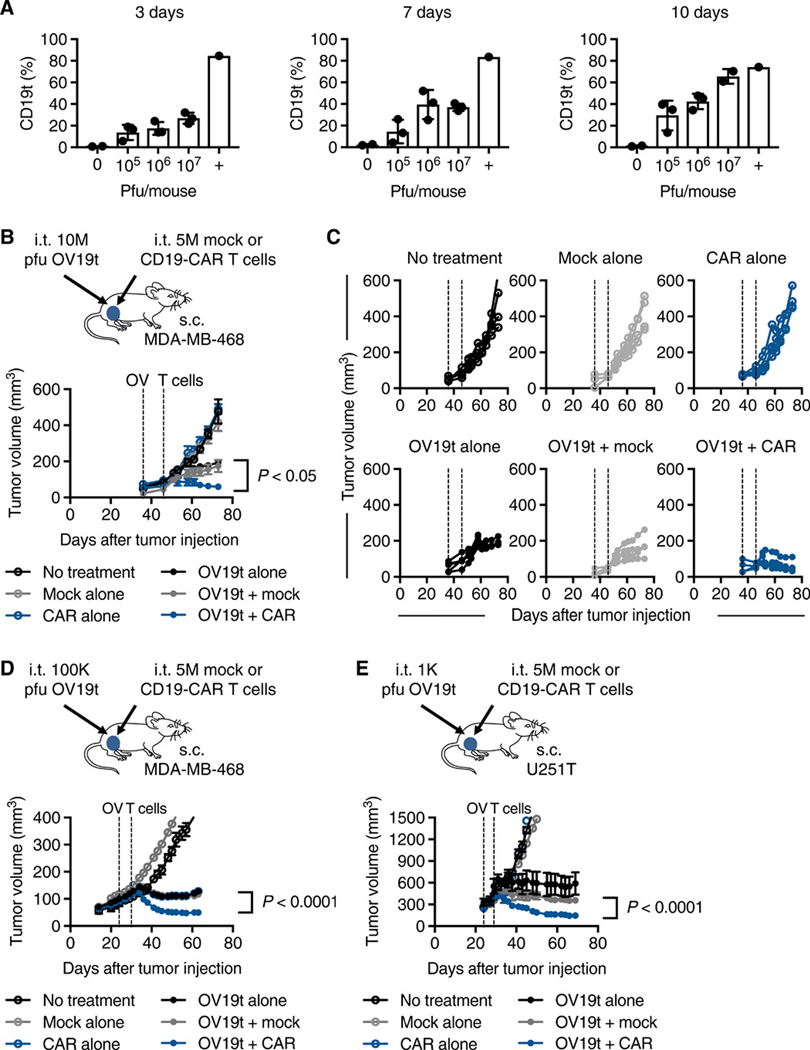
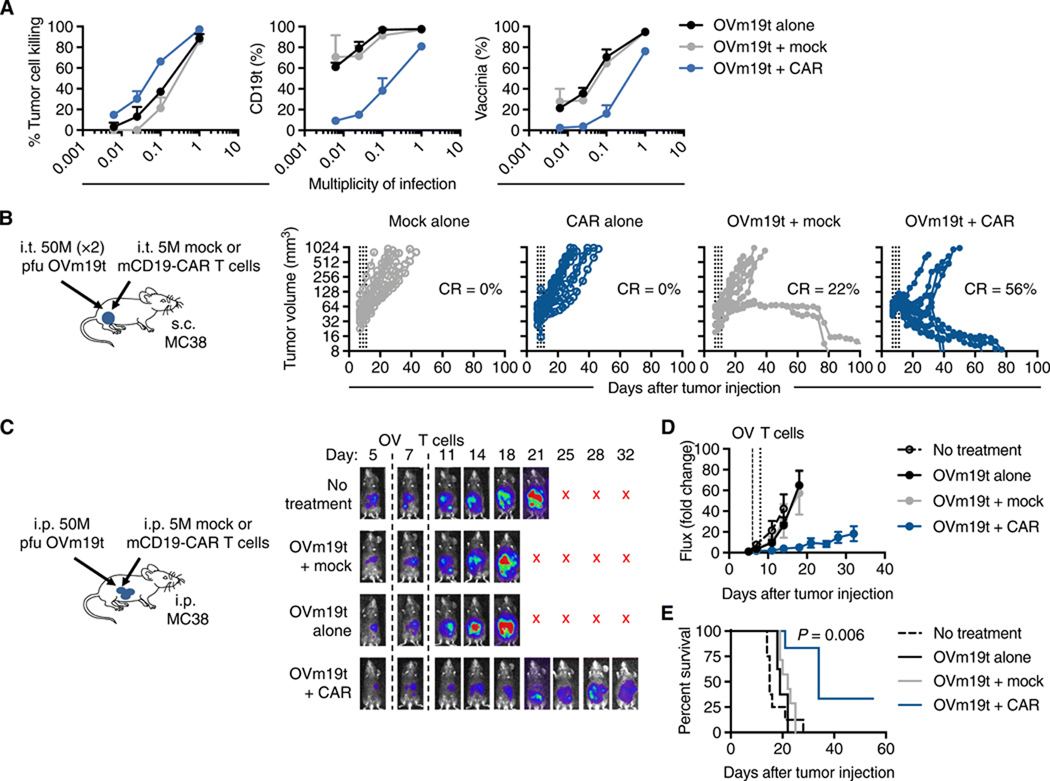
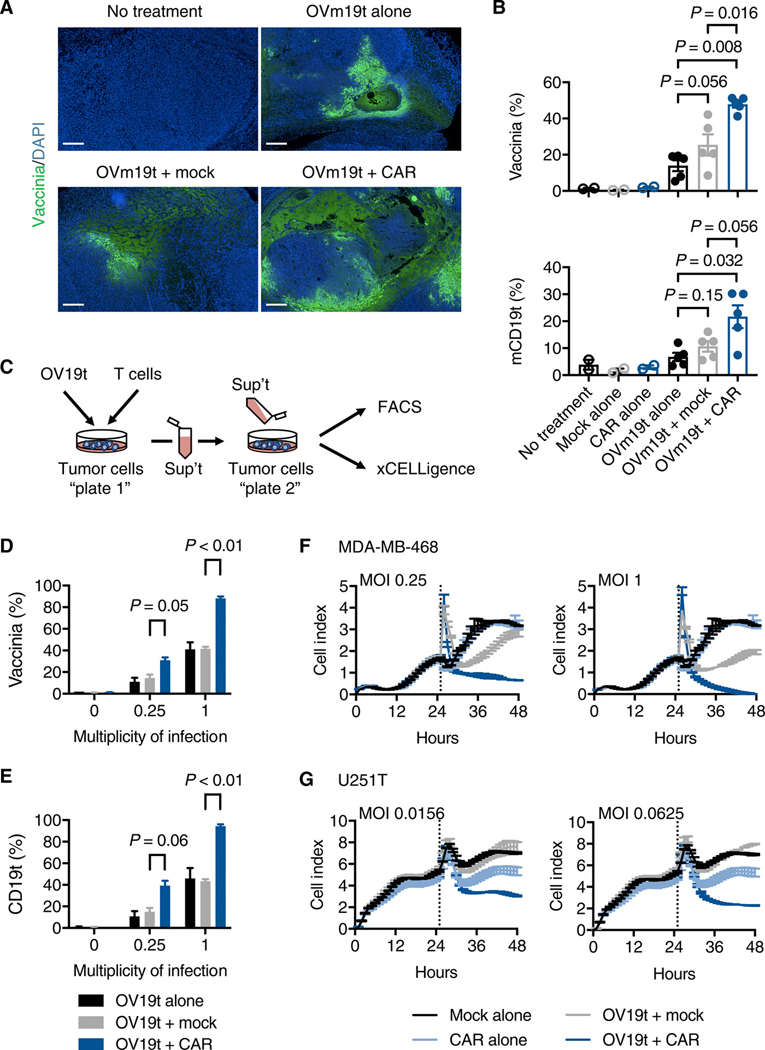
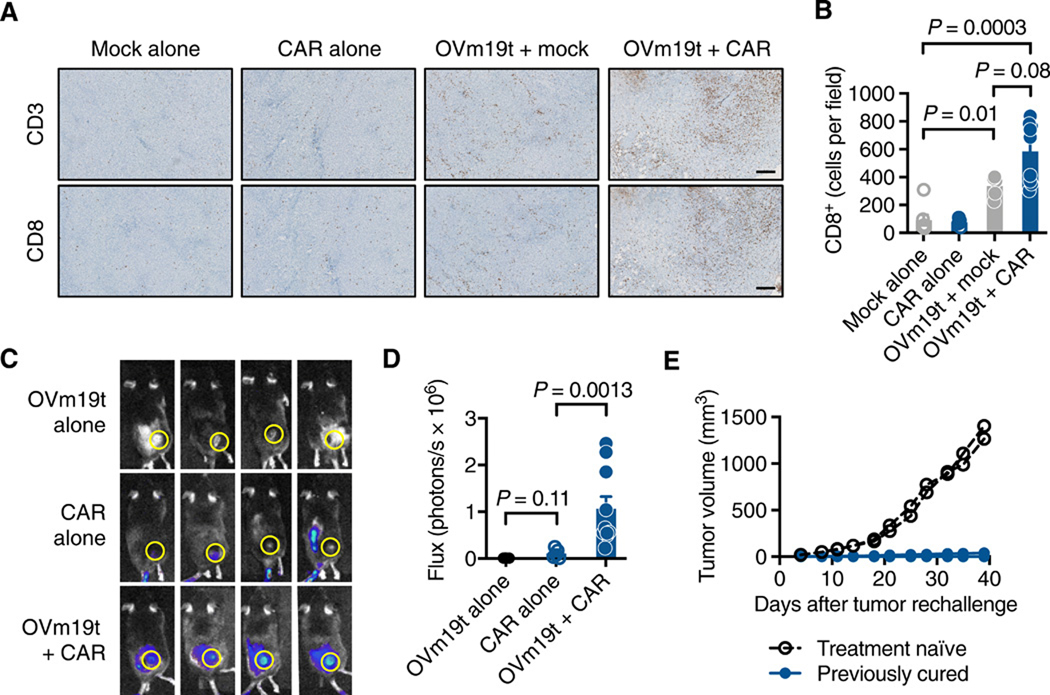
Chimeric antigen receptor (CAR)-engineered T cell therapy for solid tumors is limited by the lack of both tumor-restricted and homogeneously expressed tumor antigens. Therefore, we engineered an oncolytic virus to express a nonsignaling, truncated CD19 (CD19t) protein for tumor-selective delivery, enabling targeting by CD19-CAR T cells. Infecting tumor cells with an oncolytic vaccinia virus coding for CD19t (OV19t) produced de novo CD19 at the cell surface before virus-mediated tumor lysis. Cocultured CD19-CAR T cells secreted cytokines and exhibited potent cytolytic activity against infected tumors. Using several mouse tumor models, delivery of OV19t promoted tumor control after CD19-CAR T cell administration. OV19t induced local immunity characterized by tumor infiltration of endogenous and adoptively transferred T cells. CAR T cell-mediated tumor killing also induced release of virus from dying tumor cells, which propagated tumor expression of CD19t. Our study features a combination immunotherapy approach using oncolytic viruses to promote de novo CAR T cell targeting of solid tumors.


Figures

Fig. 1.
Fig. 1.. OV effectively deliver CD19t to solid tumors in vitro.
(A) Schematic of vaccinia OV [CF33-(SE)hCD19t], showing incorporation of human truncated CD19 (CD19t) under the control of the synthetic early promoter (PSE) inserted into the J2R locus and replacing the thymidine kinase gene. (B) Immunofluorescence microscopy of MDA-MB-468 cells infected for 24 h with OV19t at multiplicity of infection (MOI) 0.025 or MOI 1, untransduced (MOI 0), or cells transduced with lentivirus to stably express CD19t. Scale bars, 10 μm. Blue is DAPI, pink indicates CD19t, and green indicates vaccinia. (C) FACS plots of MDA-MB-468 tumor cells positive for CD19t and vaccinia virus after 24 h of OV19t infection at increasing MOIs. Percents indicate CD19t-positive, virus-positive population in the boxed region. (D) Quantification of percent CD19t positive (left), vaccinia positive (middle), and viable (right) MDA-MB-468 tumor cells following 24, 48, and 72 h exposure to the indicated MOIs of OV19t. (E) Quantification of CD19t positive (left), vaccinia positive (middle), and viable (right) cells of indicated solid tumor cell lines following 24, 48, and 72 h exposure to the indicated MOIs of OV19t. Data in B and C are from one of at least two independent experiments. Data in D and E are presented as mean + SD (D) or mean ± SD (E) (n ≥ 2) from one of at least three independent experiments.
Fig. 2.
Fig. 2.. OV19t introduces CD19t on tumor cells, which directs activation and cytotoxicity of CD19-CAR T cells in vitro.
(A) Representative flow cytometric analysis showing abundance of cell surface CD107a on and intracellular IFNγ in CD8+CAR+ T cells following 16-h coculture with MDA-MB-468 tumor cells in the presence or absence of the indicated MOI of OV19t. Ratio of effector CD19-CAR T cell to tumor cell was 1:1. Data are from one of two independent experiments. (B) IFNγ and (C) IL-2 production measured by ELISA in supernatants collected from cocultures in the presence or absence of OV19t at indicated MOIs for 24 and 48 h. Values for MDA-MB-468 cells stably expressing CD19t cocultured with CD19-CAR T cells (CD19t + CAR, green dot) are indicated by a single data point on each graph. Data presented are from technical duplicates and shown as mean + SD. (D, E) Tumor killing assay of MDA-MB-468 (D) and U251T (E) cells visualized by phase-contrast microscopy. Representative images are shown. Scale bars, 200 μm. (F) Quantification of MDA-MB-468 cell killing assessed by flow cytometry. MDA-MB-468 tumor cells were cocultured with untransduced T cells (Mock) or CD19-CAR T cells for 24, 48, or 72 h in the presence of the indicated MOIs of OV19t. Values for MDA-MB-468 cells stably expressing CD19t cocultured with CD19-CAR T cells (CD19t +CAR, green dot) are indicated by a single data point on each graph. Data presented are from duplicate wells from two experiments and shown as mean + SEM. (G) Percent of MDA-MB-468 cells positive for CD19t in killing assay described in F. Values for MDA-MB-468 cells stably expressing CD19t cultured without CD19-CAR T cells (CD19t, green dot) are indicated by a single data point on each graph. Data presented are from duplicate wells and shown as mean + SEM.
Fig. 3.
Fig. 3.. Anti-tumor efficacy of combination therapy of OV19t and CD19-CAR T cells in human xenograft tumor models.
(A) Percent of CD19t-positive tumors cells. Mice were engrafted with subcutaneous MDA-MB-468 tumors (5 × 10⁶ cells) and at day 24, mice were intratumorally injected with 0 (n = 2), 105, 106, or 107 (n = 3) plaque-forming units (pfu) of OV19t per mouse, which were harvested at day 3, 7, or 10 after treatment with OV19t. Percent cells positive for CD19t was quantified by flow cytometry. The positive control (+) represents MDA-MB-468 tumors stably expressing CD19t through lentiviral-mediated transduction prior to engraftment. (B) Top: Schematic of MDA-MB-468 tumor-bearing mice treated with OV19t and CD19-CAR T cells. NSG mice were injected subcutaneously with MDA-MB-468 (5 × 10⁶ cells) on day 0, and tumors were injected with OV19t (107 pfu, 10M) on day 36. On day 46, tumors were injected with either untransduced T cells (Mock) or CD19-CAR T cells (CAR, 5 × 10⁶ cells). Bottom: Tumor volumes are shown as mean ± SEM (n ≥ 4 per group). (C) Tumor volumes for each mouse in each treatment group are shown for mice described in B. Dashed lines indicate OV and T cell injections. All data above are representative of two independent experiments. (D) Top: Schematic of MDA-MB-468 tumor-bearing mice treated with OV19t and CD19-CAR T cells. Experimental paradigm is the same as in B except tumor-bearing mice received intratumoral injections of OV19t (105 pfu, 100K) on day 24 and of either Mock T cells or CD19-CAR T cells (5 × 10⁶ cells) on day 32. Bottom: Tumor volumes are shown as mean ± SEM (n ≥ 4 per group). (E) Top: Schematic of U251T tumor-bearing mice treated with OV19t and CD19-CAR T cells (top). NSG mice were injected subcutaneously with U251T (5 × 10⁶ cells) tumors on day 0, and tumors were injected with OV19t (103 pfu, 1K) on day 24. On day 29, tumors were injected with either Mock or CD19-CAR T cells (5 × 10⁶ cells). Bottom: Tumor volumes are shown as mean ± SEM (n ≥ 3 per group). P values indicate differences between OV19t + Mock and OV19t + CAR and were determined by unpaired Student’s t test. s.c., subcutaneous; i. t., intratumoral.
Fig. 4.
Fig. 4.. Anti-tumor efficacy of combination therapy of OVm19t and mCD19-CAR T cells in an immunocompetent murine syngeneic tumor model.
(A) Tumor killing of MC38 tumor cells treated with the indicated MOIs of OVm19t and cocultured with mCD19-CAR T cells or untransduced T cells (Mock) for 24 h. Left: Tumor cell killing was assessed by flow cytometry. Middle: Quantification of percent tumor cells positive for CD19t. Right: Quantification of percent cells positive for vaccinia. (B) Left: Schematic of C57BL/6j mice with subcutaneous MC38 tumors treated with OVm19t and mCD19-CAR T cells. Mice were subcutaneously (s.c.) injected with MC38 cells (5 × 10⁵ cells) on day 0. On days 7 and 9, mice were intratumorally treated (i. t.) with 0 or two doses of 5 × 10⁷ pfu OVm19t per mouse. On day 11, mice were treated by intratumoral injection with either Mock or mCD19-CAR T cells (5 × 10⁶ cells). Tumor volume was measured with calipers. Data for each mouse (n = 9 per group) is shown. Data are from one of two independent experiments. Percent of mice with complete response (curative response) is indicated. (C) Left: Schematic of C57BL/6j mice with intraperitoneal MC38 tumors treated with OVm19t and mCD19-CAR T cells. Mice were injected intraperitoneally (i.p.) MC38 cells expressing firefly luciferase (5 × 10⁵ cells) on day 0. At day 6, mice were i.p. sham injected or were injected with 107 pfu OVm19t per mouse. On day 8, mice were i.p. injected with either Mock T cells or mCD19-CAR murine T cells (5 × 10⁶ cells). n ≥ 6 per group. Right: Tumor growth was measured by non-invasive optical imaging. X indicates mice were euthanized or had died. (D) Average tumor sizes (based on non-invasive imaging) are shown as mean ± SEM. (E) Kaplan-Meier survival curves from the experiment described in C. P value indicates difference between Ovm19t + Mock and OVm19t + CAR as determined by log-rank (Mantel-Cox) test.
Fig. 5.
Fig. 5.. CD19-CAR T cell-mediated tumor killing promotes the viral particle release and infection of tumor cells.
(A) Histology showing vaccinia virus in MC38 tumors harvested from mice with no treatment or treatment with OVm19t alone, OVm19t + Mock T cells, and OVm19t + mCD19-CAR T cells. T cell treatment was 2 days after OVm19t injection. Tumors were harvested and stained for vaccinia virus (green) 4 days after OVm19t alone or 2 days after T cell treatments. Scale bars, 500 μm. (B) Quantification of percent cells positive for vaccinia and mCD19t in subcutaneous tumors from mice receiving the indicated treatments. Mice were injected subcutaneously MC38 tumors (5 × 10⁵ cells) on day 0. On days 14 and 16 mice were intratumorally injected with OVm19t (5 × 10⁷) pfu per mouse. On day 18 mice were treated intravenously with Mock T cells or mCD19-CAR T cells. Tumors were harvested 5 days after OVm19t or 3 days after T cell treatments. Cells were analyzed by flow cytometry. n = 2 – 5 per group. Statistical analysis using unpaired Student’s t-test. (C) Schematic of experiment assessing viral release from MDA-MB-468 or U251T cells exposed to OV19t and Mock T cells or CD19-CAR T cells. In Plate 1, OV19t at varying MOIs were added to tumor cells for an initial 3 h incubation. Virus was washed off, and cells were incubated for an additional 4 h prior to adding Mock T cells or CD19-CAR T cells for 18 h. Supernatants were collected and added to freshly plated tumor cells (Plate 2) and incubated for 18 h. (D, E) Percent of cells positive for vaccinia (D) and CD19 (E) from Plate 2 was determined by flow cytometry. Data are shown as mean ± SEM from one experiment. Statistical analysis using unpaired Student’s t-test. (F, G) Viable cells in Plate 2 receiving supernatants from Plate 1 cells exposed to the indicated MOI of OV19t. MDA-MB-468 (F) or U251T (G) cells were cultured for 24 h and then medium was replaced (dotted line) with supernatant from Plate 1 cells exposed to the indicated conditions. Viable cells were calculated as “cell index” using the xCELLigence RTCA system. Data are shown as mean ± SEM from one of two independent experiments.
Fig. 6.
Fig. 6.. OVm19t promotes tumor infiltration of both endogenous T cells and adoptively-transferred mCD19-CAR T cells.
(A) Histology showing murine CD3+ and CD8+ T cells in subcutaneous MC38 tumors harvested from mice treated intravenously with untransduced T cells (Mock) alone, mCD19-CAR T cells alone, OVm19t + Mock T cells, and OVm19t + mCD19-CAR T cells. Tumors were harvested 4 days after T cell administration and 6 days after OVm19t injection. Scale bars, 250 μm. (B) Quantification of immunohistochemical staining for murine CD8+ cells in tumors from mice treated as in A. Symbols indicate individual tumors from mice. Statistical analysis using unpaired Student’s t-test. (C) Representative flux imaging of mice 2 days after treatment with intratumoral OVm19t alone (n = 4), intravenous firefly luciferase-expressing mCD19-CAR T cells alone (n = 5), or OVm19t + firefly luciferase-expressing mCD19-CAR T cells (n = 10). (D) Quantification of T cell flux from the regions of interest shown in C. Symbols indicate flux for each mouse. Statistical analysis using unpaired Student’s t-test. (E) Tumor volume in treatment-naïve or previously cured C57BL/6j mice rechallenged by subcutaneous injection of MC38 (5 × 10⁵) cells. n = 7 for rechallenge group, n = 2 for treatment-naïve group. Individual tumors from mice are shown.

Comment in

References

    1. June CH, O’Connor RS, Kawalekar OU, Ghassemi S. & Milone MC CAR T cell immunotherapy for human cancer. Science 359, 1361–1365, doi:10.1126/science.aar6711 (2018). - DOI - PubMed
    1. Priceman SJ, Forman SJ & Brown CE Smart CARs engineered for cancer immunotherapy. Curr Opin Oncol 27, 466–474, doi:10.1097/CCO.0000000000000232 (2015). - DOI - PMC - PubMed
    1. Fesnak AD, June CH & Levine BL Engineered T cells: the promise and challenges of cancer immunotherapy. Nature reviews. Cancer 16, 566–581, doi:10.1038/nrc.2016.97 (2016). - DOI - PMC - PubMed
    1. Davila ML & Sadelain M. Biology and clinical application of CAR T cells for B cell malignancies. Int J Hematol 104, 6–17, doi:10.1007/s12185-016-2039-6 (2016). - DOI - PMC - PubMed
    1. Liu Y, Chen X, Han W. & Zhang Y. Tisagenlecleucel, an approved anti-CD19 chimeric antigen receptor T-cell therapy for the treatment of leukemia. Drugs Today (Barc) 53, 597–608, doi:10.1358/dot.2017.53.11.2725754 (2017). - DOI - PubMed

Publication types