. 2020 Sep 2;12(559):eabb3774.
doi: 10.1126/scitranslmed.abb3774.

C9orf72 poly(GR) aggregation induces TDP-43 proteinopathy

Affiliations

C9orf72 poly(GR) aggregation induces TDP-43 proteinopathy

Casey N Cook et al. Sci Transl Med. .

Abstract

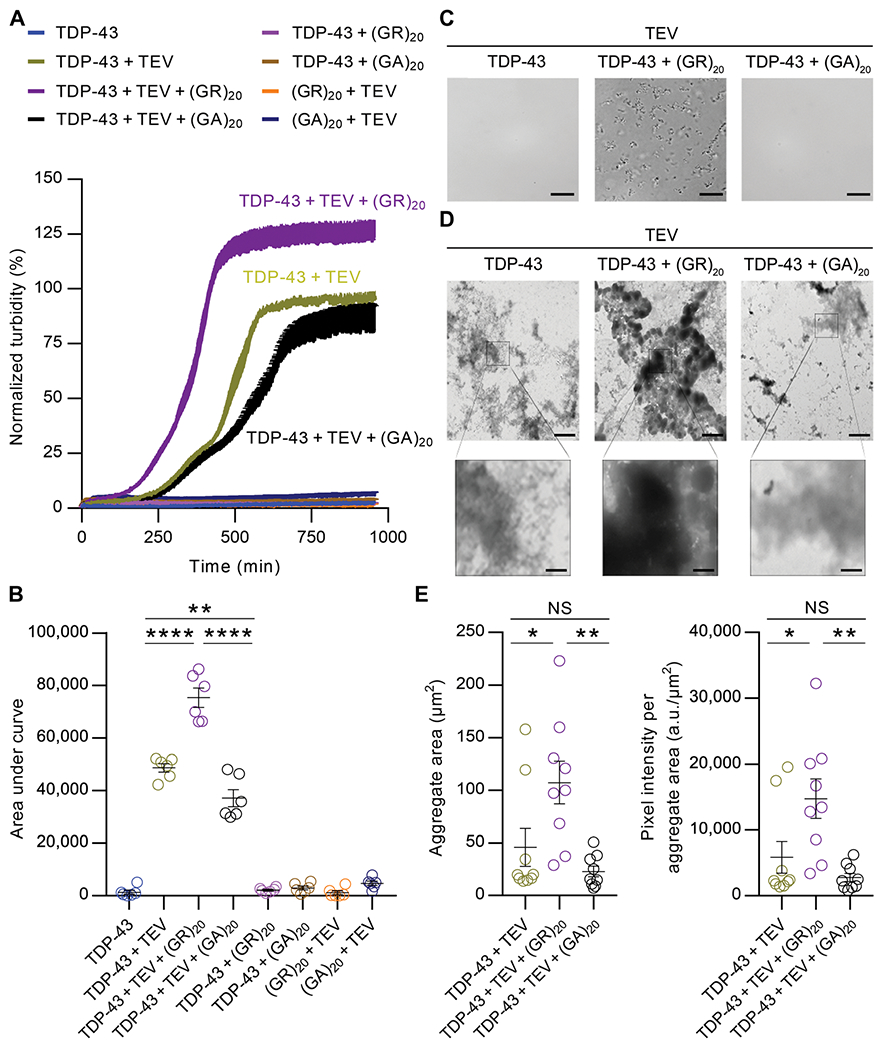
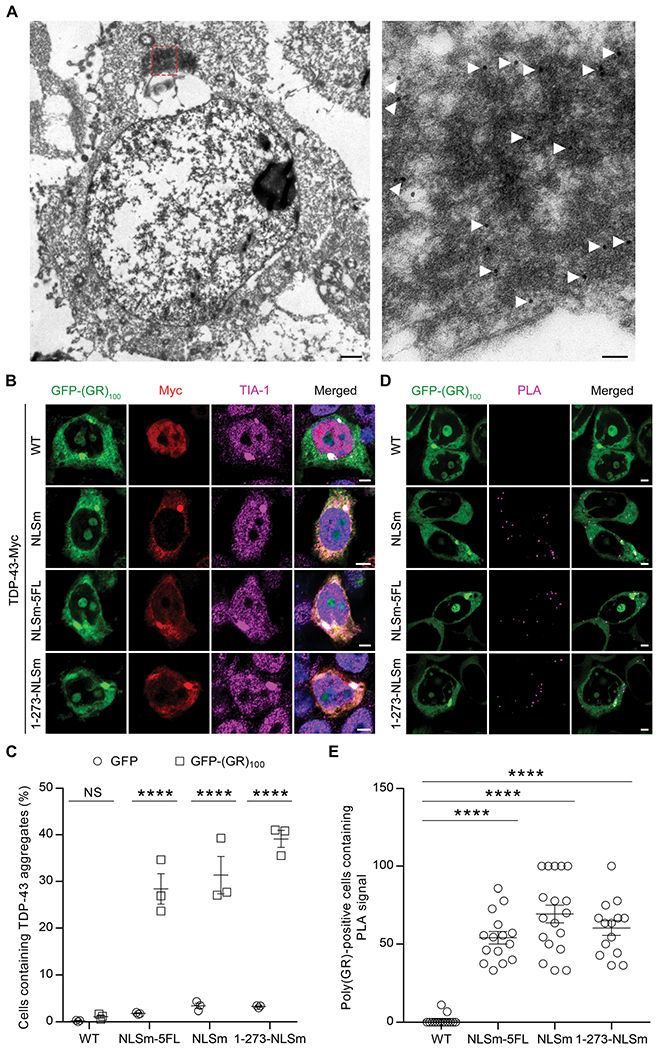
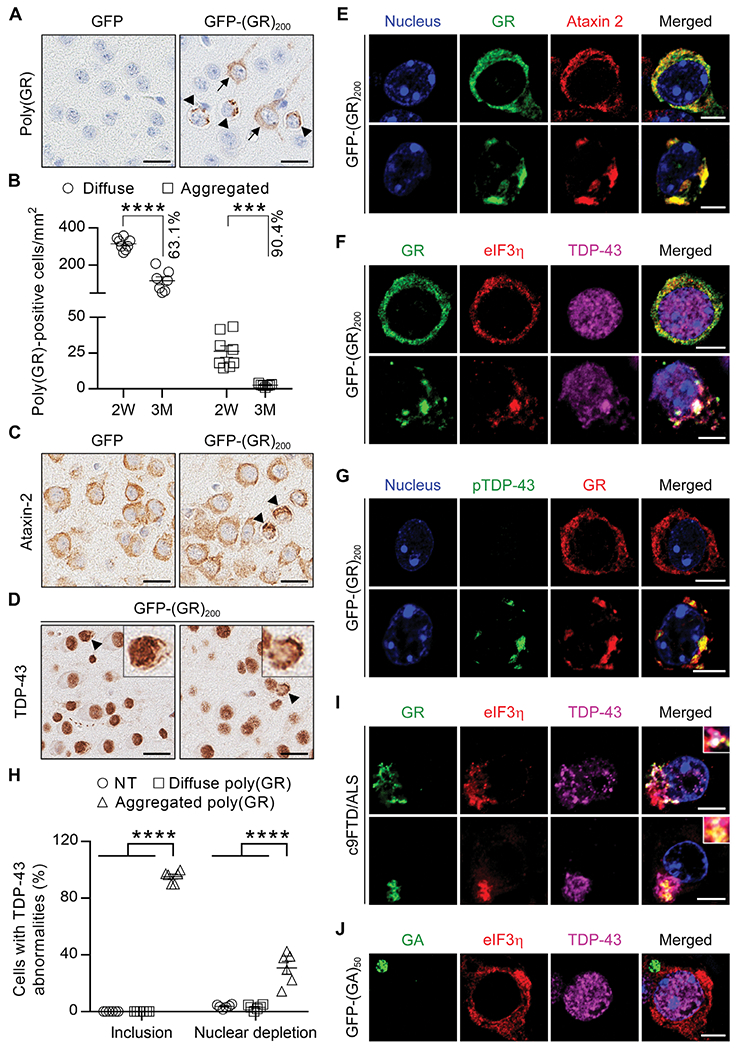
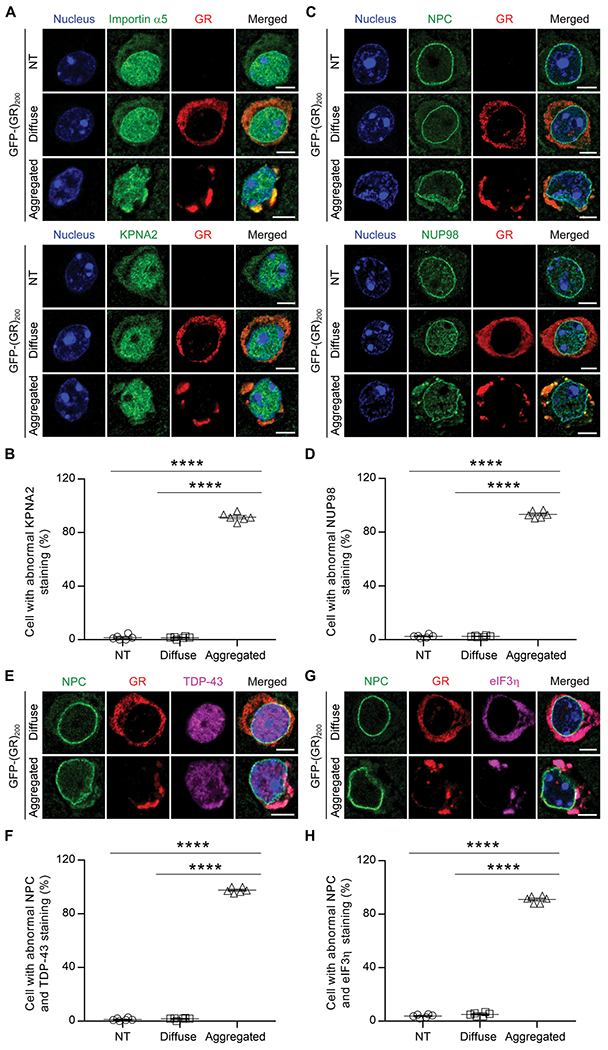
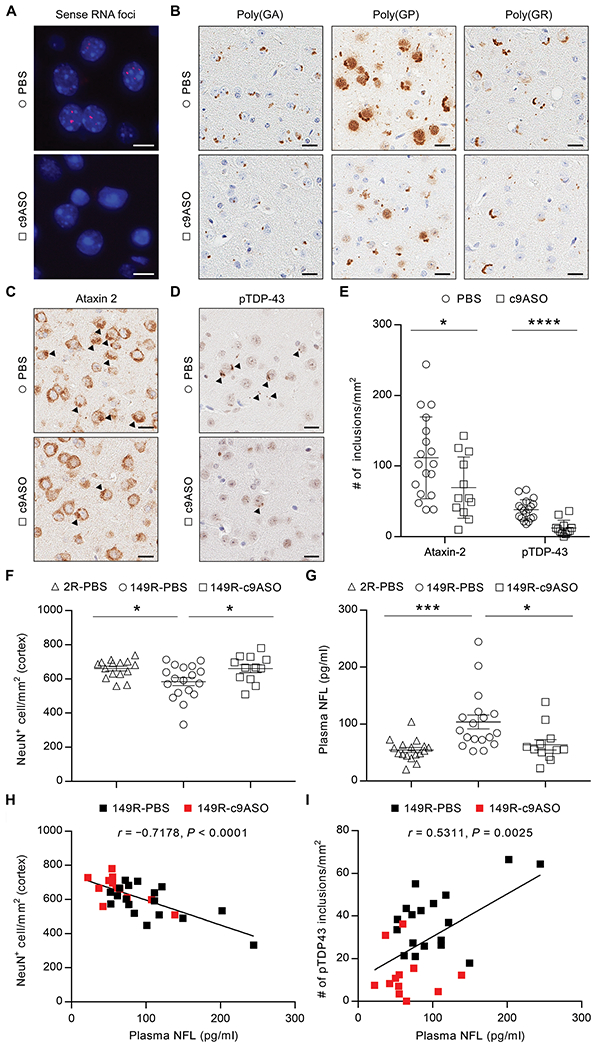
TAR DNA-binding protein 43 (TDP-43) inclusions are a pathological hallmark of frontotemporal dementia (FTD) and amyotrophic lateral sclerosis (ALS), including cases caused by G4C2 repeat expansions in the C9orf72 gene (c9FTD/ALS). Providing mechanistic insight into the link between C9orf72 mutations and TDP-43 pathology, we demonstrated that a glycine-arginine repeat protein [poly(GR)] translated from expanded G4C2 repeats was sufficient to promote aggregation of endogenous TDP-43. In particular, toxic poly(GR) proteins mediated sequestration of full-length TDP-43 in an RNA-independent manner to induce cytoplasmic TDP-43 inclusion formation. Moreover, in GFP-(GR)200 mice, poly(GR) caused the mislocalization of nucleocytoplasmic transport factors and nuclear pore complex proteins. These mislocalization events resulted in the aberrant accumulation of endogenous TDP-43 in the cytoplasm where it co-aggregated with poly(GR). Last, we demonstrated that treating G4C2 repeat-expressing mice with repeat-targeting antisense oligonucleotides lowered poly(GR) burden, which was accompanied by reduced TDP-43 pathology and neurodegeneration, including lowering of plasma neurofilament light (NFL) concentration. These results contribute to clarification of the mechanism by which poly(GR) drives TDP-43 proteinopathy, confirm that G4C2-targeted therapeutics reduce TDP-43 pathology in vivo, and demonstrate that alterations in plasma NFL provide insight into the therapeutic efficacy of disease-modifying treatments.


Conflict of interest statement

Competing interests: B.O. has consulted for Biogen, Medicinova, Mitsubishi, Amylyx, and Tsumura. F.R. is a paid employee of Ionis Pharmaceuticals. G.S.T. and A.M. are paid employees of Biogen Idec. L.P. is a consultant for Expansion Therapeutics. Other authors declare no competing interests.

Figures

Fig. 1.
Fig. 1.. Poly(GR) directly accelerates and enhances TDP-43 aggregation.
(A) TDP-43–MBP (5 μM) was incubated with buffer, 2 μM poly(GR), or 2 μM poly(GA) in the presence or absence of TEV protease (1 μg/ml). Aggregation was assessed by turbidity measured at an absorbance of 395 nm. Values are normalized mean ±SEM (n = 6). (B) Quantification of the area under the curve in turbidity for each condition in the in vitro aggregation assay (n = 6). (C) TDP-43 aggregation was initiated as described above, with the addition of TEV protease (10 μg/ml) with or without co-incubation with poly(GR) or poly(GA) for 30 min. Aggregation was visualized by differential interference contrast microscopy. Scale bars, 10 μm. (D) Representative electron micrographs of TDP-43 with or without poly(GR) or poly(GA). Samples were processed for EM at the end point of the turbidity assay. Scale bars, 2 μm (top) and 0.4 μm (bottom). (E) EM quantification of TDP-43 aggregate area and intensity per aggregate area with or without poly(GR) or poly(GA) (n = 9). Data shown are the mean ± SEM, one-way ANOVA, Tukey’s post hoc analysis. In (B), **P = 0.0027 and ****P < 0.0001. In (E), * (left to right) P = 0.0300 and P = 0.0263, ** (left to right) P = 0.0027 and P = 0.0027, NS (not significant; left to right) P = 0.5707 and P = 0.6080. a.u., arbitrary units.
Fig. 2.
Fig. 2.. Poly(GR) mediates sequestration of cytosolic full-length TDP-43 into the inclusions.
(A) IEM using an anti-poly(GR) antibody labeled with gold particles (18 nm) in HEK293T cells expressing GFP(GR)100. The selected region in the low-magnification image (left) is shown at high magnification (right). Scale bars, 1 μm (left) and 0.1 μm (right). (B) Triple-immunofluorescence staining for poly(GR), TDP-43, and TIA-1 in HEK293T cells expressing GFP-(GR)100 and various Myc-tagged TDP-43 species. Scale bars, 5 μm. (C) Quantification of the number of cytoplasmic TDP-43 aggregates in HEK293T cells co-expressing various Myc-tagged TDP-43 constructs with either GFP or GFP-(GR)100 (n = 3 independent experiments). (D) Proximity ligation assay (PLA) for GFP-(GR)100 and Myc-tagged TDP-43 species in HEK293T cells, with the PLA signal being indicative of their interaction. Scale bars, 5 μm. (E) Quantification of the PLA signal in HEK293T cells expressing GFP-(GR)100 and Myc-tagged TDP-43 species (n = 14 to 18 images). Data shown are the mean ± SEM. In (C), ****P < 0.0001 and NS P = 0.9959, two-way ANOVA, Tukey’s post hoc analysis. In (E), ****P < 0.0001, one-way ANOVA, Tukey’s post hoc analysis. WT, wild type.
Fig. 3.
Fig. 3.. Poly(GR) aggregation is sufficient to induce mislocalization and aggregation of endogenous TDP-43 in vivo.
(A) Representative images of immunohistochemical analysis of poly(GR) in the cortex of 2-week-old GFP mice or GFP-(GR)200 mice (diffuse labeling noted by black arrows, aggregates indicated by black arrowheads). Scale bars, 20 μm. (B) Quantification of the number of poly(GR)-positive cells with either diffuse or aggregated poly(GR) in 2-week-old (n = 8) or 3-month-old (n = 7) GFP-(GR)200 mice. (C) Representative images of immunohistochemical analysis of ataxin-2 (inclusions indicated by black arrowheads) in the cortex of 2-week-old GFP or GFP-(GR)200 mice. (D) Representative images of immunohistochemical analysis of TDP-43 in the cortex of 2-week-old GFP-(GR)200 mice. Arrowheads in GFP-(GR)200 mice indicate cells with TDP-43–positive inclusions and either normal (left panel) or reduced (right panel) nuclear TDP-43. Scale bars, 20 μm. (E) Double-immunofluorescence staining for poly(GR) and ataxin-2 in the cortex of 2-week-old GFP-(GR)200 mice (n = 6). Scale bars, 5 μm. (F) Triple-immunofluorescence staining for eIF3η, TDP-43, and poly(GR) in the cortex of 2-week-old GFP-(GR)200 mice (n = 6). Scale bars, 5 μm. (G) Double-immunofluorescence staining for poly(GR) and pTDP-43 in the cortex of 2-week-old GFP-(GR)200 mice (n = 6). Scale bars, 5 μm. (H) Quantification of the percentage of cells that are either nontransduced (NT) cells or transduced cells with either diffuse or aggregated poly(GR) that contain TDP-43 inclusions and exhibit depleted nuclear TDP-43 in 2-week-old GFP-(GR)200 mice (n = 6). (I) Triple-immunofluorescence staining for poly(GR), eIF3η, and TDP-43 in the hippocampus of patients with c9FTD/ALS [case #1 (top), case #2 (bottom); see table S3 for patient information]. (J) Triple-immunofluorescence staining for poly(GA), eIF3η, and TDP-43 in the cortex of 3-month-old GFP-(GA)50 mice (n = 3). Scale bars, 5 μm. Data shown are the mean ± SEM. In (B), ***P = 0.0001 and ****P < 0.0001, two-tailed unpaired t test. In (H), **** P < 0.0001, one-way ANOVA, Tukey’s post hoc analysis.
Fig. 4.
Fig. 4.. Poly(GR) aggregates sequester nucleocytoplasmic transport factors and NPC proteins in vivo.
(A) Double-immunofluorescence staining for poly(GR) and importins in nontransduced (NT), diffuse, or aggregated poly(GR) cells, including importin α5 (top three panels) and karyopherin α2 (KNPA2; bottom three panels) in the cortex of 2-week-old GFP-(GR)200 mice (n = 6). Scale bars, 5 μm. (B) Quantification of the percentage of NT cells or of transduced cells with either diffuse or aggregated poly(GR) that contain abnormal KPNA2 in 2-week-old GFP-(GR)200 mice (n = 6). (C) Double-immunofluorescence staining for poly(GR) and several NPC proteins, including NPC (top three panels) and NUP98 (bottom three panels) in the cortex of 2-week-old GFP-(GR)200 mice (n = 6). Scale bars, 5 μm. (D) Quantification of the percentage of NT cells or of transduced cells with either diffuse or aggregated poly(GR) that contain abnormal NUP98 in 2-week-old GFP-(GR)200 mice (n = 6). (E) Triple-immunofluorescence staining for NPC, poly(GR), and TDP-43 in the cortex of GFP-(GR)200 mice (n = 6). Scale bars, 5 μm. (F) Quantification of the percentage of NT cells or of transduced cells with either diffuse or aggregated poly(GR) that contain abnormal NPC and TDP-43 in 2-week-old GFP-(GR)200 mice (n = 6). (G) Triple-immunofluorescence staining for NPC, poly(GR), and eIF3η in the cortex of 2-week-old GFP-(GR)200 mice (n = 6). Scale bars, 5 μm. (H) Quantification of the percentage of NT cells or of transduced cells with either diffuse or aggregated poly(GR) that contain abnormal NPC and eIF3η in 2-week-old GFP-(GR)200 mice (n = 6). Data shown are the mean ± SEM; ****P < 0.0001, one-way ANOVA, Tukey’s post hoc analysis.
Fig. 5.
Fig. 5.. A G4C2-targeting therapeutic reduces poly(GR) and alleviates TDP-43 aggregation and neurodegeneration in vivo.
(A) Representative images of RNA FISH for the detection of sense RNA foci in (G4C2)149 mice treated with PBS or c9ASO. Scale bars, 10 μm. (B) Immunohistochemical labeling of poly(GA), poly(GP), and poly(GR) in PBS- or c9ASO-treated (G4C2)149 mice. Scale bars, 20 μm. (C and D) Representative images of immunohistochemical analysis of ataxin-2 (C) and pTDP-43 (D) in PBS- or c9ASO-treated (G4C2)149 mice, with inclusions indicated by black arrowheads. Scale bars, 20 μm. (E) Quantitative analysis of the number of ataxin-2 or pTDP-43 inclusions per square millimeter of cortex in (G4C2)149 mice treated with PBS (n = 18) or c9ASO (n = 12). (F) Quantitative analysis of the number of NeuN-positive neurons per square millimeter of cortex in (G4C2)149 mice treated with PBS (149R-PBS, n = 18) or c9ASO (149R-c9ASO, n = 12) relative to (G4C2)2 control mice treated with PBS (2R-PBS, n = 15). (G) Plasma neurofilament light (NFL) concentrations in mice measured using the Simoa HD-1 Analyzer (2R-PBS, n = 17; 149R-PBS, n = 18; 149R-c9ASO, n = 12). (H) The number of NeuN-positive neurons per square millimeter of cortex negatively correlated with plasma NFL concentrations in (G4C2)149 mice (PBS- and c9ASO-treated mice indicated by black and red squares, respectively). (I) The number of pTDP-43 inclusions per square millimeter of cortex positively correlated with plasma NFL concentrations in (G4C2)149 mice. Data represent the mean ± SEM. In (E), *P=0.0407 and ****P < 0.0001, unpaired two-tailed t test. In (F), * (left to right) P=0.0293 and P=0.0426, one-way ANOVA, Tukey’s post hoc analysis. In (G), *P=0.0166 and ***P=0.0009, one-way ANOVA, Tukey’s post hoc analysis.

References

    1. Neumann M, Sampathu DM, Kwong LK, Truax AC, Micsenyi MC, Chou TT, Bruce J, Schuck T, Grossman M, Clark CM, McCluskey LF, Miller BL, Masliah E, Mackenzie IR, Feldman H, Feiden W, Kretzschmar HA, Trojanowski JQ, Lee VM-Y, Ubiquitinated TDP-43 in frontotemporal lobar degeneration and amyotrophic lateral sclerosis. Science 314, 130–133 (2006). - PubMed
    1. Arai T, Hasegawa M, Akiyama H, Ikeda K, Nonaka T, Mori H, Mann D, Tsuchiya K, Yoshida M, Hashizume Y, Oda T, TDP-43 is a component of ubiquitin-positive tau-negative inclusions in frontotemporal lobar degeneration and amyotrophic lateral sclerosis. Biochem. Biophys. Res. Commun 351, 602–611 (2006). - PubMed
    1. DeJesus-Hernandez M, Mackenzie IR, Boeve BF, Boxer AL, Baker M, Rutherford NJ, Nicholson AM, Finch NA, Flynn H, Adamson J, Kouri N, Wojtas A, Sengdy P, Hsiung G-YR, Karydas A, Seeley WW, Josephs KA, Coppola G, Geschwind DH, Wszolek ZK, Feldman H, Knopman DS, Petersen RC, Miller BL, Dickson DW, Boylan KB, Graff-Radford NR, Rademakers R, Expanded GGGGCC hexanucleotide repeat in noncoding region of C9ORF72 causes chromosome 9p-linked FTD and ALS. Neuron 72, 245–256 (2011). - PMC - PubMed
    1. Renton AE, Majounie E, Waite A, Simón-Sánchez J, Rollinson S, Gibbs JR, Schymick JC, Laaksovirta H, van Swieten JC, Myllykangas L, Kalimo H, Paetau A, Abramzon Y, Remes AM, Kaganovich A, Scholz SW, Duckworth J, Ding J, Harmer DW, Hernandez DG, Johnson JO, Mok K, Ryten M, Trabzuni D, Guerreiro RJ, Orrell RW, Neal J, Murray A, Pearson J, Jansen IE, Sondervan D, Seelaar H, Blake D, Young K, Halliwell N, Callister JB, Toulson G, Richardson A, Gerhard A, Snowden J, Mann D, Neary D, Nalls MA, Peuralinna T, Jansson L, Isoviita V-M, Kaivorinne A-L, Hölttä-Vuori M, Ikonen E, Sulkava R, Benatar M, Wuu J, Chiò A, Restagno G, Borghero G, Sabatelli M; The ITALSGEN Consortium, Heckerman D, Rogaeva E, Zinman L, Rothstein JD, Sendtner M, Drepper C, Eichler EE, Alkan C, Abdullaev Z, Pack SD, Dutra A, Pak E, Hardy J, Singleton A, Williams NM, Heutink P, Pickering-Brown S, Morris HR, Tienari PJ, Traynor BJ, A hexanucleotide repeat expansion in C9ORF72 is the cause of chromosome 9p21-linked ALS-FTD. Neuron 72, 257–268 (2011). - PMC - PubMed
    1. Lagier-Tourenne C, Baughn M, Rigo F, Sun S, Liu P, Li H-R, Jiang J, Watt AT, Chun S, Katz M, Qiu J, Sun Y, Ling S-C, Zhu Q, Polymenidou M, Drenner K, Artates JW, McAlonis-Downes M, Markmiller S, Hutt KR, Pizzo DP, Cady J, Harms MB, Baloh RH, Vandenberg SR, Yeo GW, Fu X-D, Bennett CF, Cleveland DW, Ravits J, Targeted degradation of sense and antisense C9orf72 RNA foci as therapy for ALS and frontotemporal degeneration. Proc. Natl. Acad. Sci. U.S.A 110, E4530–E4539 (2013). - PMC - PubMed

Publication types

MeSH terms