. 2020 Sep 2;12(559):eaaz4589.
doi: 10.1126/scitranslmed.aaz4589.

A YAP/FOXM1 axis mediates EMT-associated EGFR inhibitor resistance and increased expression of spindle assembly checkpoint components

Affiliations

A YAP/FOXM1 axis mediates EMT-associated EGFR inhibitor resistance and increased expression of spindle assembly checkpoint components

Monique B Nilsson et al. Sci Transl Med. .

Abstract

Acquired resistance to tyrosine kinase inhibitors (TKIs) of epidermal growth factor receptor (EGFR) remains a clinical challenge. Especially challenging are cases in which resistance emerges through EGFR-independent mechanisms, such as through pathways that promote epithelial-to-mesenchymal transition (EMT). Through an integrated transcriptomic, proteomic, and drug screening approach, we identified activation of the yes-associated protein (YAP) and forkhead box protein M1 (FOXM1) axis as a driver of EMT-associated EGFR TKI resistance. EGFR inhibitor resistance was associated with broad multidrug resistance that extended across multiple chemotherapeutic and targeted agents, consistent with the difficulty of effectively treating resistant disease. EGFR TKI-resistant cells displayed increased abundance of spindle assembly checkpoint (SAC) proteins, including polo-like kinase 1 (PLK1), Aurora kinases, survivin, and kinesin spindle protein (KSP). Moreover, EGFR TKI-resistant cells exhibited vulnerability to SAC inhibitors. Increased activation of the YAP/FOXM1 axis mediated an increase in the abundance of SAC components in resistant cells. The clinical relevance of these finding was indicated by evaluation of specimens from patients with EGFR mutant lung cancer, which showed that high FOXM1 expression correlated with expression of genes encoding SAC proteins and was associated with a worse clinical outcome. These data revealed the YAP/FOXM1 axis as a central regulator of EMT-associated EGFR TKI resistance and that this pathway, along with SAC components, are therapeutic vulnerabilities for targeting this multidrug-resistant phenotype.


Figures

Fig. 1.
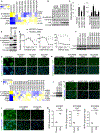
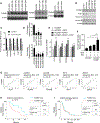
Fig. 1.. T790M-negative acquired resistance to EGFR TKIs is associated with an EMT, Aurora, and YAP gene signature.
(A) IC50 values for parental (HCC4006 and HCC827) and EGFR TKI-resistant (ER) variants for erlotinib and osimertinib. Data are represented as mean ± SEM (n ≥ 3) from two independent experiments. Each dot represents a cell line. (B) Heatmap representing 1862 differentially expressed genes between parental and ER cells as identified through RNA sequence analysis. (C) EMT gene signature enrichment in ER cells as determined by GSEA. (D to G) Gene expression of CDH1 (D), VIM (E), AXL (F), ZEB1, and ZEB2 (G). (H and I) GSEA of Aurora B gene signature enrichment (H) and YAP gene signature enrichment (I) in ER cells compared to parental cells.
Fig. 2.
Fig. 2.. EGFR-independent EGFR TKI resistance cells have a mesenchymal phenotype and increased YAP.
(A) Abundance of epithelial and mesenchymal markers in parental and ER cells as determined by RPPA. (B) Detection of epithelial and mesenchymal markers by Western blotting. (C) Invasive capacity of parental and ER cells. Data are presented as mean ± SEM. *p < 0.05; one-way ANOVA. (D) Detection of epithelial and mesenchymal markers in HCC827-ZEB1 and vector control cells. (E) Dose response curve for HCC827-ZEB1 and vector control cells treated with EGFR TKIs erlotinib, osimertinib, and afatinib. Data are graphed as mean ± SEM (n ≥ 3). *p < 0.01; two-tailed Student’s t-test. (F) YAP expression in EGFR TKI resistant cells and parental lines as determine by Western blotting. (G and H) Immunofluorescent staining of YAP in HCC827 (G) and HCC4006 parental (H) and ER cells. Scale bars, 50 μm. (I) Abundance of EMT markers in H1975 and H1975 OR variants as determined by RPPA. (J) YAP abundance in H1975 OR cells as determined by Western blotting. (K and L) Immunofluorescent staining of YAP in H1975 OR (K) and HCC4006 OR (L) cells. Scale bars, 50 μm. (M) YAP abundance following treatment with erlotinib (ERL) or osimertinib (OSI) as determined by RPPA. Data are presented as mean ± SEM of three biological replicates. Statistical significance determined by two-tailed Student’s t-test. Data in panels (B), (C), (E), are representative of three independent experiments. Data in (D), (F), and (J) are representative of two independent experiments. Data in (H) and (L) are representative of multiple high-power fields (n ≥ 3) from two independent experiments. Data in (G) and (K) are representative of multiple high-power fields (n ≥ 3) from three independent experiments.
Fig. 3.
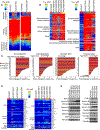
Fig. 3.. Resistance to EGFR TKIs is associated with broad spectrum drug resistance but vulnerability to SAC and CDK inhibitors.
(A) Comparison of GI50 values between parental and ER cells. (B) Acquired resistance of HCC4006 ER cells and HCC827 ER cells to therapeutic agents. (C) IC70 drug sensitivity data for HCC4006 ER1, HCC4006 ER3, HCC827 ER1, and HCC827 ER6 cells as compared to the drug sensitivity profile of the respective parental cells. (D) Sensitivity of HCC827 ER and HCC4006 ER cells to agents targeting CDK, Aurora kinase, PLK1, BCL, KSP, or survivin. (E) Abundance of drug targets in parental and ER cell lines. Data in (E) are representative of three independent experiments. Data in (A) to (D) are displayed as the mean of two independent experiments performed in triplicate, and statistical significance was determined by two-sample t-test. See data files S2, S3, and S6–S9 for drugs and specific sensitivity values.
Fig. 4.
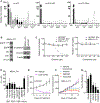
Fig. 4.. Osimertinib-resistant (OR) cells and a patient-derived cell model of EGFR TKI resistance are sensitive to SAC component inhibitors.
(A) Sensitivity of H1975 parental and H1975 OR cell lines to volasertib (VOL), ispinesib (ISP), AMG-900 (AMG), or alisertib (ALI). Viability was determined by clonogenic assay. Data are presented as the mean of three independent experiments ± SEM. (*p < 0.05); one-way ANOVA. (B) Detection of EGFRL858R and EMT markers by MDA-L-011 cells. Data are representative of two independent experiments. (C) Dose response curve for MDA-L-011 cells treated with erlotinib or osimertinib. Data are presented as mean ± SEM (n ≥ 3) and are representative of two independent experiments. *p < 0.001 versus HCC827; two-tailed Student’s t-test. (D) In vitro sensitivity of MDA-L-011 cells to CDK and SAC component inhibitors by clonogenic assay. Data are presented as mean ± SEM (n ≥ 3) and are representative of three independent experiments. (E) Effect of osimertinib on the growth of HCC827 xenograft tumors. Data are shown as mean ± SEM. *p = 0.003; Tukey’s test (vehicle n = 6; osimertinib n = 6). (F) Effect of alisertib, ispinesib, volasertib. or osimertinib on the growth of MDA-L-011 tumors. Data are shown as mean ± SEM. Statistical significance determined by Tukey’s test: *p = 0.03; **p = 0.004 (vehicle n = 8; osimertinib n = 7; alisertib n = 8; ispinesib n = 8; volasertib n = 7). (G) Tumor weight after 21 days of treatment for tumors shown in (F). Data are mean ± SEM. *p = 0.037; **p ≤ 0.01; one-way ANOVA. Data are representative of two independent experiments.
Fig. 5.
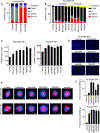
Fig. 5.. CDK and SAC component inhibitors induce tumor cell death and mitotic catastrophe.
(A) Cell cycle analysis of HCC4006 ER1 cells treated with dinaciclib (100 nM), alvocidib (500 nM), or erlotinib (1 μM). Representative data from two independent experiments are shown. (B) Cell cycle analysis of HCC4006 ER1 cells treated with volasertib (100 nM), ispinesib (100 nM), SB743921 (100 nM), AMG-900 (100 nM), or alisertib (500 nM). Representative data from three independent experiments are shown. (C) Nuclear size (pixels) of HCC4006 ER1 and HCC827 ER1 cells after treatment with dinaciclib (100 nM), volasertib (100 nM), ispinesib (100 nM), SB743921 (100 nM), AMG-900 (100 nM), or alisertib (100 nM). Data are presented as mean ± SEM (n ≥ 3) and are representative of three independent experiments. *p < 0.05; one-way ANOVA. (D) Representative images of HCC4006 ER1 cells following treatment with SAC component inhibitors. Cells are labeled with Hoechst nuclear stain. Data are representative of three experiments. Scale bar, 100 μm. (E) Effect of volasertib (10 nM), ispinesib (10 nM), SB743921 (10 nM), AMG-900 (10 nM), or alisertib (50 nM) on microtubule formation in HCC4006 ER1 and HCC827 ER1 cells. Data are representative of three biological replicates. Scale bar, 5 μm. (F) Percentage of total number of HCC4006 ER1 or HCC827 ER1 cells undergoing aberrant mitosis following 24-hour treatment with SAC component inhibitors at same concentrations used in (E). Data are presented as mean ± SEM from three biological replicates. *p < 0.05; one-way ANOVA.
Fig. 6.
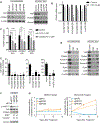
Fig. 6.. FOXM1 is overexpressed in EGFR TKI resistant cells and regulates expression of SAC components.
(A) Western blotting for FOXM1 in EGFR TKI resistant cells and parental cell lines. (B) Effect of siRNA-mediated knockdown of FOXM1 on abundance of PLK1, Aurora A, and Aurora B in HCC4006 ER6 cells. (C) RNA expression of AURKA, AURKB, KIF11, PLK1, and BIRC5 in HCC4006 ER1 cells after incubation with FDI-6 for 4 hours. Data are presented as mean ± SEM (n ≥ 3). *p < 0.001; two-tailed Student’s t-test. (D) Effect of FDI-6 (40 μM) on viability of ER cells and parental cells. Data are presented as mean ± SEM (n ≥ 3). *p ≤ 0.002; one-way ANOVA. (E) PLK1, AURKA, AURKB, and KIF11 expression after FOXM1 overexpression in HCC827 cells using a doxycycline-inducible expression vector. Data are presented as mean ± SEM from one of two experiments. *p ≤ 0.01, **p < 0.0001 vs HCC827; two-way ANOVA. (F) Effect of erlotinib (70 nM) on viability of HCC827 cells with or without induced expression of FOXM1. Data are presented as mean ± SEM (n ≥ 3). *p < 0.001; one-way ANOVA. (G) Correlation of FOXM1 gene expression with expression of PLK1, AURKA, AURKB, KIF11, and BIRC5 in EGFR-mutant lung adenocarcinomas in TCGA dataset. (H and I) Progression-free survival for patients with EGFR mutant (H) or EGFR wild-type (I) lung adenocarcinoma with high or low FOXM1 expression. DFS, disease-free survival. Statistical significance was determined by log rank test. Data in (A), (B), (C), (D), and (F) are representative of three independent experiments.
Fig. 7.
Fig. 7.. YAP drives FOXM1 expression in EGFR TKI resistant NSCLC cells.
(A) Detection of FOXM1 in EGFR TKI resistant cells after siRNA-mediated knockdown of YAP. Data are representative of four independent experiments. (B and C) Effect of YAP inhibitors CA3 (B) and verteporfin (C) on FOXM1 mRNA expression in the indicated cells. Data are presented as mean ± SEM (n ≥ 3). *p < 0.01 or as indicated; multiple Student’s t-tests. (D) Western blotting for FOXM1 and SAC components after treatment with CA3 and verteporfin (VP). (E) Effect of CA3 (0.5 μM) on viability of parental and EGFR TKI resistant cells. Data are graphed as cell viability relative to untreated control cells. Data are presented as mean + SEM (n ≥ 3). *p < 0.001; one-way ANOVA. (F) Effect of NF2 loss on YAP, FOXM1, vimentin, and ZEB1 as determined by Western blotting. Two different guide RNAs were used to independently abrogate NF2 expression. (G) Resistance to osimertinib (50 nM) following knockout of NF2. Data are presented as mean ± SD (n = 3). ***p < 0.0001; Student’s t-test. Data in (B), (C), and (D) are representative of three independent experiments. Data in (E) and (G) are representative of two independent experiments.

References

    1. Mok TS et al., Gefitinib or carboplatin-paclitaxel in pulmonary adenocarcinoma. The New England journal of medicine 361, 947–957 (2009). - PubMed
    1. Rosell R et al., Erlotinib versus standard chemotherapy as first-line treatment for European patients with advanced EGFR mutation-positive non-small-cell lung cancer (EURTAC): a multicentre, open-label, randomised phase 3 trial. The Lancet. Oncology 13, 239–246 (2012). - PubMed
    1. Maemondo M et al., Gefitinib or chemotherapy for non-small-cell lung cancer with mutated EGFR. The New England journal of medicine 362, 2380–2388 (2010). - PubMed
    1. Sequist LV et al., First-line gefitinib in patients with advanced non-small-cell lung cancer harboring somatic EGFR mutations. Journal of clinical oncology: official journal of the American Society of Clinical Oncology 26, 2442–2449 (2008). - PubMed
    1. Mok TS et al., Osimertinib or Platinum-Pemetrexed in EGFR T790M-Positive Lung Cancer. N Engl J Med 376, 629–640 (2017). - PMC - PubMed

Publication types

MeSH terms