. 2020 Nov 27;295(48):16219-16238.
doi: 10.1074/jbc.RA120.014576. Epub 2020 Sep 2.

Mutant thermal proteome profiling for characterization of missense protein variants and their associated phenotypes within the proteome

Affiliations

Mutant thermal proteome profiling for characterization of missense protein variants and their associated phenotypes within the proteome

Sarah A Peck Justice et al. J Biol Chem. .

Abstract

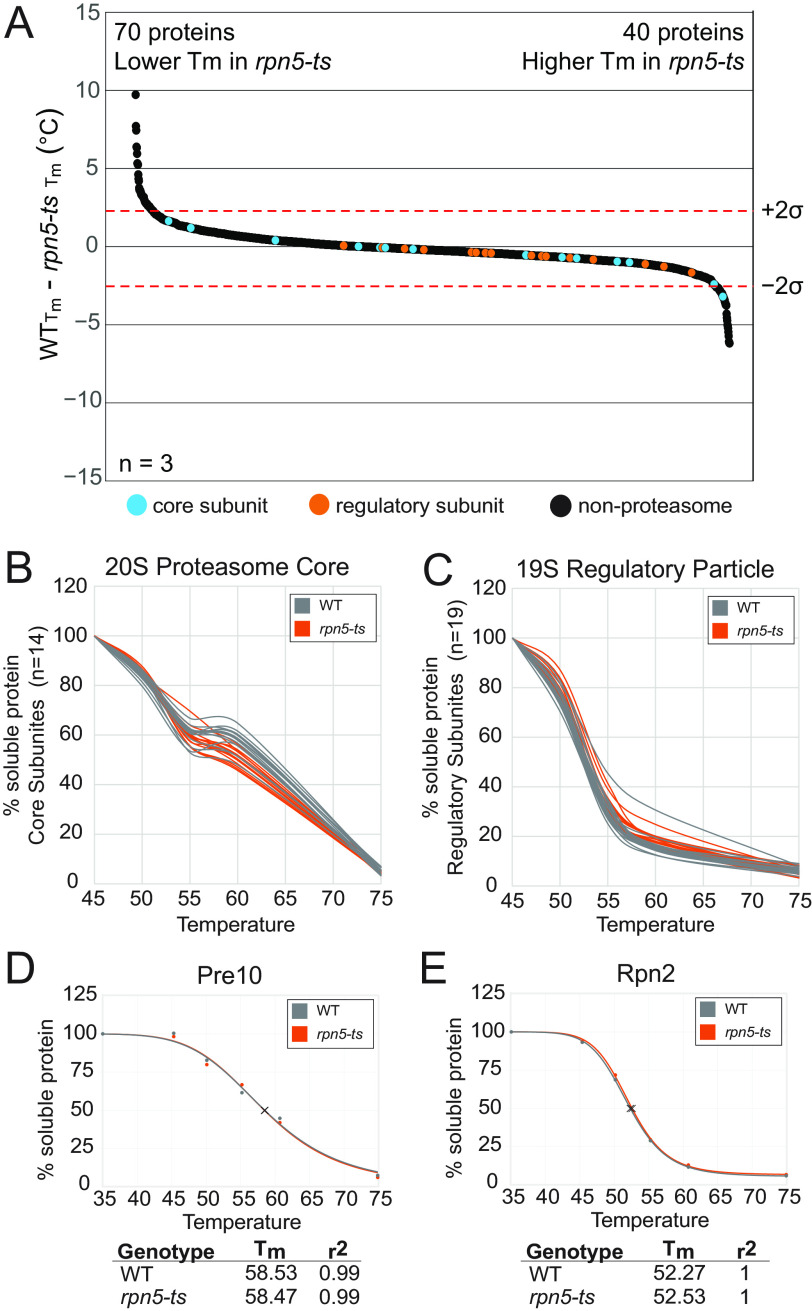
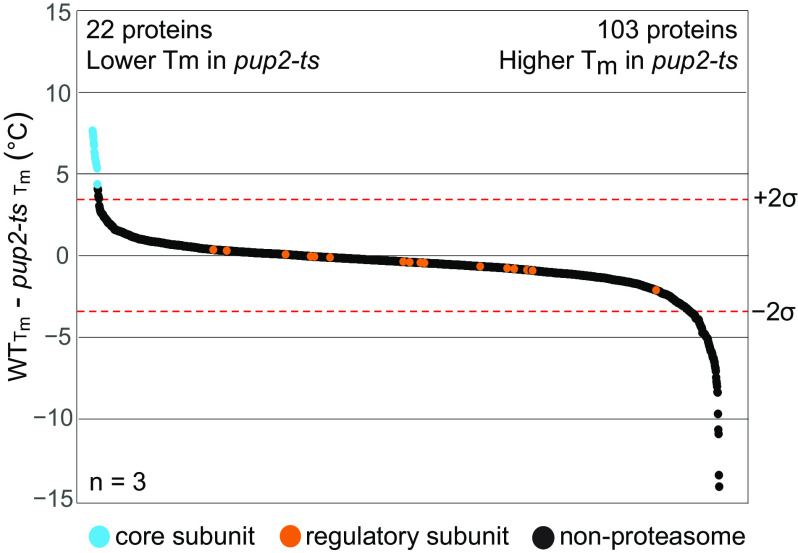
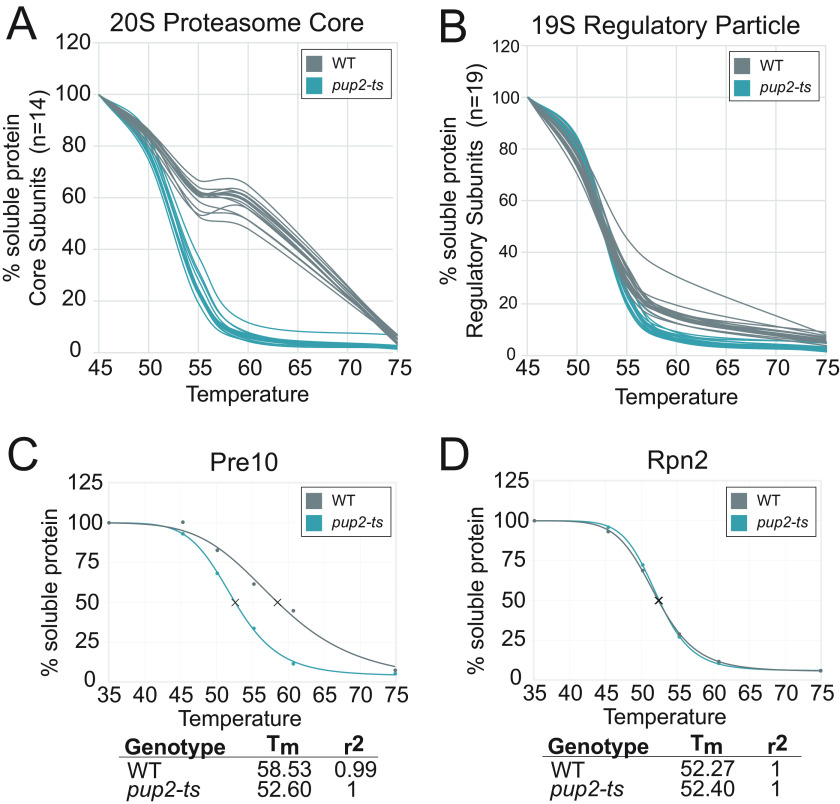
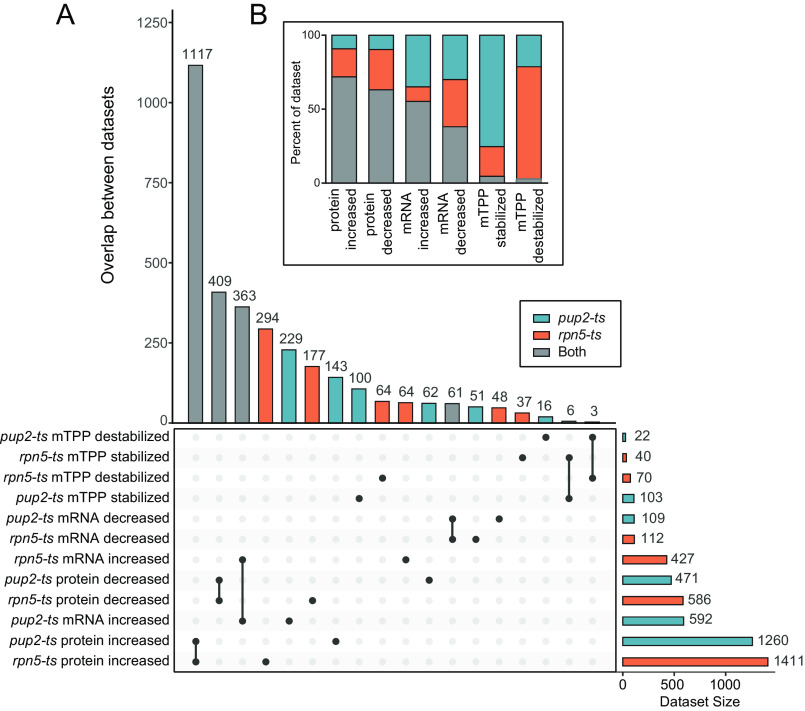
Temperature-sensitive (TS) missense mutants have been foundational for characterization of essential gene function. However, an unbiased approach for analysis of biochemical and biophysical changes in TS missense mutants within the context of their functional proteomes is lacking. We applied MS-based thermal proteome profiling (TPP) to investigate the proteome-wide effects of missense mutations in an application that we refer to as mutant thermal proteome profiling (mTPP). This study characterized global impacts of temperature sensitivity-inducing missense mutations in two different subunits of the 26S proteasome. The majority of alterations identified by RNA-Seq and global proteomics were similar between the mutants, which could suggest that a similar functional disruption is occurring in both missense variants. Results from mTPP, however, provide unique insights into the mechanisms that contribute to the TS phenotype in each mutant, revealing distinct changes that were not obtained using only steady-state transcriptome and proteome analyses. Computationally, multisite λ-dynamics simulations add clear support for mTPP experimental findings. This work shows that mTPP is a precise approach to measure changes in missense mutant-containing proteomes without the requirement for large amounts of starting material, specific antibodies against proteins of interest, and/or genetic manipulation of the biological system. Although experiments were performed under permissive conditions, mTPP provided insights into the underlying protein stability changes that cause dramatic cellular phenotypes observed at nonpermissive temperatures. Overall, mTPP provides unique mechanistic insights into missense mutation dysfunction and connection of genotype to phenotype in a rapid, nonbiased fashion.

Keywords: mass spectrometry; missense variant; mutant; proteasome; protein complex; protein stability; protein structure; protein-protein interaction; proteomics; systems biology; temperature-sensitive; thermal profiling.


Conflict of interest statement

Conflict of interest—The authors declare that they have no conflicts of interest with the contents of this article.

Figures

Figure 1.
Figure 1.
Global changes in protein and mRNA abundance. Volcano plots of fold-change vs. -log10 p-value in pup2-ts/WT of protein (A) and mRNA transcripts (B) and in rpn5-ts/WT of protein (C) and mRNA transcripts (D). x axis, log2 -fold change of mutant/WT; y axis, −log10 p value or FDR. The significance threshold was set at p value or FDR ≤0.05. 3,862 data points are shown on each plot. Proteasome core subunits are indicated in blue, and regulatory subunits are indicated in orange. A, a total of 1,731 proteins significantly changed in pup2-ts, with 471 proteins decreasing and 1,260 proteins increasing in abundance. B, A total of 701 mRNA transcripts significantly changed in pup2-ts, with 109 transcripts decreasing and 592 transcripts increasing in abundance. C, A total of 1,997 proteins significantly changed in rpn5-ts, with 586 proteins decreasing and 1,411 proteins increasing in abundance. D, a total of 539 mRNA transcripts significantly changed in rpn5-ts, with 112 transcripts decreasing and 427 transcripts increasing in abundance.
Figure 2.
Figure 2.
Mutant TPP workflow adaptations. A, equal amounts of protein from each lysate were subjected to six different temperature treatments, 35.0, 45.3, 50.1, 55.2, 60.7, and 74.9 °C, to induce protein denaturation. The soluble fractions from each treatment were digested in-solution with trypsin/Lys-C. The resulting peptides were labeled with isobaric mass tags (TMTsixplex™) and mixed by genotype prior to MS analysis. Resulting MS/MS data were analyzed using Proteome Discoverer™ 2.2 to identify and quantify abundance levels of peptides for each temperature treatment and each genotype. B, dot plots showing the abundance value for every protein detected from the MTPP experiments in WT, rpn5-ts, and pup2-ts. Box-and-whisker plots include minimum, maximum, and median. C, representative melt curves from a single replicate of the percentage of soluble protein following heat treatment are shown for selected protein complexes. Proteins isolated from WT are shown in gray, rpn5-ts in orange, and pup2-ts in teal. Shown here are curves of the RNA exosome (11 individual proteins), the 40S ribosome (39 individual proteins), and the chaperonin-containing T-complex (8 individual proteins). D, individual protein melt curves were created for every quantified protein and normalized using the TPP R package. Tm was calculated as the temperature at which 50% of the protein was denatured. Shown are one protein from each of the complexes in B.
Figure 3.
Figure 3.
Mutations in Rpn5 do not affect the thermal stability of the proteasome. A, waterfall plots visualizing whole-proteome changes in melt temperature (Tm), WTrpn5-ts. A total of 2,068 proteins were ordered according to change in Tm and plotted. Shown are median values across three biological replicates for proteins that were quantified in at least two replicates. Dotted lines signify a confidence interval of 95%. There were significant decreases in thermal stability of 70 proteins; 40 proteins had significant increases in thermal stability. B and C, representative melt curves from WT versus rpn5-ts for each of the 14 subunits of the 20S proteasome core (B) and the 19 subunits of the 19S regulatory particle (C) derived from data from one MTPP experiment. Each line represents an individual subunit. D and E, individual normalized melt curves of representative protein Pre10 from the 20S core (D) and Rpn2 from the 19S regulatory particle (E).
Figure 4.
Figure 4.
Mutations in Pup2 disrupt the core proteasome. Waterfall plots visualize whole-proteome changes in melt temperature (Tm), WTpup2-ts. A total of 2,046 proteins were ordered according to change in Tm and plotted. Shown are median values across three biological replicates for proteins that were quantified in at least two replicates. Dotted lines signify a confidence interval of 95%. There were significant decreases in thermal stability of 22 proteins; 103 proteins had significant increases in thermal stability.
Figure 5.
Figure 5.
mTPP uncovers thermal destabilization of all 20S core subunits of the proteasome in pup2-ts mutant cells. A and B, representative raw data melt curves from WT versus pup2-ts for each of the 14 subunits of the 20S proteasome core (A) and the 19 subunits of the 19S regulatory particle (B) derived from data from the mTPP experiment. Each line represents an individual subunit. C and D, individual normalized melt curves of representative proteins Pre10 from the 20S core (C) and Rpn2 from the 19S regulatory particle (D).
Figure 6.
Figure 6.
Multiomics intersection analysis of pup2-ts and rpn5-ts. Upset plots visualize the overlap of gene products within the sets of significant changes measured in MTPP, global proteomics, and mRNA sequencing in pup2-ts (A) and rpn5-ts (B). An arrow indicates subset mentioned in the text.
Figure 7.
Figure 7.
Comparing changes between rpn5-ts and pup2-ts. Shown is an upset plot of the overlap in changes between rpn5-ts (orange) and pup2-ts (teal). Gene products that are changing in the same way in both genotypes are indicated in gray. B, a stacked bar plot shows the percentage of each data set that is changing in the same direction in both mutants (gray) or changes unique to rpn5-ts (orange) or pup2-ts (teal).
Figure 8.
Figure 8.
Structural observations from the MSλD trajectories. A, overlay of complex C76R Pup2 (cyan with residues 76 and 113 in peach) and complex C76R+T113M pup2-ts (purple with residues 76 and 113 in green). Arg-76 points inward, disrupting important hydrophobic interactions between Leu-144, Leu-112, Ile-144, Ile-70, and Val-116. Met-113, however, is able to occupy space adjacent to Arg-76 to help offset the disruption of this hydrophobic core in Pup2. B, overlay of complex native Pup2 (cyan) and complex C76R pup2-ts (purple with residue 76 in green). Nearby water molecules are able to penetrate into the core of Pup2 when Arg-76 protrudes inward and disrupts the hydrophobic network of nearby valine, leucine, and isoleucine residues. C, overlay of unbound native Pup2 (cyan with residue 76 in peach) and unbound C76R pup2-ts (purple with residue 76 in green). In addition to its inward conformation, Arg-76 is also observed to protrude outward, which induces large structural distortions in residues 84–101, the α-helix positioned above Arg-76, and 53–71, consisting of part of a β-sheet and a flexible loop. D, overlay of complex C76R Pup2 (cyan with residues 76 and 204 shown in peach) and complex C76R+L204Q pup2-ts (purple with residues 76 and 204 shown in green). As an interesting example of stabilizing complementarity, when Arg-76 points outward, Gln-204 (green) can hydrogen-bond to the backbone of Gln-218 to help stabilize nonnative fluctuations in the bottom half of Pup2.

Similar articles

Cited by

References

    1. Boone C. (2014) Yeast systems biology: our best shot at modeling a cell. Genetics 198, 435–437 10.1534/genetics.114.169128 - DOI - PMC - PubMed
    1. Nurse P., and Hayles J. (2019) Using genetics to understand biology. Heredity (Edinb.) 123, 4–13 10.1038/s41437-019-0209-z - DOI - PMC - PubMed
    1. Winston F., and Koshland D. (2016) Back to the future: mutant hunts are still the way to go. Genetics 203, 1007–1010 10.1534/genetics.115.180596 - DOI - PMC - PubMed
    1. Hartwell L. H., Culotti J., and Reid B. (1970) Genetic control of the cell-division cycle in yeast. I. Detection of mutants. Proc. Natl. Acad. Sci. U. S. A. 66, 352–359 10.1073/pnas.66.2.352 - DOI - PMC - PubMed
    1. Nurse P., Thuriaux P., and Nasmyth K. (1976) Genetic control of the cell division cycle in the fission yeast Schizosaccharomyces pombe. Mol. Gen. Genet. 146, 167–178 10.1007/BF00268085 - DOI - PubMed

Publication types

MeSH terms

Substances

Associated data

LinkOut - more resources