. 2020 Sep 2;11(1):4411.
doi: 10.1038/s41467-020-18115-2.

Circadian control of brain glymphatic and lymphatic fluid flow

Affiliations

Circadian control of brain glymphatic and lymphatic fluid flow

Lauren M Hablitz et al. Nat Commun. .

Abstract

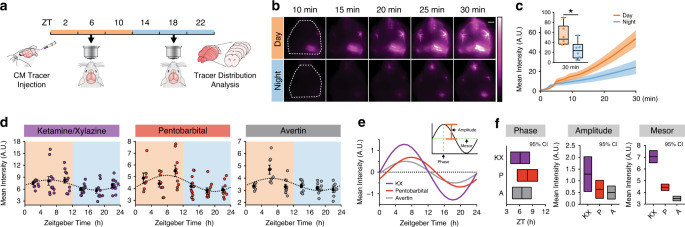
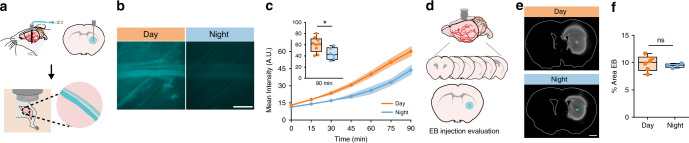
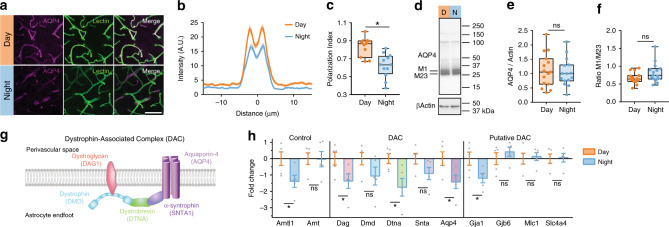
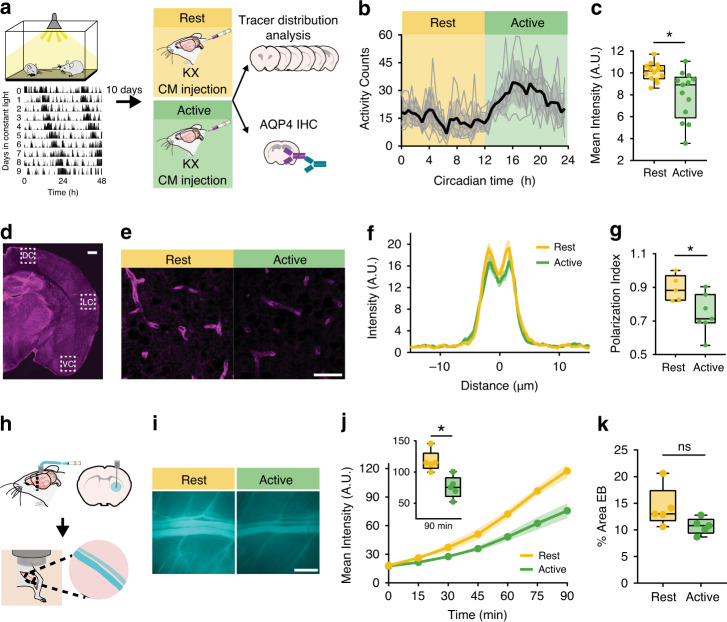
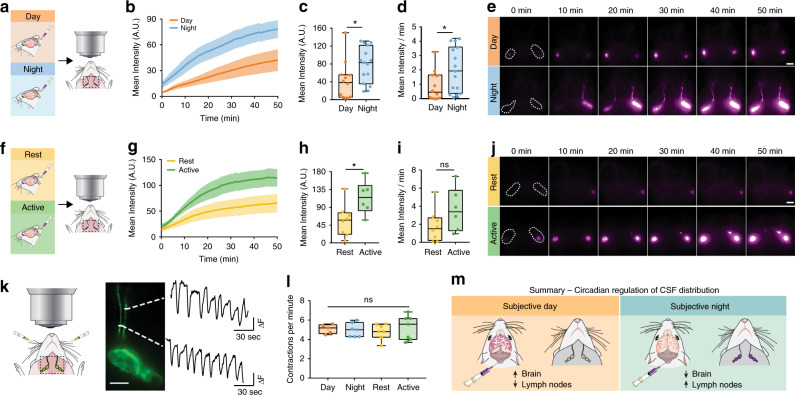
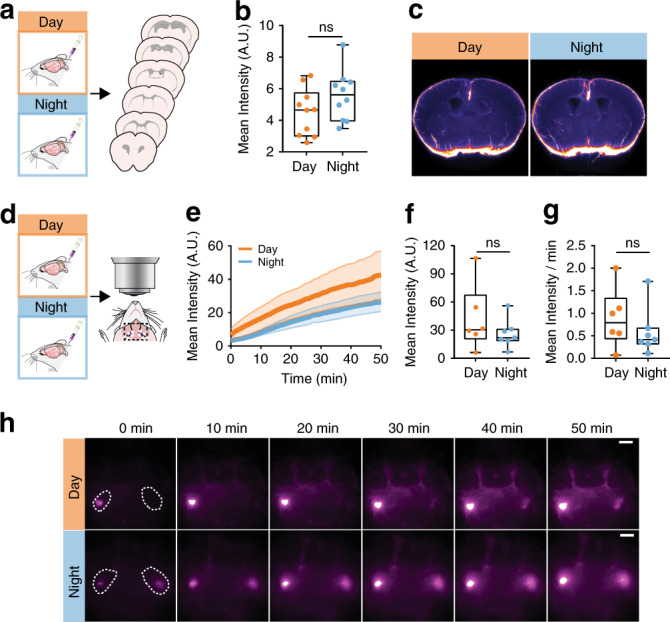
The glymphatic system is a network of perivascular spaces that promotes movement of cerebrospinal fluid (CSF) into the brain and clearance of metabolic waste. This fluid transport system is supported by the water channel aquaporin-4 (AQP4) localized to vascular endfeet of astrocytes. The glymphatic system is more effective during sleep, but whether sleep timing promotes glymphatic function remains unknown. We here show glymphatic influx and clearance exhibit endogenous, circadian rhythms peaking during the mid-rest phase of mice. Drainage of CSF from the cisterna magna to the lymph nodes exhibits daily variation opposite to glymphatic influx, suggesting distribution of CSF throughout the animal depends on time-of-day. The perivascular polarization of AQP4 is highest during the rest phase and loss of AQP4 eliminates the day-night difference in both glymphatic influx and drainage to the lymph nodes. We conclude that CSF distribution is under circadian control and that AQP4 supports this rhythm.


Conflict of interest statement

The authors declare no competing interests.

Figures

Fig. 1
Fig. 1. Glymphatic influx is higher during the day.
a Schematic of experiment. b Representative images for in vivo recordings of CSF tracer influx after injection in the CM either during the day (orange) or night (blue) under ketamine/xylazine (KX) anesthesia. Dotted white line indicates region of quantification in c. White scale bar: 2 mm. c Mean pixel intensity in arbitrary units (A.U.) over 30 min post CM injection. Thick lines indicate group means with SEM outlined in shaded regions. The inset is the magnitude of fluorescence at 30 min with boxplots, minima is minimum value, maxima is maximum value, center is median and quartiles shown by box and whiskers, individual animals represented as colored dots, two-sided t test, p = 0.0257. Time 0 is tracer infusion start. n = 6 mice per group. Asterisk indicates p < 0.05. d Time course of mean pixel intensity from ex vivo coronal sections under KX (violet, n = ZT22: 10 mice; ZT18: 11 mice; ZT2, ZT6, ZT10, and ZT14: 12 mice), pentobarbital (red, n = ZT2: 7 mice; ZT6, ZT10, and ZT22: 9 mice; ZT18: 10 mice; ZT14: 11 mice), and Avertin (gray, n = ZT22: 7 mice; ZT2 and ZT6: 8 mice; ZT14: 9 mice; ZT10 and ZT18: 10 mice). Each colored point is an animal, black points are mean ± SEM for each time bin. Dotted line indicates estimated cosinor curve. The light cycle is indicated by orange (day) and blue (night) coloring in the background. Zeitgeber Time (ZT) in hours, where ZT0 is lights on and ZT12 is lights off. e Estimated cosine curves aligned at the mesor for KX, pentobarbital (P), and avertin (A), with an inset depicting measurements from a cosine curve. f 95% confidence intervals for estimates of phase, amplitude, and mesor for each anesthetic. Midline is the model generated estimate, bars indicate 95% range around the estimate. Source data are provided as a Source Data file.
Fig. 2
Fig. 2. Interstitial fluid clearance is higher during the day.
a Schematic of experiment. b Representative Cy5 images of the femoral vein from animals 90 min after evans blue (EB) injection during the day (orange) or night (blue). White scale bar: 1 mm. c Mean pixel intensity in arbitrary units (A.U.) over 90 min post EB injection. Thick lines indicate group means with SEM shaded, individual points indicate time image was taken. The inset is a boxplot of the magnitude of fluorescence at 90 min, two-sided t test, p = 0.0256. Time 0 is tracer infusion start. Day: n = 9 mice, night: n = 6 mice. Asterisk indicates p < 0.05. d Schematic of processing brains to check injection localization and specificity. e Representative striatal EB injection sites. Blue circle indicates probe end. White scale bar: 1 mm. f Boxplot of percent area of EB quantified in a subset of brains during the day (n = 6 mice) and night (n = 4 mice). All boxplots: minima is minimum value, maxima is maximum value, center is median and quartiles shown by box and whiskers, with individual animals shown as colored dots, ns: not significant. Source data are provided as a Source Data file.
Fig. 3
Fig. 3. Diurnal variation in AQP4 protein and localization.
a Representative ×63 magnification confocal images during the day (ZT6) and night (ZT18). Purple is AQP4, green is vascular staining, white is overlap between both AQP4 and vascular staining. White scale bar: 50 µm. b Average intensity of AQP4 staining centered on vasculature in the cortex during the day (orange, for b, c: n = 11 mice, 99 vessels) and night (blue, for b, c: n = 12 mice, 108 vessels), with mean ± SEM indicated by the thick line (mean) with shading (SEM). c Average polarization index boxplot. Polarization index equals peak vascular end foot fluorescence minus 10 µm baseline. All values were normalized to the highest signal for ease of visualization. Two-sided t test, p = 0.0004. d Representative western blot for AQP4 and βActin loading control during the day (orange) and night (blue). Molecular weights are indicated to the right. M1 and M23 splice variants of AQP4 monomers are indicated on the left. e Bloxplot of mean AQP4 densitometry normalized to the loading control. For e, f: n = 15 mice per group. f Bloxplot of the ratio of M1/M23 densitometry, both normalized to loading control. g Schematic of key components of the dystrophin-associated complex. h Bar plot of day (ZT6) and night (ZT18) mRNA expression of target genes assessed by RT-qPCR means with error bars indicating SEM. Gray dots are individual mice. n = 5 mice per group. Two-sided Welch’s t tests: Arntl1, p = 0.037; Dag, p = 0.0483; Dtna, p = 0.0283; Aqp4, p = 0.038; Gja1, p = 0.045. DTNA, DMD, DAG1, AQP4, GJA1, GJB6, MLC1, and SLC4A4 are all upregulated in astrocytes at minimum two times more than any other cell type. All boxplots: minima is minimum value, maxima is maximum value, center is median and quartiles shown by box and whiskers, with individual animals shown as colored dots. Asterisk indicates p < 0.05; ns: not significant. Source data are provided as a Source Data file.
Fig. 4
Fig. 4. Differences in the glymphatic system persist in constant light.
a Experimental outline with representative double-plotted actogram of two animals in constant light (LL). Black tick marks: beam-breaks. b Average activity profile of animals housed in LL for 10 days. Black line and gray error bars: group mean ± SEM, thin gray lines: individual cage activity profiles. Yellow: rest phase, green: active phase. Circadian time (CT) 12 is activity onset. n = 7 cages, 14 mice. c Boxplot of mean intensity (arbitrary units, A.U.) from ex vivo tissue fluorescence. Mann–Whitney test: p = 0.0033, n = 13 mice rest, 14 mice active. d Representative slice of AQP4 staining. White boxes indicate areas of dorsal, lateral, and ventral cortex (DC, LC, VC, respectively) for AQP4 localization quantification. White scale bar: 500 µm. e Representative ×40 images stained for AQP4 (magenta). White scale bar: 50 µm. f Average intensity of AQP4 centered on vasculature in cortex during the rest (yellow, for e, g: n = 5 mice, 45 vessels) and active (green, for f, g: n = 7 mice, 63 vessels) phase, mean ± SEM is indicated by shading (SEM) around thick line (mean). g Boxplot of polarization index for staining in ventral, dorsal and lateral cortex. Polarization index equals peak fluorescence minus 10 µm baseline. All values normalized to the highest signal for better visualization. Two-sided t test: p = 0.0288. h Schematic of clearance experiment. i Representative Cy5 images of the femoral vein 90 min after evans blue (EB) injection during rest (yellow) or active (green) phases. White scale bar: 1 mm. j Mean intensity over time. Thick lines: group means, outlines: SEM, individual points: image acquisition. Inset: boxplot of fluorescence at 90 min. Two-sided t test: p = 0.0051. Time 0 is tracer infusion start. For j, k: n = 5 mice per group. k Boxplot of percent area EB during rest and active phases. All boxplots minima: minimum value, maxima: maximum value, center: median, and quartiles: box and whiskers, individual animals: colored dots. Asterisk indicates p < 0.05; ns: not significant. Source data are provided as a Source Data file.
Fig. 5
Fig. 5. Lymph node drainage exhibits circadian variation.
a Experimental outline. Lymph nodes in purple, black dashed square: area imaged. White dashed lines: regions of interest (ROI) around lymph nodes. b Mean intensity (arbitrary units, A.U.) of lymph node fluorescence during day (orange, for be: n = 12 mice) and night (blue, for be: n = 15 mice). Time 0 on all graphs indicate start of imaging, on average 8 min after tracer infusion start. Thick line: mean, shading: SEM. c Boxplot of lymph node intensity at minute 50. Two-sided t test, p = 0.0335. d Boxplot of the rate of lymph node filling calculated from the first 20 min recording. Mann–Whitney test, p = 0.0321. e Representative images from in vivo lymph node imaging across 50 min for day (orange) and night (blue). White scale bar: 2 mm. f Experimental outline. g Average fluorescence over time (thick line: mean, SEM: shading). h Boxplot of fluorescence in lymph nodes at 50 min, during active (green, for fj: n = 6 mice) and rest (yellow, for fj n = 8 mice) phases. Two-sided t test, p = 0.0231. i Boxplot of rate of lymph node filling. j Representative time lapse images for animals housed in constant light for 10 days. White scale bar: 2 mm. k Diagram of experiment for lymph node contraction rate after FITC-dextran cheek injection, black dashed square: imaging area (left) with representative lymph vessel and trace of contractions from two regions of interest over 2 min (right). White scale bar: 1 mm. White dotted lines: area of measurement for traces. l Boxplot of contractions per minute of lymph vessels during the day (n = 5 mice) and night (n = 7 mice) in LD, and active (n = 7 animals) and rest (n = 7 animals) after 10 days in constant light. m Summary diagram of circadian regulation of CSF distribution. All boxplots minima: minimum value, maxima: maximum value, center: median, box and whiskers: quartiles, individual animals: colored dots. Asterisk indicates p < 0.05; ns: not significant. Source data are provided as a Source Data file.
Fig. 6
Fig. 6. AQP4 KO animals lack a rhythm in glymphatic influx.
a Experimental outline for b. b Boxplot of mean pixel intensity of slices from AQP4 KO animals during the day (orange) and night (blue). n = 10 mice per group. c Population-based averaging of slice intensity in AQP4 KO animals in the day and night. d Experimental outline. e Average fluorescence over time, mean is the thick line, SEM indicated by shading. f Boxplot of fluorescence in the lymph nodes at 50 min. g Boxplot of the rate of lymph vessel filling for the first 20 min. h Time lapse imaging across 50 min in AQP4 KO mice during the day (orange, for dh: n = 6 mice) and night (blue, for dh: n = 7 mice). White scale bar: 2 mm. Time 0 on all graphs indicate start of imaging, on average 8 min after tracer infusion start. All boxplots: minima is minimum value, maxima is maximum value, center is median and quartiles shown by box and whiskers, with individual animals shown as colored dots. ns: not significant. Source data are provided as a Source Data file.

References

    1. Xie L, et al. Sleep drives metabolite clearance from the adult brain. Science. 2013;342:373–377. - PMC - PubMed
    1. Chen Z, Wilson MA. Deciphering neural codes of memory during Sleep. Trends Neurosci. 2017;40:260–275. - PMC - PubMed
    1. Nir Y, et al. Selective neuronal lapses precede human cognitive lapses following sleep deprivation. Nat. Med. 2017;23:1474–1480. - PMC - PubMed
    1. Kreutzmann JC, Havekes R, Abel T, Meerlo P. Sleep deprivation and hippocampal vulnerability: changes in neuronal plasticity, neurogenesis and cognitive function. Neuroscience. 2015;309:173–190. - PubMed
    1. Vanderheyden WM, Lim MM, Musiek ES, Gerstner JR. Alzheimer’s disease and sleep-wake disturbances: amyloid, astrocytes, and animal models. J. Neurosci. 2018;38:2901–2910. - PMC - PubMed

Publication types