. 2020 Sep 2;11(1):4301.
doi: 10.1038/s41467-020-17967-y.

Accurate quantification of copy-number aberrations and whole-genome duplications in multi-sample tumor sequencing data

Affiliations

Accurate quantification of copy-number aberrations and whole-genome duplications in multi-sample tumor sequencing data

Simone Zaccaria et al. Nat Commun. .

Abstract

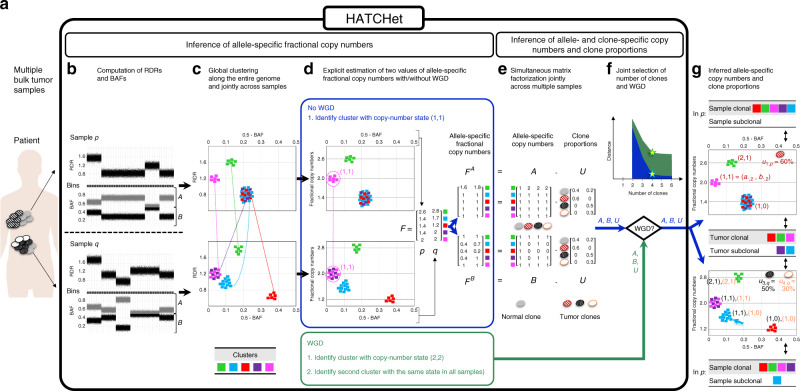
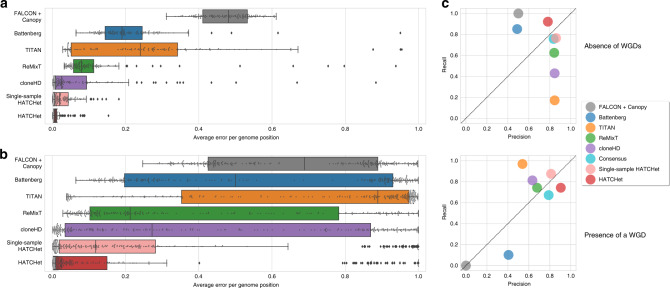
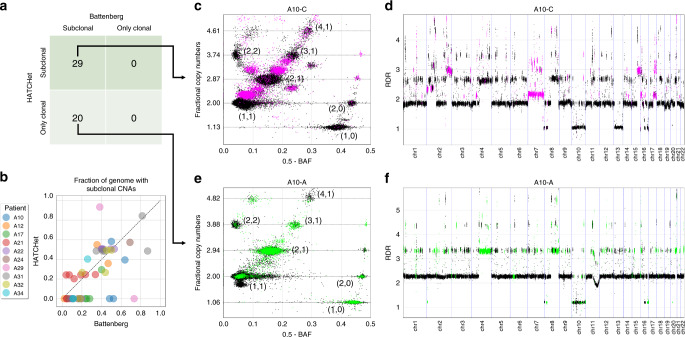
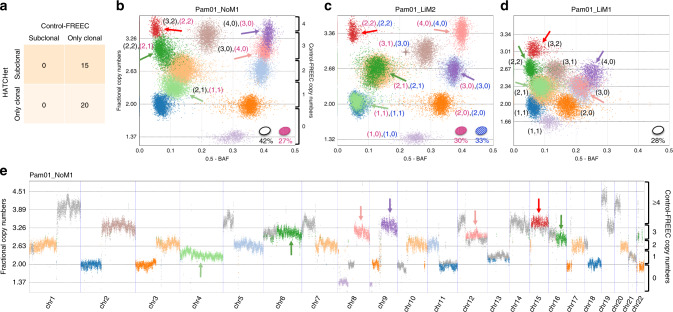
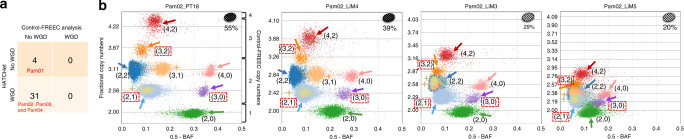
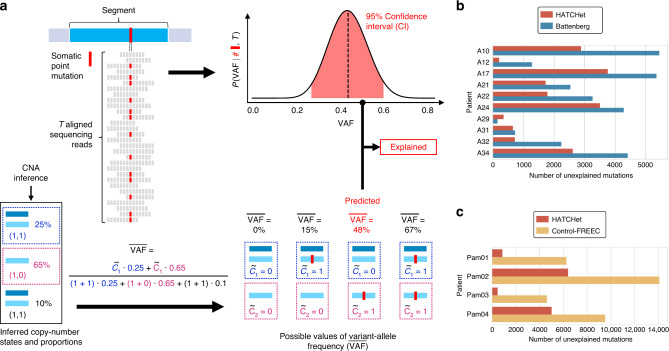
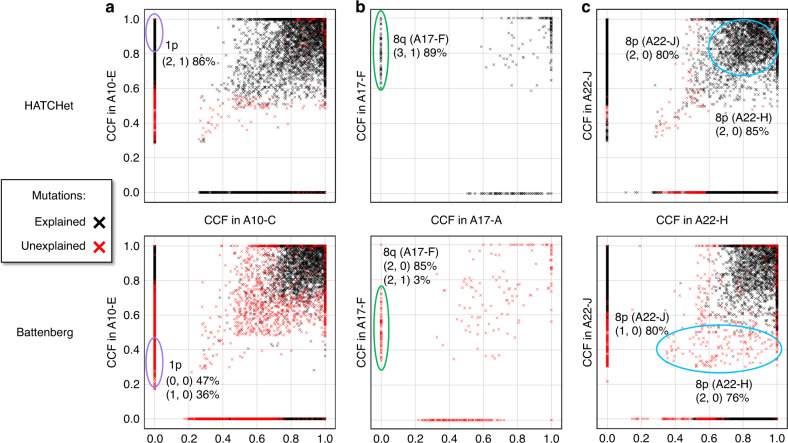
Copy-number aberrations (CNAs) and whole-genome duplications (WGDs) are frequent somatic mutations in cancer but their quantification from DNA sequencing of bulk tumor samples is challenging. Standard methods for CNA inference analyze tumor samples individually; however, DNA sequencing of multiple samples from a cancer patient has recently become more common. We introduce HATCHet (Holistic Allele-specific Tumor Copy-number Heterogeneity), an algorithm that infers allele- and clone-specific CNAs and WGDs jointly across multiple tumor samples from the same patient. We show that HATCHet outperforms current state-of-the-art methods on multi-sample DNA sequencing data that we simulate using MASCoTE (Multiple Allele-specific Simulation of Copy-number Tumor Evolution). Applying HATCHet to 84 tumor samples from 14 prostate and pancreas cancer patients, we identify subclonal CNAs and WGDs that are more plausible than previously published analyses and more consistent with somatic single-nucleotide variants (SNVs) and small indels in the same samples.


Conflict of interest statement

B.J.R. is a cofounder of, and consultant to, Medley Genomics. S.Z. declares no competing interests.

Figures

Fig. 1
Fig. 1. Overview of HATCHet algorithm.
a HATCHet takes in input DNA sequencing data from multiple bulk tumor samples of the same patient and has five steps. b First, HATCHet calculates the RDRs and BAFs in bins of the reference genome (black squares). Here, we show two tumor samples p and q. c Second, HATCHet clusters the bins based on RDRs and BAFs globally along the entire genome and jointly across samples p and q. Each cluster (color) includes bins with the same copy-number state within each clone present in p or q. d Third, HATCHet estimates two values for the fractional copy number of each cluster by scaling RDRs. If there is no WGD, the identification of the cluster (magenta) with copy-number state (1, 1) is sufficient and RDRs are scaled correspondingly. If a WGD occurs, HATCHet identifies an additional cluster with identical copy-number state in all tumor clones. Dashed black horizontal lines in the scaled BAF-RDR plot represent values of fractional copy numbers that correspond to clonal CNAs. e Fourth, HATCHet factors the allele-specific fractional copy numbers FAFB into the allele-specific copy numbers AB, respectively, and the clone proportions U. Here, there is a normal clone and 3 tumor clones. f Last, HATCHet’s model-selection criterion identifies the matrices A, B, and U in the factorization while evaluating the fit according to both the inferred number of clones and presence/absence of a WGD. g HATCHet outputs allele- and clone-specific copy numbers (with the color of the corresponding clone) and clone proportions (in the top right part of each plot) for each sample. Clusters are classified according to the inference of unique/different copy-number states in each sample (sample-clonal/subclonal) and across all tumor clones (tumor-clonal/subclonal).
Fig. 2
Fig. 2. HATCHet outperforms existing methods in the inference of CNAs, their proportions, and WGDs.
a Average allele-specific error per genome position for the copy-number states and their proportions inferred by each method (here excluding THetA which does not infer allele-specific copy numbers) on 128 simulated tumor samples from 32 patients without a WGD, and where each method was provided with the true values of the main parameters (e.g., tumor ploidy, number of clones, and maximum copy number). HATCHet outperforms all the other methods even when it considers single samples individually (single-sample HATCHet). b Average allele-specific error per genome position on 256 simulated tumor samples from 64 patients, half with a WGD, and where each method infers all relevant parameters including tumor ploidy, number of clones, etc. HATCHet outperforms all the other methods, even when considering single samples individually (single-sample HATCHet). Box plots show the median and the interquartile range (IQR), and the whiskers denote the lowest and highest values within 1.5 times the IQR from the first and third quartiles, respectively. c Average precision and recall in the prediction of the absence of a WGD and the presence of a WGD in a sample. HATCHet is the only method with high precision and recall (>75%) in both the cases, even compared to a consensus of the other methods based on a prediction for majority. While Battenberg and Canopy underestimate the presence of WGDs (<20% and 0% recall), TITAN, ReMixT, and cloneHD overestimates the absence of WGDs (<20%,  <62%, and  <50% recall).
Fig. 3
Fig. 3. HATCHet identifies moderate amount of subclonal CNAs in prostate cancer patients.
a HATCHet identifies subclonal CNAs in 29 samples, while Battenberg identifies subclonal CNAs in all 49 samples. b In the 29 samples where both methods identify subclonal CNAs, HATCHet and Battenberg infer similar fractions of the genome with subclonal CNAs (dotted diagonal), while in the other 20 samples only Battenberg retrieves relatively high fractions of subclonal CNAs. c In sample A10-C of patient A10, both HATCHet and Battenberg identify reliable subclonal CNAs that correspond to sample-subclonal clusters (magenta) with clearly intermediate positions in the scaled BAF-RDR plot (each point corresponds to 50 kb genomic bin) between those of sample-clonal clusters (black clusters with corresponding copy-number states) with clonal CNAs (dashed black lines). d The sample-subclonal clusters in c correspond to large genomic regions (magenta) with values of RDR (for 50kb genomic bins) clearly distinct from the RDR values of regions from sample-clonal clusters (black). e In sample A10-A of patient A10, Battenberg identifies extensive clusters of 50kb genomic bins with subclonal CNAs (green). However, such clusters are not clearly distinguished in the scaled BAF-RDR plot from the sample-clonal clusters (black with corresponding copy-number states). HATCHet infers only clonal CNAs in this sample. f The sample-subclonal clusters in e correspond to large genomic regions (green) with values of RDR (for 50kb genomic bins) approximately equal to the RDR values of nearby regions from sample-clonal clusters (black).
Fig. 4
Fig. 4. HATCHet identifies well-supported subclonal CNAs in metastatic pancreas cancer patients.
a HATCHet identifies subclonal CNAs in 15 of 35 samples, while published analysis used Control-FREEC and excluded subclonal CNAs. b In the lymph node metastasis sample Pam01_NoM1, HATCHet infers two distinct tumor clones (ellipses in lower right of plot with corresponding proportions) and a tumor purity of 69%. Five sample-subclonal clusters (arrows) of 50kb genomic bins occupy intermediate positions between the other sample-clonal clusters (dashed black lines) in the scaled BAF-RDR plot, and thus have distinct copy-number states in the two clones, corresponding to subclonal CNAs. Control-FREEC copy numbers are shown on the right y-axis labels. c In a second liver metastasis sample Pam01_LiM2 from the same patient, HATCHet infers two distinct tumor clones, one (red) shared with the lymph node sample Pam01_NoM1. A large sample-subclonal cluster (brown, starred) occupies an intermediate position in the scaled BAF-RDR plot and has distinct copy-number states in the two clones. In contrast, the five sample-subclonal clusters in Pam01_NoM1 (arrows) clearly overlap the sample-clonal clusters in this sample and thus correspond to clonal CNAs (dashed black lines). d In the liver metastasis sample Pam01_LiM1, HATCHet identifies a single tumor clone (white) that is shared with the lymph node metastasis sample Pam01_NoM1 in b. The five sample-subclonal clusters in Pam01_NoM1 (arrows) correspond to clonal CNAs in sample Pam01_LiM1 but have different copy-number states than those in c. The inferred low tumor purity (28%) of this sample results in a partial overlap of clusters that are clearly distinguished in higher purity samples in b and c. e The five sample-subclonal clusters in Pam01_NoM1 (arrows) correspond to large genomic regions with values of RDR that are clearly distinct from the other sample-clonal clusters (dashed black lines). Genomic regions that are part of small clusters or have out-of-scale values are reported in gray. Ranges of fractional copy numbers corresponding to the total copy numbers inferred by Control-FREEC in the previously published analysis are shown on the right y-axis labels.
Fig. 5
Fig. 5. HATCHet identifies WGDs in three of four pancreas cancer patients.
a HATCHet predicts a WGD in all 31 samples from three patients (Pam02, Pam03, and Pam04). In contrast, published analysis used Control-FREEC and excluded WGDs. b In four samples of patient Pam02, HATCHet predicts a WGD and infers two tumor clones (ellipses in upper right of plot with corresponding proportions) with seven large tumor-clonal clusters (arrows with corresponding copy-number states). These clusters preserve their relative positions in the scaled BAF-RDR plot (each point corresponds to 50kb genomic bin) across samples and their fractional copy numbers correspond to sample-clonal clusters in each sample (dashed black lines), supporting the inference of a tumor-clonal CNA (i.e,. unique copy-number state across samples) for each of these clusters. Note that without a WGD three clusters (red dashed squares) would correspond to subclonal CNAs in all samples. Two additional clusters (peach and olive, starred) are tumor-subclonal as they change their relative position across samples (Pam02_PT18 and Pam02_LiM4 vs. Pam02_LiM3 and Pam02_LiM5), supporting the inference of two distinct tumor clones in this patient. The total copy numbers inferred by Control-FREEC in published analysis are shown on the right y-axis labels in the first scaled BAF-RDR plot.
Fig. 6
Fig. 6. HATCHet infers copy-number states and proportions that better explain VAFs of somatic SNVs and small indels.
a A genomic segment (cyan rectangle) harbors a somatic mutation, which corresponds to either a somatic SNV or small indel. Reads with variant allele (red squares) and reference allele (gray squares) are used to estimate the VAF. (Top right) From T sequencing reads (gray rectangles) covering the mutation, a 95% confidence interval (CI, i.e., red area of posterior probability) on the VAF is obtained from a binomial model. (Bottom) Separately, copy-number states and proportions are inferred for this genomic segment. Given the numbers c~1,c~2 of mutated copies in each of the two copy-number states, the VAF¯ of the mutation is computed as the fraction of the mutated copies weighted by the proportions of the corresponding copy-number states. Assuming that an allele-specific position is mutated at most once during tumor progression (i.e., no homoplasy), all possible values of VAF¯ are computed according to the possible values of c~1 and c~2. A mutation is explained if at least one value of VAF¯ is within CI. b Over 10,600 mutations identified per prostate cancer patient on average, HATCHet copy numbers (red) yield fewer unexplained mutations than Battenberg (blue) in all patients but A29, where the difference is small. c Over 9,000 mutations identified per pancreas cancer patient on average, HATCHet copy numbers yield fewer unexplained mutations in all patients than Control-FREEC.
Fig. 7
Fig. 7. HATCHet copy numbers improve estimates of CCFs of somatic mutations in prostate cancer patients.
a CCFs of somatic SNVs and small indels in samples A10-C and A10-E of patient A10 computed from allele-specific copy numbers and proportions inferred by HATCHet (top) and Battenberg (bottom). HATCHet explains a substantial number of mutations that are unexplained by Battenberg; for example, HATCHet infers a clonal CNA on chromosome 1p in A10-E and determines that the mutations at this locus (purple circle) are clonal (i.e., CCF ≈ 1). In contrast, Battenberg infers subclonal CNAs at the same locus, and determines that the same mutations are subclonal (CCF ≈ 0.3). b CCFs of somatic SNVs and small indels in samples A17-A and A17-F of patient A17 show groups of mutations that are explained by HATCHet and unexplained by Battenberg (only this subset of mutations is shown here for simplicity). For example, HATCHet infers a clonal CNA on chromosome 8q in A17-F and suggests that mutations in that region (green circle) are clonal (CCF ≈ 1), while Battenberg infers subclonal CNAs and suggests that the same mutations are subclonal (CCF ≈ 0.5). c CCFs of somatic SNVs and small indels in samples A22-J and A22-H of patient A22 show a large group of shared mutations on chromosome 8p (cyan circle with CCF > 0 in both samples). HATCHet infers the same copy-number state (2, 0) in both samples, explains these mutations, and suggests that they are clonal. Battenberg infers distinct copy-number states (1, 0) and (2, 0) in the two samples, leaves these mutations unexplained, and suggests that the mutations are subclonal in both samples.

References

    1. Nowell PC. The clonal evolution of tumor cell populations. Science. 1976;194:23–28. - PubMed
    1. Ciriello G, et al. Emerging landscape of oncogenic signatures across human cancers. Nat. Genet. 2013;45:1127. - PMC - PubMed
    1. Burrell RA, McGranahan N, Bartek J, Swanton C. The causes and consequences of genetic heterogeneity in cancer evolution. Nature. 2013;501:338. - PubMed
    1. McGranahan N, Swanton C. Biological and therapeutic impact of intratumor heterogeneity in cancer evolution. Cancer Cell. 2015;27:15–26. - PubMed
    1. Zack TI, et al. Pan-cancer patterns of somatic copy number alteration. Nat. Genet. 2013;45:1134. - PMC - PubMed

Publication types