. 2020 Sep 2;10(1):14474.
doi: 10.1038/s41598-020-71329-8.

Metabolic alterations in Parkinson's disease astrocytes

Affiliations

Metabolic alterations in Parkinson's disease astrocytes

Tuuli-Maria Sonninen et al. Sci Rep. .

Abstract

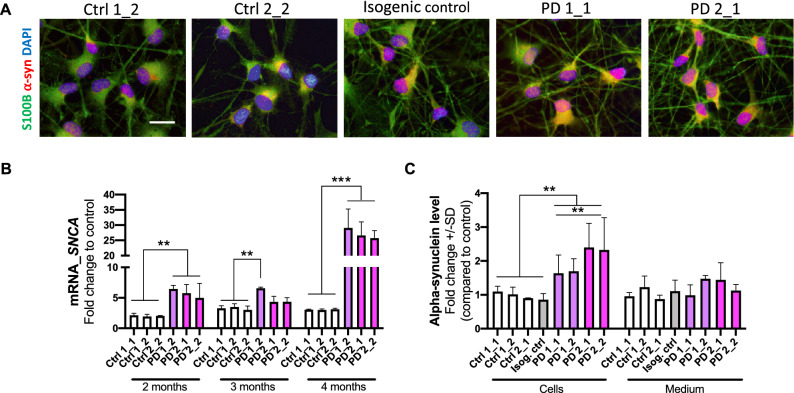
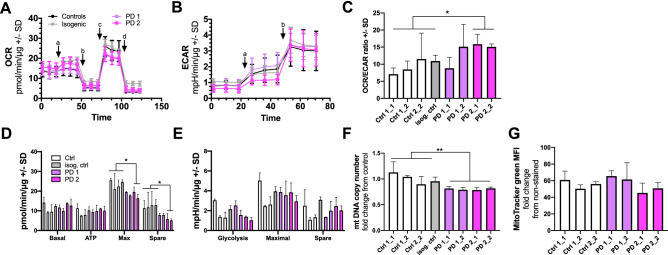
In Parkinson`s disease (PD), the loss of dopaminergic (DA) neurons in the substantia nigra pars compacta is associated with Lewy bodies arising from the accumulation of alpha-synuclein protein which leads ultimately to movement impairment. While PD has been considered a disease of the DA neurons, a glial contribution, in particular that of astrocytes, in PD pathogenesis is starting to be uncovered. Here, we report findings from astrocytes derived from induced pluripotent stem cells of LRRK2 G2019S mutant patients, with one patient also carrying a GBA N370S mutation, as well as healthy individuals. The PD patient astrocytes manifest the hallmarks of the disease pathology including increased expression of alpha-synuclein. This has detrimental consequences, resulting in altered metabolism, disturbed Ca2+ homeostasis and increased release of cytokines upon inflammatory stimulation. Furthermore, PD astroglial cells manifest increased levels of polyamines and polyamine precursors while lysophosphatidylethanolamine levels are decreased, both of these changes have been reported also in PD brain. Collectively, these data reveal an important role for astrocytes in PD pathology and highlight the potential of iPSC-derived cells in disease modeling and drug discovery.


Conflict of interest statement

The authors declare no competing interests.

Figures

Figure 1
Figure 1
Differentiation and characterization of hiPSC-derived astrocytes from healthy subjects and PD patients. (A) Representative images from astrocyte differentiation. Bright field images showing hiPSCs at day 1, the rosettes at day 16, progenitor cells expanded as spheres from day 18 onwards and matured astrocytes at day 180. (B) Representative fluorescence images of astrocytes matured for 7 days and stained for AQP4, Vimentin, GFAP and S100B. Nuclei are stained with DAPI. Scale bars, 50 µm. (C) Relative gene expression levels GFAP, SLC2A1, SLC1A3 and AQP4 in astrocytes shown as fold change from healthy control. (D) Representative FACS histogram of glucose uptake analysed by fluorescent glucose analog 2-NBDG. Grey area shows untreated cells, black line shows cells incubated with 2-NBDG and red line shows cells incubated with insulin and 2-NBDG. (E) Glucose uptake analyzed by fluorescent glucose analog 2-NBDG. (F) Glutamate uptake measured with radiolabeled glutamic acid. Three independent experiments. Bars represents mean ± SD, *p < 0.05. PD1 patient carries a mutation in LRRK2 (G2019S) and GBA (N370S), PD2 patient carries a mutation in LRRK2 (G2019S) and isogenic control for PD2 patient.
Figure 2
Figure 2
Alpha-synuclein protein expression is increased in LRRK2 mutant astrocytes. (A) Representative immunofluorescent images of astrocytes stained for α-synuclein and S100B. Nuclei stained with DAPI. Scale bar 20 µm. (B) Relative gene expression level of SNCA gene in astrocytes over 4-month period shown as fold change to healthy cells. The results are normalized to beta-actin expression. (C) Protein expression in astrocytes and the released amount of α-synuclein to media measured with ELISA. Data is shown as a fold change to control (healthy) and results are normalized to total protein content. Four independent experiments. Bars represents mean ± SD, **p < 0.01, ***p < 0.001.
Figure 3
Figure 3
PD astrocytes showed altered phenotype in pro-inflammatory conditions. Release of (A) IL-6 and (B) RANTES quantified from media after TNFα (50 ng/ml), IL-1β (10 ng/ml) and INFγ (10 ng/ml) stimulation for 24 h measured with CBA assay. Relative gene expression levels of (C) LCN2 and (D) GFAP in astrocytes treated with TNFα, IL-1β and INFγ shown as fold change from untreated healthy control. Results are presented as mean ± SD from three independent experiments, *p < 0.05, **p < 0.01, ***p < 0.001. The control lines used in the measurements (A) and (B): Ctrl 1_1, Ctrl 1_2 and Ctrl 2_2.
Figure 4
Figure 4
Disturbed calcium signaling in endoplasmic reticulum of PD astrocytes. The [Ca2+]i signals in healthy, PD and isogenic control-derived astrocytes. (A) The amplitude F/F0, rise time and decay time in seconds (66%) of Ca-responses caused by ryanodine receptors activation (stimulation with cresol) in healthy and PD astrocytes. (B) Repeated experiment with isogenic control and PD astrocytes showing that the G2019S mutation in LRRK2 is responsible for the calcium disturbances in PD astrocytes, n = 800–1,200 cells. Bars represents mean ± SEM. Relative gene expression levels of ER calcium-channels (C) RYR3 and (D) ITPR2 (inositol 1,4,5-triphosphate receptor type 2) in astrocytes shown as fold change from healthy control. Results are presented as mean ± SD from three independent experiments, *p < 0.05, **p < 0.01, ***p < 0.001.
Figure 5
Figure 5
PD astrocytes have altered metabolic profile. (A) Oxygen consumption rate (OCR) following additions of 10 μM glucose (A), 1 μM oligomycin (B), 1 μM FCCP (C), and 1 μM antimycin A and rotenone (D) in astrocytes. (B) Extracellular acidification rate (ECAR) following additions of 10 μM glucose (A) and 1 μM oligomycin (B). Results are normalized to protein content and shown as mean ± SD from three independent experiments. (C) The OCR/ECAR ratio calculated after glucose addition. (D) Calculated OCR values of basal respiration, ATP production, maximal respiration, and spare respiratory capacity. (E) Calculated ECAR values of glycolysis, maximal glycolysis, and spare glycolytic capacity. (F) mtDNA copy number measured from astrocytes. Results are shown as relative fold change to healthy cells. (G) MitoTracker green Mean Fluorescence Intesity (MFI) per cell, representing mitochondrial mass. Bars represents mean ± SD, *p < 0.05, **p < 0.01. The order of lines in (D) and (E) is the same as in (C).
Figure 6
Figure 6
Non-targeted metabolite profiling of astrocytes revelaled several statistically significantly differentiating compounds in cell lysates (A) and media (B) of healthy and PD astrocytes analyzed by UHPLC-QTOF-MS. Bars represents mean ± SD, *p < 0.05, **p < 0.01, ***p < 0.001. LysoPE lysophosphatidylethanolamine, LysoPC lysophosphatidylcholine.
Figure 7
Figure 7
PD patients astrocytes manifest several hallmarks of the disease, these include: (1) increased production of alpha-synuclein, (2) increased reactivity upon inflammatory stimulation, (3) increased astrocytic Ca2+ levels, (4) mtDNA maintenance defects and (5) metabolomic changes.

References

    1. GBD 2016 Parkinson’s Disease Collaborators Global, regional, and national burden of Parkinson’s disease, 1990–2016: a systematic analysis for the Global Burden of Disease Study 2016. Lancet Neurol. 2018;17:939–953. - PMC - PubMed
    1. Rocha EM, De Miranda B, Sanders LH. Alpha-synuclein: pathology, mitochondrial dysfunction and neuroinflammation in Parkinson’s disease. Neurobiol. Dis. 2018;109:249–257. - PubMed
    1. Fymat, A. L. Parkinson’s Disease and other Movement Disorders: A Review. 28 (2017).
    1. Klein C, Westenberger A. Genetics of Parkinson’s disease. Cold Spring Harb. Perspect. Med. 2012;2:a008888. - PMC - PubMed
    1. Nguyen HN, et al. LRRK2 mutant iPSC-derived DA neurons demonstrate increased susceptibility to oxidative stress. Cell Stem Cell. 2011;8:267–280. - PMC - PubMed

Publication types

MeSH terms