

Chemical composition of material extractives influences microbial growth and dynamics on wetted wood materials
- PMID: 32879425
- PMCID: PMC7467922
- DOI: 10.1038/s41598-020-71560-3
Chemical composition of material extractives influences microbial growth and dynamics on wetted wood materials
Abstract
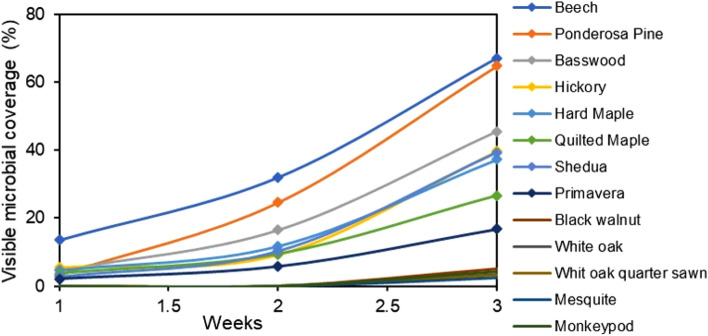
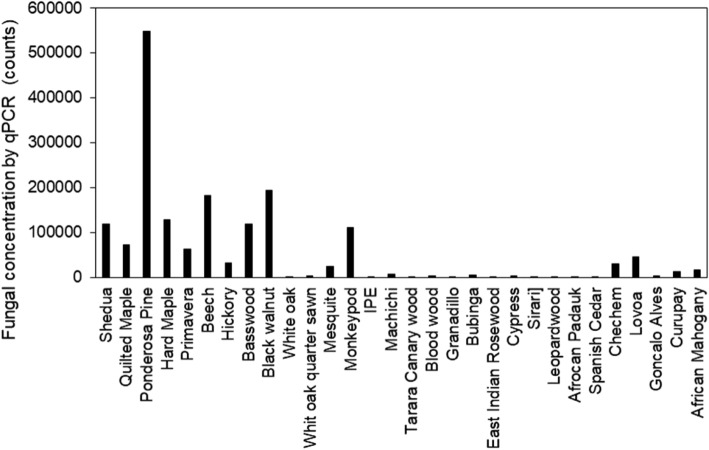
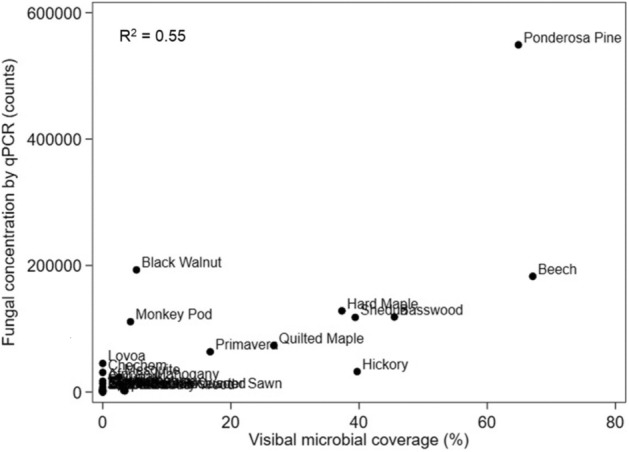
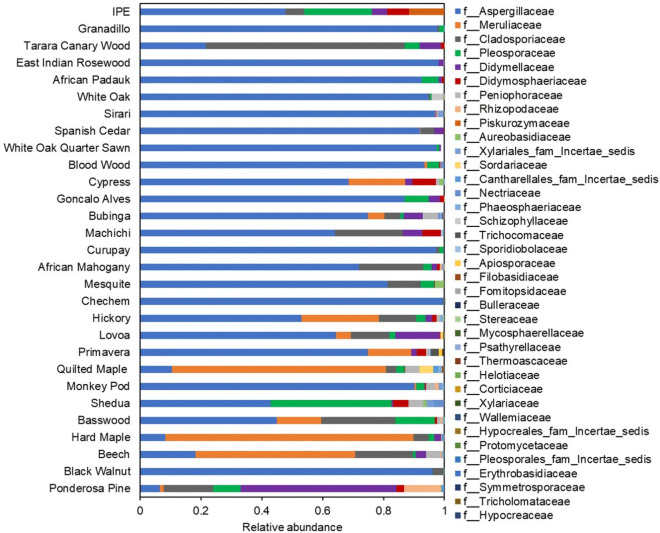
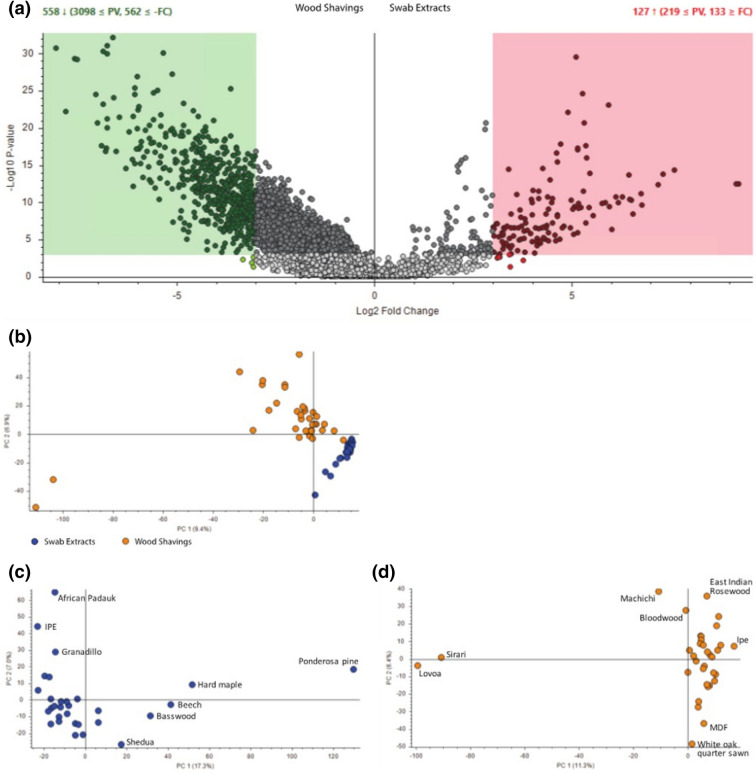
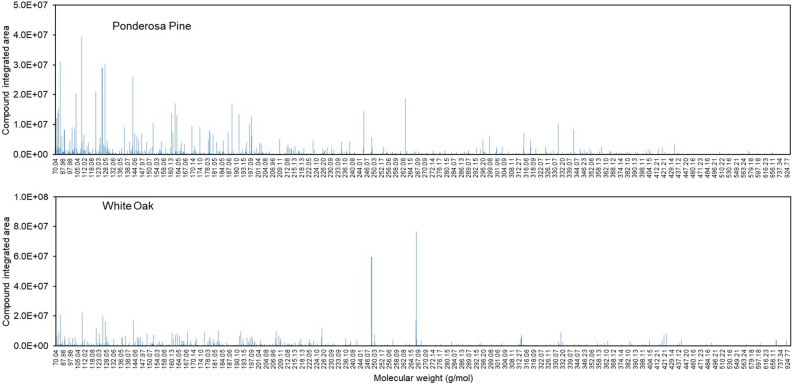
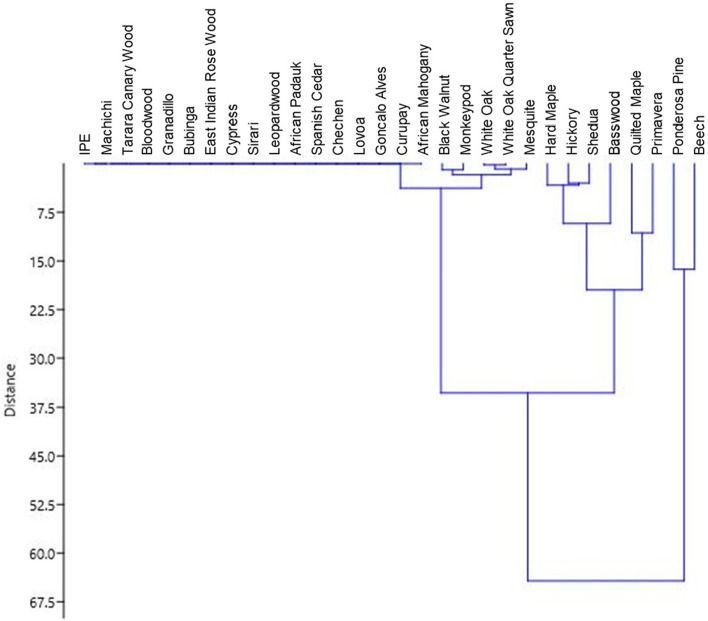
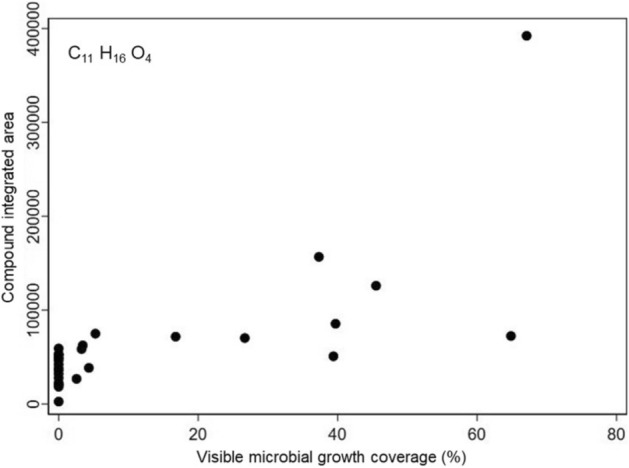
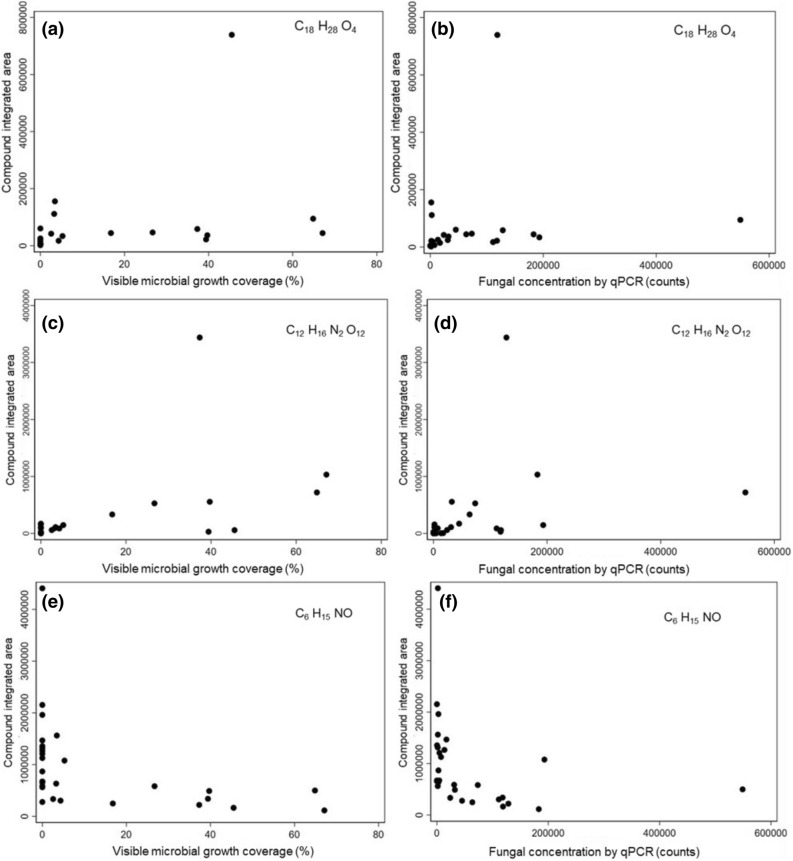
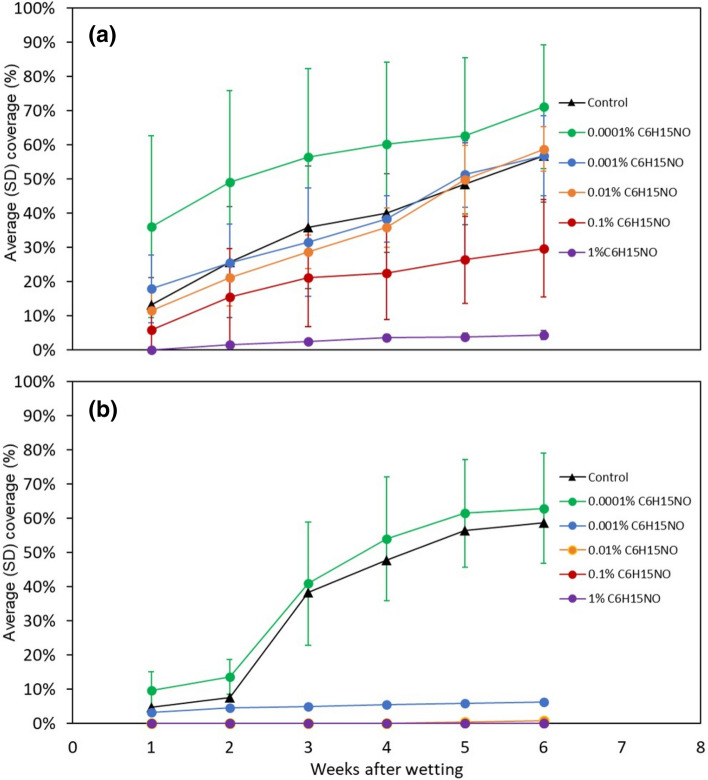
The impact of material chemical composition on microbial growth on building materials remains relatively poorly understood. We investigate the influence of the chemical composition of material extractives on microbial growth and community dynamics on 30 different wood species that were naturally inoculated, wetted, and held at high humidity for several weeks. Microbial growth was assessed by visual assessment and molecular sequencing. Unwetted material powders and microbial swab samples were analyzed using reverse phase liquid chromatography with tandem mass spectrometry. Different wood species demonstrated varying susceptibility to microbial growth after 3 weeks and visible coverage and fungal qPCR concentrations were correlated (R2 = 0.55). Aspergillaceae was most abundant across all samples; Meruliaceae was more prevalent on 8 materials with the highest visible microbial growth. A larger and more diverse set of compounds was detected from the wood shavings compared to the microbial swabs, indicating a complex and heterogeneous chemical composition within wood types. Several individual compounds putatively identified in wood samples showed statistically significant, near-monotonic associations with microbial growth, including C11H16O4, C18H34O4, and C6H15NO. A pilot experiment confirmed the inhibitory effects of dosing a sample of wood materials with varying concentrations of liquid C6H15NO (assuming it presented as Diethylethanolamine).
Conflict of interest statement
The authors declare no competing interests.
Figures

Similar articles
-
Indoor microbiota in severely moisture damaged homes and the impact of interventions.Microbiome. 2017 Oct 13;5(1):138. doi: 10.1186/s40168-017-0356-5. Microbiome. 2017. PMID: 29029638 Free PMC article.
-
The relationship between measured moisture conditions and fungal concentrations in water-damaged building materials.Indoor Air. 2000 Jun;10(2):111-20. doi: 10.1034/j.1600-0668.2000.010002111.x. Indoor Air. 2000. PMID: 11980100
-
Molecular profiling of fungal communities in moisture damaged buildings before and after remediation--a comparison of culture-dependent and culture-independent methods.BMC Microbiol. 2011 Oct 21;11:235. doi: 10.1186/1471-2180-11-235. BMC Microbiol. 2011. PMID: 22017920 Free PMC article.
-
Moisture parameters and fungal communities associated with gypsum drywall in buildings.Microbiome. 2015 Dec 8;3:71. doi: 10.1186/s40168-015-0137-y. Microbiome. 2015. PMID: 26642923 Free PMC article. Review.
-
Critical Review on the Use of Extractives of Naturally Durable Woods as Natural Wood Protectants.Insects. 2024 Jan 18;15(1):69. doi: 10.3390/insects15010069. Insects. 2024. PMID: 38249075 Free PMC article. Review.
Cited by
-
Damp Buildings: Associated Fungi and How to Find Them.J Fungi (Basel). 2024 Jan 27;10(2):108. doi: 10.3390/jof10020108. J Fungi (Basel). 2024. PMID: 38392780 Free PMC article. Review.
-
The molecular impact of life in an indoor environment.Sci Adv. 2022 Jun 24;8(25):eabn8016. doi: 10.1126/sciadv.abn8016. Epub 2022 Jun 24. Sci Adv. 2022. PMID: 35749501 Free PMC article.
