. 2020 Sep;585(7825):420-425.
doi: 10.1038/s41586-020-2683-0. Epub 2020 Sep 2.

Violet-light suppression of thermogenesis by opsin 5 hypothalamic neurons

Affiliations

Violet-light suppression of thermogenesis by opsin 5 hypothalamic neurons

Kevin X Zhang et al. Nature. 2020 Sep.

Abstract

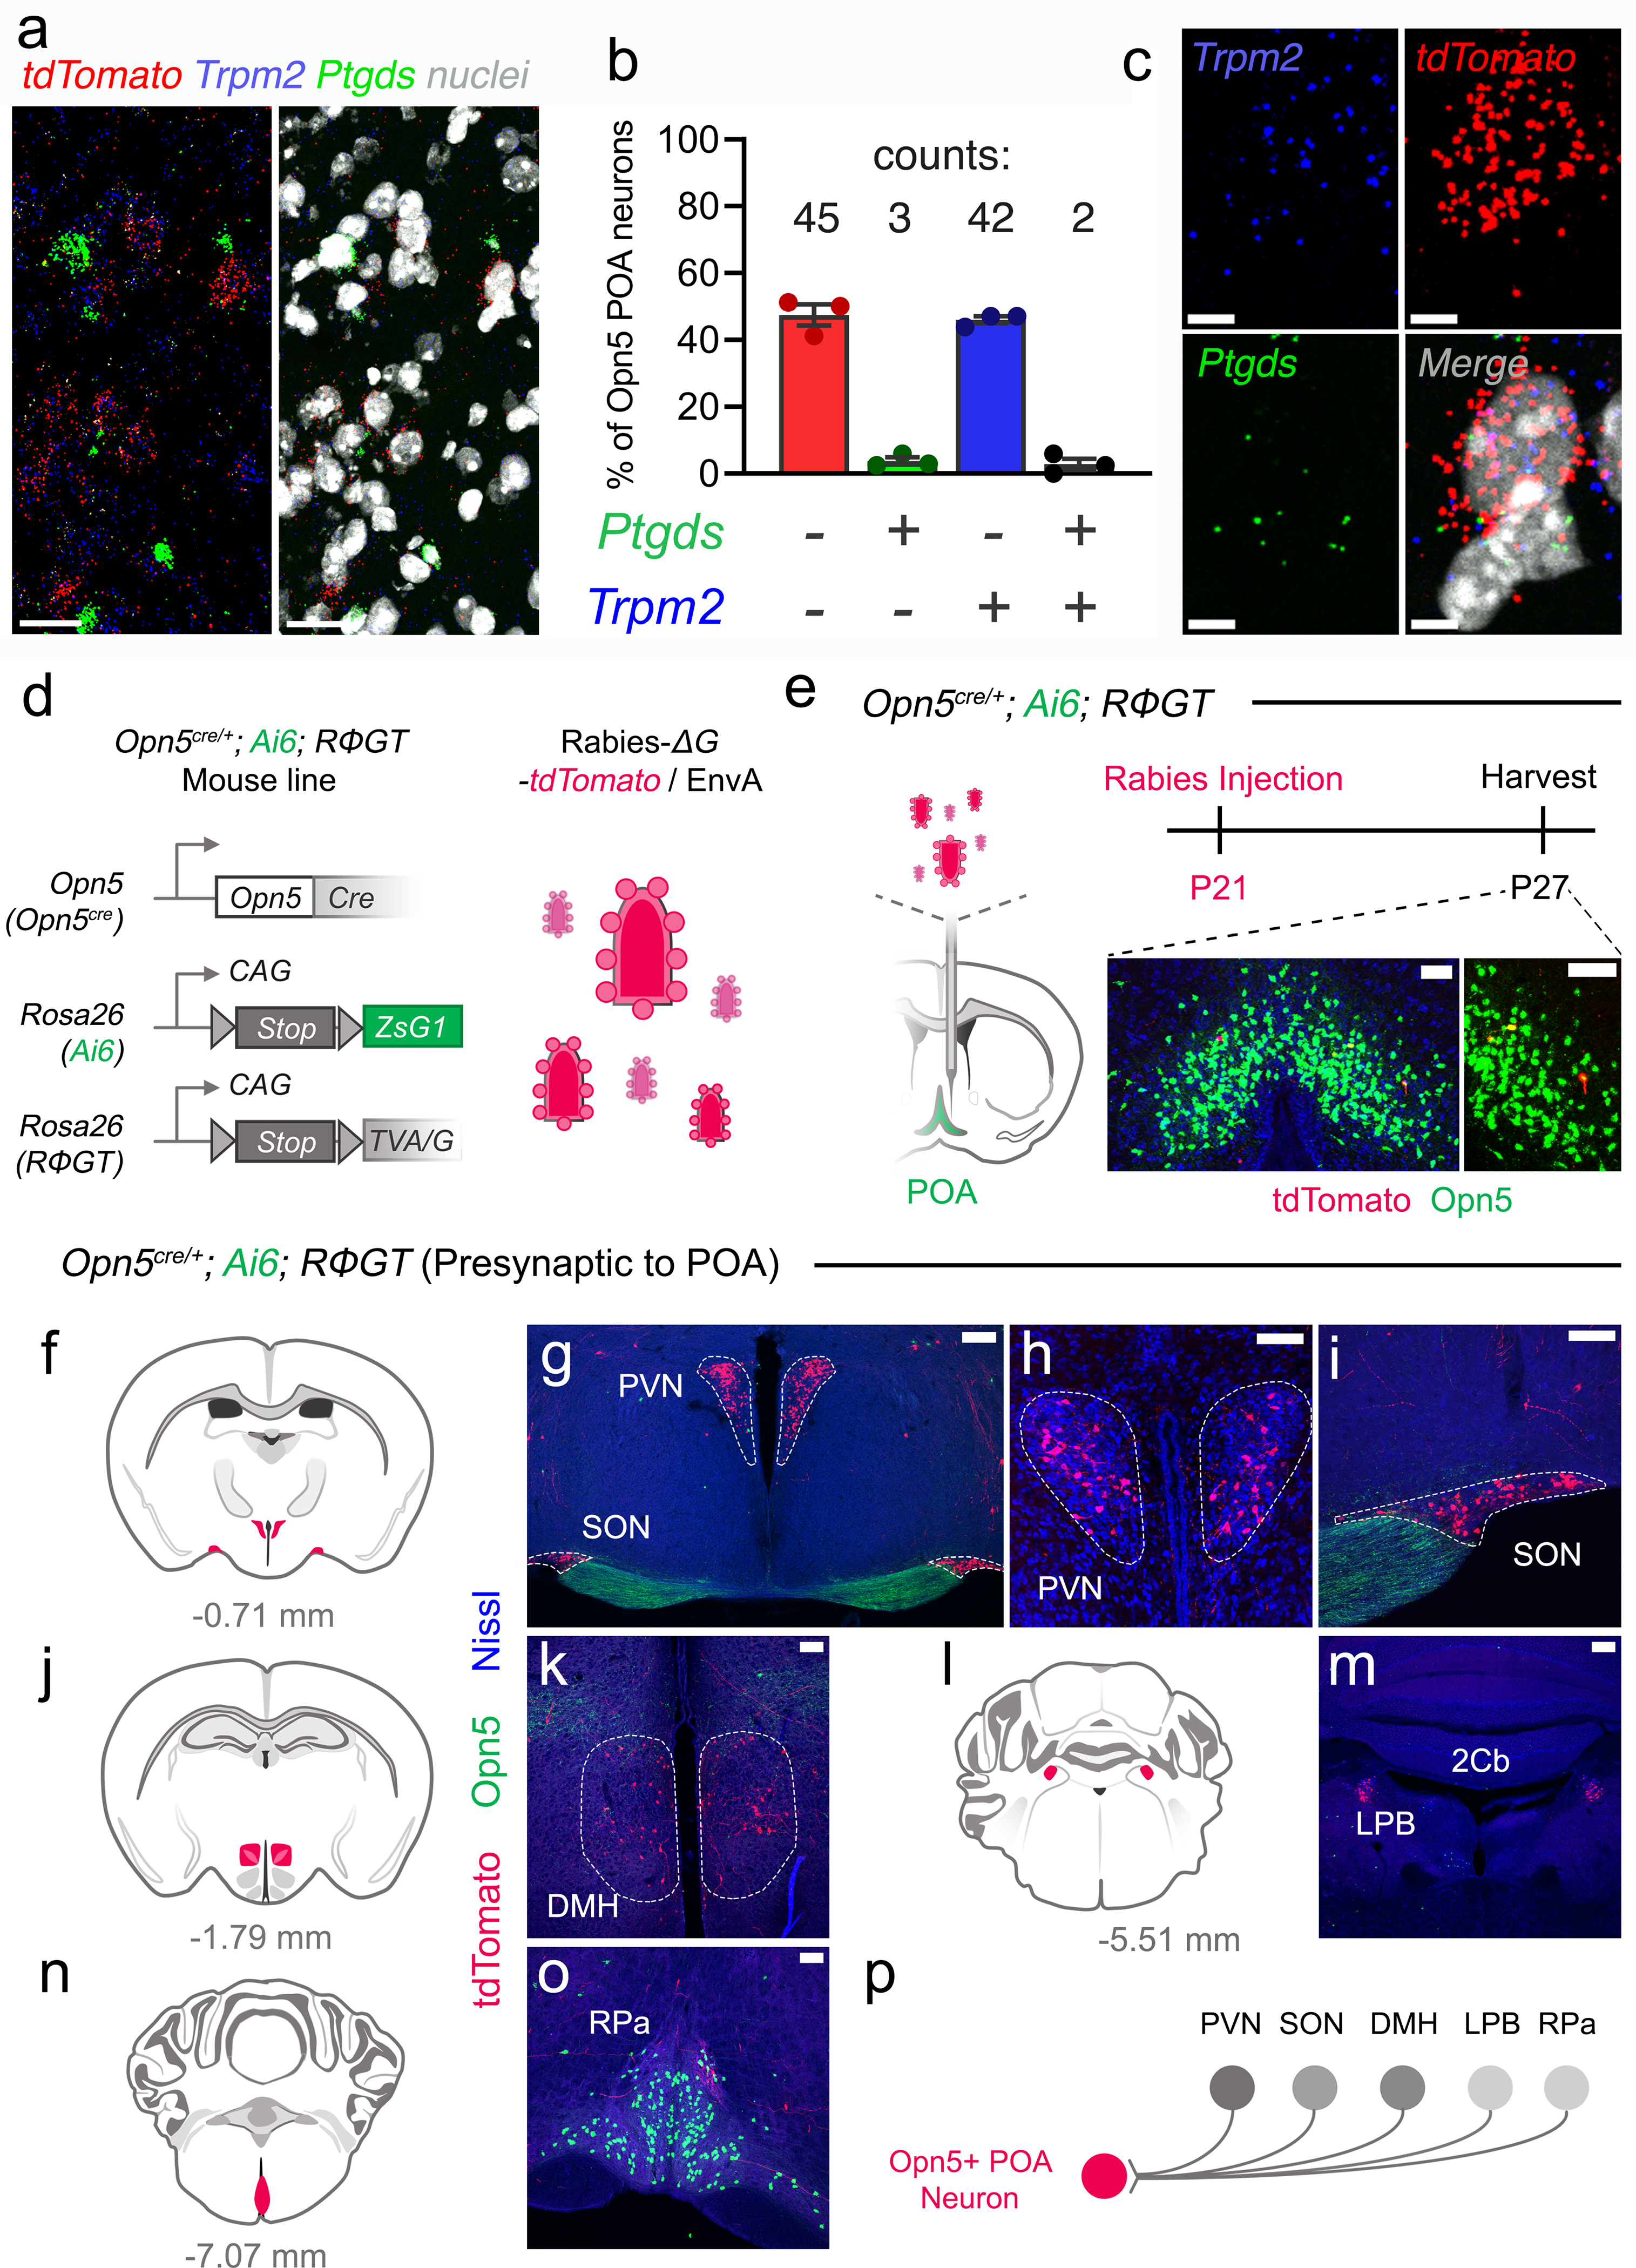
The opsin family of G-protein-coupled receptors are used as light detectors in animals. Opsin 5 (also known as neuropsin or OPN5) is a highly conserved opsin that is sensitive to visible violet light1,2. In mice, OPN5 is a known photoreceptor in the retina3 and skin4 but is also expressed in the hypothalamic preoptic area (POA)5. Here we describe a light-sensing pathway in which POA neurons that express Opn5 regulate thermogenesis in brown adipose tissue (BAT). We show that Opn5 is expressed in glutamatergic warm-sensing POA neurons that receive synaptic input from several thermoregulatory nuclei. We further show that Opn5 POA neurons project to BAT and decrease its activity under chemogenetic stimulation. Opn5-null mice show overactive BAT, increased body temperature, and exaggerated thermogenesis when cold-challenged. Moreover, violet photostimulation during cold exposure acutely suppresses BAT temperature in wild-type mice but not in Opn5-null mice. Direct measurements of intracellular cAMP ex vivo show that Opn5 POA neurons increase cAMP when stimulated with violet light. This analysis thus identifies a violet light-sensitive deep brain photoreceptor that normally suppresses BAT thermogenesis.


Figures

Extended Data Fig. 1 |
Extended Data Fig. 1 |. Opn5 lineage survey across the CNS and thermogenic organs.
a-c, Brain atlas representation (a) and coronal brain sections (b, c) of P21 Opn5cre/+; Ai14 mouse highlighting tdTomato expression (red) in the raphe pallidus (RPa). d, Coronal brain section from P10 Opn5lacZ/+ mouse showing that the RPa is negative for Xgal labeling. e-k, Representative confocal images from IB4 labeled (green) P35 Opn5cre/+; Ai14 (expressing tdTomato, red) tissues across the organism. (e) Interscapular brown adipose tissue (iBAT), (f) perigonadal white adipose tissue (pgWAT), (g) thyroid gland, (h) liver, (i) cardiac muscle, (j) adrenal glands, and (k) pancreas. Scale bars, 100 μm (e-k), 150 μm (c, d), 500 μm (b).
Extended Data Fig. 2 |
Extended Data Fig. 2 |. M-FISH of Opn5 POA neurons against Ptgds and Trpm2.
a, Representative images of Opn5cre/+; Ai14 POA neurons probed for Ptgds (green), tdTomato (red), Trpm2 (blue) and labeled with DAPI for nuclei (greyscale) with corresponding quantification (b) of overlap (n=3 animals; 92 cells). c, Representative images of Opn5cre/+; Ai14 cells (red) also positive for Trpm2 (blue) but Ptgds labeling (green) that is below the background labeling threshold. Scale bars, 5 μm (c), 25 μm (a). Data in b are mean ± s.e.m.
Extended Data Fig. 3 |
Extended Data Fig. 3 |. Thermoregulation by Opn5 POA neurons is not context-dependent.
a, b, QPCR of thermogenesis genes in iBAT 6h post-CNO induction in mice with viral-mediated expression of stimulatory hM3D(Gq) DREADD (a) or inhibitory hM4D(Gi) DREADD (b) in the POA. (a) Opn5+/+ (n=5), Opn5cre/+ (n=5), and Opn5cre/- (n=8). (b) Opn5+/+ (n=6), Opn5cre/+ (n=5), and Opn5cre/- (n=4). p values are indicated above the bars. c-f, Similar to Figure 2, Opn5cre/- POA were injected with AAV5-hM3D(Gq) DREADD (c, e; n=8 animals per condition) or AAV5-hM4D(Gi) DREADD (d, f; n=6 animals per condition). Telemetric BAT and core recordings following intraperitoneal administration of CNO or vehicle (open arrowheads) at the 2 hour mark. g-l, Opn5+/+, Opn5cre/+, Opn5cre/- (n=6 per genotype and condition) mice were injected with AAV5-hM4D(Gi) DREADD, and followed by chemogenetic manipulations as previously described, but at 4°C ambient temperature. All data are mean ± s.e.m. p values are from (a, b) ANOVA with Tukey post-hoc analysis, (c-l) 1-way repeated measures ANOVA.
Extended Data Fig. 4 |
Extended Data Fig. 4 |. Opn5 loss-of-function exaggerates BAT thermogenesis.
a, Immunohistochemistry for UCP1 protein in iBAT from Opn5+/+ and Opn5−/− mice. b, UCP1 immunoblots for iBAT comparing ambient temperature (22°C) and 72 hour 4°C exposure for Opn5+/+ (n=3) and Opn5−/− (n=3) mice. c-e, Representative IF of TH+ (tyrosine hydroxylase) innervation of iBAT (c) used for quantification in (d, e). f, Core temperature assessment (rectal) of Opn5+/+ and Opn5−/− mice during 3h cold exposure. g, QPCR of thermogenesis genes (Ucp1, Pgc1α, Prdm16, Cidea) in iBAT from mice in (f). h, i, 48h assessment of body temperature rhythms in Opn5+/+ (n=3 animals) and Opn5−/− (n=3 animals) mice using telemetry sensors in iBAT (h) and core (i) under 12L:12D lighting conditions. j, k, Infrared thermography of P8 (j) and P90 (k) Opn5+/+ and Opn5−/− mice following 30 min cold challenge. l, m, Quantification of thermographic images focused on interscapular region (l), and tail (m). n, Representative POA images from Opn5cre/+; Ai14 and Leprcre/+; Ai14 animals, plus Leprcre/+; Ai14 colocalization with Opn5lacZ/+ expression (Xgal). o, Quantification of overlap in (n). p, Core temperature assessment (rectal) of control (Opn5fl/fl) and Leprcre; Opn5fl/fl mice during 3h cold challenge. q, QPCR of thermogenesis genes in iBAT from mice in (p). r, Immunohistochemistry for UCP1 protein in iBAT from Opn5fl/fl and Leprcre; Opn5fl/fl mice. s, UCP1 immunoblots for iBAT comparing ambient temperature (22°C) and 72 hour 4°C exposure for Opn5fl/fl (n=3) and Leprcre; Opn5fl/fl (n=3) mice. t-v, Representative IF of TH+ innervation of iBAT (t) used for quantification in (u, v). Scale bars, 50 μm (a, c, r, t), 100 μm (n). Data are mean ± s.e.m. p values are from (d, f, h, i, l, m, p, u) 1-way repeated measures ANOVA, (g, q) ANOVA with Tukey post-hoc analysis, (e, v) two-tailed Student’s t-test.
Extended Data Fig. 5 |
Extended Data Fig. 5 |. Opn5 null mice have altered energy homeostasis.
a, Body mass, body composition (lean mass/fat mass), and fat mass as a percentage of body mass (fat mass %) comparison between Opn5+/+ (n=10) and Opn5−/− (n=12) animals. b, Schematic describing ambient temperature changes throughout experiment and the duration of measurement intervals. c, Indirect calorimetry (TSE Systems, PhenoMaster® Cages) measurements of energy expenditure in adult Opn5+/+ (gray trace, n=15) and Opn5−/− (blue trace, n=9) animals at ambient temperatures of 22°C, 16°C, 10°C, and 28°C. d, Mass-energy relationships of data in (c) represented as generalized linear models. e, Respiratory exchange ratio (RER=VCO2/VO2) obtained from the same animals. f, Spontaneous locomotor activity (XY) monitoring was performed via infrared beam breaks. g, 24h average food consumption from Opn5+/+ (gray bars, n=11) and Opn5−/− (blue bars, n=7) animals at each ambient temperature. Mice exhibiting ‘food grinding’ behavior were excluded from the analysis. h, 24h average water consumption from Opn5+/+ (gray bars, n=14) and Opn5−/− (blue bars, n=9) animals at each temperature. p values are from (a) two-tailed Student’s t-tests, (c, e, f) 1-way repeated measures ANOVA across 6h time interval, (d) two-way ANCOVA with body mass as covariate, and (g, h) ANOVA with Holm-Sîdak corrected multiple comparisons. Data in (c, e, f) show a 24h period of mean ± s.e.m. data for both genotypes during lights on (6AM – 6PM, yellow shaded region) followed by lights off (6PM – 6AM, gray shaded region). Data in (a, g, h) are represented as mean ± s.e.m.
Extended Data Fig. 6 |
Extended Data Fig. 6 |. OPN5 regulates thermogenesis and lipid metabolism, but not thyroid and cardiovascular activity.
a-d, Serum lipid quantifications from male (n=13 Opn5+/+, n=12 Opn5−/−) and female (n=8 Opn5+/+, n=5 Opn5−/−) mice for triglycerides (a), phospholipids (b), cholesterol (c), and non-esterified fatty acids (NEFA) (d). e, Serum thyroxine (T4) from male Opn5+/+ (n=11) and Opn5−/− (n=9) mice. f, Serum thyrotropin-releasing hormone (TRH) from male Opn5+/+ (n=12) and Opn5−/− (n=11) mice. g, Adipose depot weight (mg) comparison between male Opn5+/+ (n=14) and Opn5−/− (n=8) mice. iAT, interscapular adipose tissue; inWAT, inguinal white adipose tissue; pgWAT, perigonadal white adipose tissue. h, Representative images highlighting inWAT cell size (H&E) and iWAT UCP1 (IHC) from Opn5+/+ and Opn5−/− animals. Scale bars, 50 μm. i, Quantification of inWAT cell size for Opn5+/+ (n=4) and Opn5−/− (n=5) mice. j, Schematic representation of mouse blood pressure recording system. Animals are movement-restricted in a mouse restraint and the tail is fitted proximally with an occlusion cuff and distally with a volume pressure recording (VPR) cuff. k, Example trial from tail blood pressure recording. Data are represented as line graphs for occlusion cuff pressure (mmHg; left y-axis) and VPR cuff pressure (mmHg; right y-axis). l, Quantification of blood pressure (SBP, systolic blood pressure; DBP, diastolic blood pressure), mean arterial pressure (MAP), and pulse rate (bpm) from Opn5+/+ (n=10–11) and Opn5−/− (n=12–13) mice. m, Indirect calorimetry and locomotion from Opn5+/+ (n=6, gray trace) and Opn5−/− (n=6, blue trace) mice treated with 1.0 mg/kg β3 adrenergic receptor agonist CL-316,243 (solid line) or vehicle control (saline, dotted line). Intraperitoneal injection of agonist or saline was performed at the 1 hour time point (indicated by arrow). All data are mean ± s.e.m. p values are from (a-g, l) two-tailed Student’s t-test, (i, m) 1-way repeated measures ANOVA.
Extended Data Fig. 7 |
Extended Data Fig. 7 |. Overlap of Lepr and Opn5 expression is limited to the POA.
a-g, Lepr-lineage and Opn5 expression survey across multiple tissues (n=3 mice). Representative images of tdTomato (Leprcre; Ai14) and Xgal (Opn5lacZ/+) domains from the DMH (a), arcuate nucleus (ARC) (b), choroid plexus (c), cerebellum (d), raphe pallidus (e), retina (f), and ear skin (g). Scale bars, 100 μm (a-e), 50 μm (f, g).
Extended Data Fig. 8 |
Extended Data Fig. 8 |. Violet light does not change locomotor behavior in cold exposed mice.
a, Photograph of experimental setup in 4°C. b, Average speed in cm/s of 2-month-old male Opn5+/+ (gray trace; n=6) and Opn5−/− (blue trace; n=6) animals binned in 5 minute intervals. Violet 380 nm LEDs were switched on after 80 minutes (1:20 mark). c, Cumulative distance in meters traveled by Opn5+/+ (n=6) and Opn5−/− (n=6) animals before and after violet supplementation, along with total cumulative distance. d, Total cumulative distance plotted across time. e, Absolute speed in cm/s of a representative pair (n=1 Opn5+/+ and n=1 Opn5−/−) of animals. f, g, Representative mouse locomotion trace (centroid-based motion tracking) of the Opn5+/+ (f) and Opn5−/− (g) mouse from (e). h, i, Selective locomotion traces in 30 minute bins ranging from 0:50 – 1:20, 1:20 – 1:50, and 1:50 – 2:20, for the Opn5+/+ (h) and Opn5−/− (i) experimental pair of animals from (e). p values are from (b, d) 1-way repeated measures ANOVA, and (log p value graphs from b and d), (c) two-tailed Student’s t-test. Data in (b-d) are represented as mean ± s.e.m.
Extended Data Fig. 9 |
Extended Data Fig. 9 |. Violet light deprivation alters BAT innervation and sensitivity to SNS input.
a, Lighting protocol used to generate ‘full spectrum’ and ‘minus violet’ mice. b, Spectral quality of lighting used in ‘full spectrum’ (top) and ‘minus violet’ (bottom) housing. Colored boxes indicate wavelength bounds used to estimate flux (photons cm−2s−1). c, UCP1 IHC of ‘full spectrum’ (top) and ‘minus violet’ (bottom) mice. d, Immunoblots of UCP1 at baseline (22°C) and following 72 hour cold adaptation (72h 4°C) between ‘full spectrum’ (n=3) and ‘minus violet’ (n=3) mice. e-g, Representative images (e) of TH+ (tyrosine hydroxylase) innervation of BAT used for quantification represented in (f) and (g). h, Core temperature assessment (rectal) of ‘full spectrum’ and ‘minus violet’ mice during a 3h cold challenge. i, QPCR of thermogenesis genes (Ucp1, Pgc1α, Prdm16, Cidea) in iBAT from the mice used in (h). j, Adipose depot weight (mg) comparison between ‘full spectrum’ (n=5) and ‘minus violet’ (n=5) mice. iAT, interscapular adipose tissue; inWAT, inguinal white adipose tissue; pgWAT, perigonadal white adipose tissue. k, Representative images highlighting inWAT cell size (H&E) and iWAT UCP1 (IHC). l, Quantification of inWAT cell size H&E images for ‘full spectrum’ (n=4) and ‘minus violet’ (n=4) groups. m, Indirect calorimetry from ‘full spectrum’ (n=6, gray trace) and ‘minus violet’ (n=6, purple trace) mice treated with 1.0 mg/kg β3 adrenergic receptor agonist CL-316,243 (solid line) or vehicle (saline, dotted line). Administration of agonist or saline was performed at the 1 hour time point (indicated by arrow). Data are mean ± s.e.m. p values are from (f, h, l, m) 1-way repeated measures ANOVA, (i) ANOVA with Tukey post-hoc analysis, and (g, j) two-tailed Student’s t-test. Scale bars, 50 μm (c), (e), and (k).
Extended Data Fig. 10 |
Extended Data Fig. 10 |. Measurement of photon flux within the POA.
a, Schematic of experimental setup for measuring intra-cranial flux as described in Methods. b, Holt-Sweeney microprobe (scale bar, 100 μm) consisting of a pulled optic fiber with an attached transparent spherical diffusing tip. c, Measurement depths and probe path within cranium. d, Absolute photon flux within mouse cranium with OPN5 action spectrum superimposed (adapted from with data points from). Upper blue trace represents surface flux and, at the λmax of OPN5, is about 3.4 × 10¹³ photons cm−2s-1. At the maximum 4.0 mm depth (gray trace), the flux at the λmax of OPN5 is approximately 9.5 × 10¹⁰ photons cm−2s-1. e, Relative photon flux normalized to surface measurements. Each trace is expressed as mean ± s.e.m. from n=3 mice.
Fig. 1 |
Fig. 1 |. Opn5 is expressed in a population of hypothalamic POA neurons that receive input from thermoregulatory nuclei.
a, b, Coronal brain section (P21 Opn5cre/+; Ai14) showing Opn5 (tdTomato, red) restricted to the preoptic area (POA). Nissl labeling is blue. Red labeling in optic tracts (OT) are axons from Opn5 retinal ganglion cells. c, d, Xgal labeling (P10 Opn5lacZ/+) in (c) whole brain, ventral view and (d) coronal section through POA. e, M-FISH (see Methods) region schematic and low magnification images of nuclear (DAPI, greyscale) and three-colour probe labeling. f, g, Representative images of POA neurons (f) probed for tdTomato (Opn5cre; Ai14, red), Slc32a1 (Vgat, green), and Slc17a6 (Vglut2, blue) with (g) quantification of overlap (n=3, 109 cells). h, Representative tdTomato+ cell from (f). i, j, As in (f, g) but for tdTomato (Opn5cre; Ai14, red), Bdnf (green), and Adcyap1 (encoding PACAP, blue) with (j) quantification (n=3; 92 cells). k, Representative tdTomato+ cell from (i). l, Schematic of the mouse genetics used for rabies viral tracing. m, Experimental timeline for POA-tracing, and primary infected neurons (yellow). n-w, Traced neurons (red) located in the paraventricular nucleus; PVN (o, p), supraoptic nucleus; SON (o, q), dorsomedial hypothalamus; DMH (r, s), lateral parabrachial; LBP (t, u), and raphe pallidus; RPa (v, w). Green regions in (o, q) are optic tracts with axons from Opn5 retinal ganglion cells. x, Schematic representation of nuclei presynaptic to Opn5 POA neurons. Scale bars, 5 μm (h, k), 20 μm (f, i), 75 μm (e, m), 100 μm (b, p, q, s, w), 200 μm (o, u), 1 mm (a). 2Cb, lobule 2 of cerebellar vermis. Data in g, i are mean ± s.e.m.
Fig. 2 |
Fig. 2 |. Opn5 POA neurons regulate BAT thermogenesis.
a, Pseudorabies virus (PRV-mRFP1) injection into the BAT of P60 Opn5cre/+; Ai6 mice. b-i, Representative images of PRV-infected (red) regions including the intermediolateral nucleus (IML) of the spinal cord (b), RPa (c), DMH (d), PVN (e), nucleus tractus solitarius (NST) (f), lateral hypothalamic area (LHA) (g), and Opn5; Ai6 (green) POA neurons (h, i). j, Schematic of DREADD virus delivery into the POA of Opn5cre/+ or Opn5+/+ animals. k, l, IF showing AAV-infected POA neurons in Opn5cre/+ (k) and lack thereof in Opn5+/+ (l). m, Experimental timeline. n-u, Chemogenetic manipulation of Opn5 POA neurons. CNO or vehicle (saline) injected at hour 2 (open arrowhead). CNO-mediated activation of Opn5 POA neurons with Gq DREADD decreases BAT and core temperature in Opn5cre/+ animals (n, o) but not in Opn5+/+ controls (p, q). CNO-mediated inhibition of Opn5 POA neurons with Gi DREADD increases BAT and core temperature in Opn5cre/+ animals (r, s) but not in controls (t, u). Scale bars, 100 μm. Data in n-u are mean ± s.e.m. All p values represent 1-way repeated measures ANOVA.
Fig. 3 |
Fig. 3 |. Violet light acutely suppresses BAT thermogenesis.
a-d, BAT and core telemetry recordings during 5 hour 4°C exposure with lighting wavelength modulation. All mice received 480 nm and 660 nm light exposure (see Methods). At the 3 hour mark (dotted line), Opn5+/+ or Opn5−/− animals were either supplemented with 380 nm light (a, b) or remained in 480 nm + 660 nm (c, d). BAT and core temperature trajectories during light modulation (hours 3–5) were calculated via linear regression and the rate of temperature change reported as °C/h. e, Core temperature assessment (rectal) of Opn5fl/fl and Rxcre; Opn5fl/fl mice during 3h cold challenge in 380 nm + 480 nm + 660 nm lighting. f, g, Core temperature assessment in enucleated Opn5+/+ (n=4) and Opn5−/− (n=5) mice under 480 nm + 660 nm illumination (f) or supplemented with 380 nm violet light (g) at hour 3 (dotted line). Dotted trace in (g) represents wild-type average trace from (f). h, iBAT QPCR of thermogenesis genes (Ucp1, Pgc1α, Prdm16, Cidea) following 5h cold exposure in mice from (g). Data are mean ± s.e.m. p values are from (a-d) 1-way ANCOVA with time as covariate, (e-g) 1-way repeated measures ANOVA, (h) ANOVA with Tukey post-hoc analysis.
Fig 4. |
Fig 4. |. Opn5 POA neurons respond to violet light ex vivo.
a, Schematic depicting two-photon assessment of cAMP biosensor FRET activity in POA slices from Opn5cre; CAMPER mice. b, CFP, YFP, and FRET images (expressed as ΔF=CFP/YFP ratio). c, Time course ΔF images following response to forskolin (FK, 20 μM) and IBMX (200 μM) (top row) or digitonin (10 μg/mL) (bottom row). d, e, Individual traces from FK + IBMX (d, n=15 cells) or digitonin (e, n=6 cells) treated slices. f, Experimental timeline for testing violet responses of Opn5 neurons in POA slices as described in Methods. g, Relative ΔF plots for Opn5cre/+ (gray trace, n=4) and Opn5cre/- (blue trace, n=4) animals. h, Percent of cells responding to violet light (average relative ΔF > 1.1 between t=15 and t=45) for both groups. i, j, Individual traces from each biological replicate (n=6–8 cells per animal, 4 animals per genotype) from experiments in (g). k, Peak ΔF from dark, violet stimulation, and drug phases between Opn5cre/+ and Opn5cre/- animals. Data in g, h, k are presented as mean ± s.e.m. p values are from (g) 1-way repeated measures ANOVA, (h, k) two-tailed Student’s t-test. Scale bars, 10 μm (c), 100 μm (b).

Comment in

References

    1. Tarttelin EE, Bellingham J, Hankins MW, Foster RG & Lucas RJ Neuropsin (Opn5): A novel opsin identified in mammalian neural tissue. FEBS Lett. 554, 410–416 (2003). - PubMed
    1. Kojima D et al. UV-sensitive photoreceptor protein OPN5 in humans and mice. PLoS One 6, e26388 (2011). - PMC - PubMed
    1. Buhr ED et al. Neuropsin (OPN5)-mediated photoentrainment of local circadian oscillators in mammalian retina and cornea. Proc. Natl. Acad. Sci. U. S. A 112, 13093–13098 (2015). - PMC - PubMed
    1. Buhr ED, Vemaraju S, Diaz N, Lang RA & Van Gelder RN Neuropsin (OPN5) Mediates Local Light-Dependent Induction of Circadian Clock Genes and Circadian Photoentrainment in Exposed Murine Skin. Curr. Biol 29, 3478–3487.e4 (2019). - PMC - PubMed
    1. Yamashita T et al. Evolution of mammalian Opn5 as a specialized UV-absorbing pigment by a single amino acid mutation. J. Biol. Chem 289, 3991–4000 (2014). - PMC - PubMed

Publication types

MeSH terms