. 2020 Oct;586(7831):735-740.
doi: 10.1038/s41586-020-2681-2. Epub 2020 Sep 2.

The innate immunity protein IFITM3 modulates γ-secretase in Alzheimer's disease

Affiliations

The innate immunity protein IFITM3 modulates γ-secretase in Alzheimer's disease

Ji-Yeun Hur et al. Nature. 2020 Oct.

Abstract

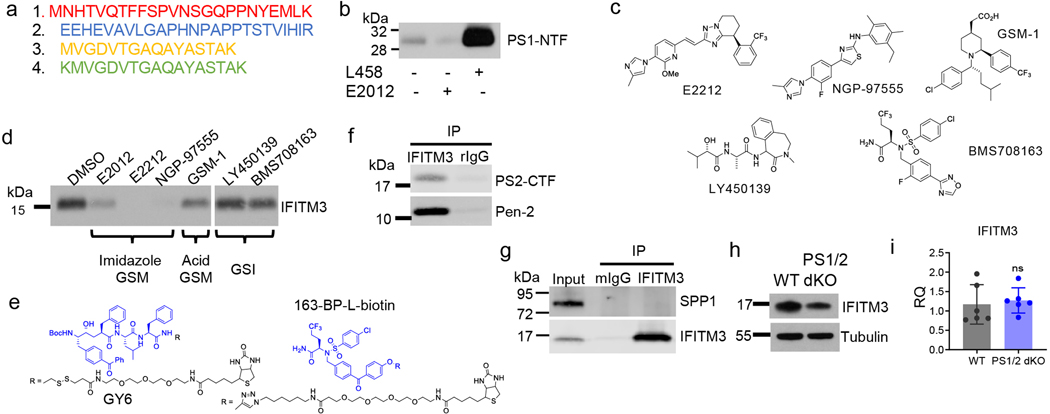
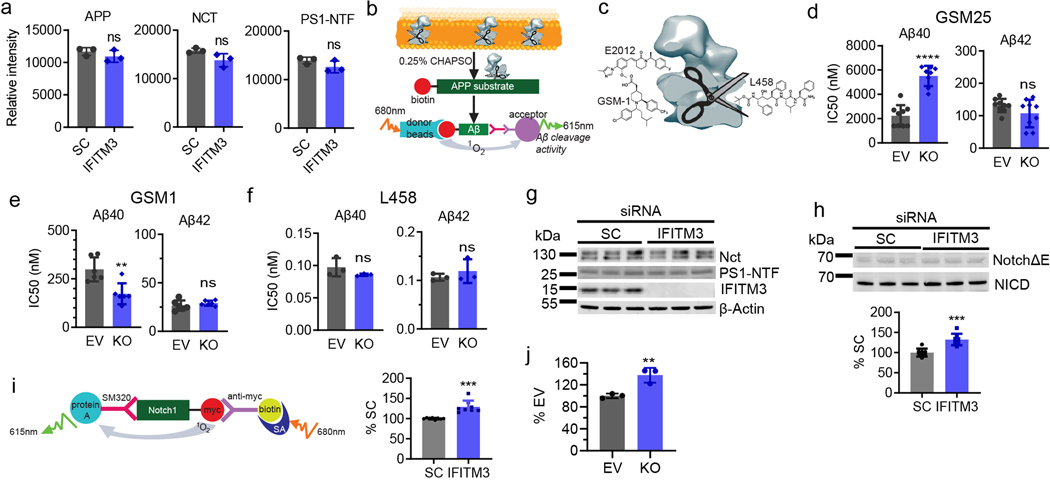
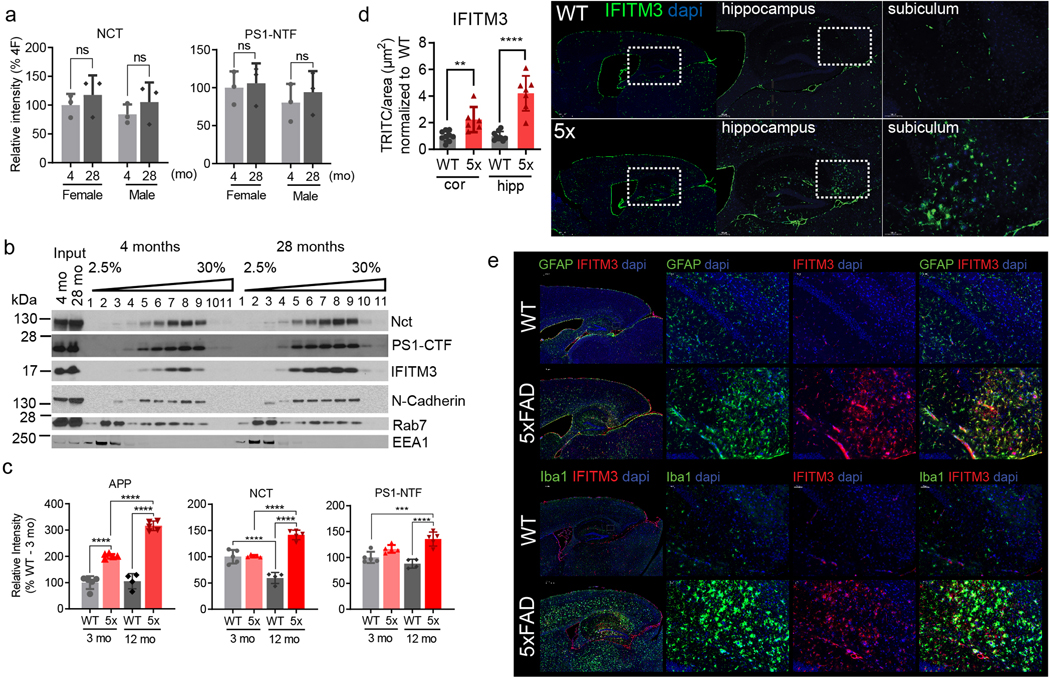
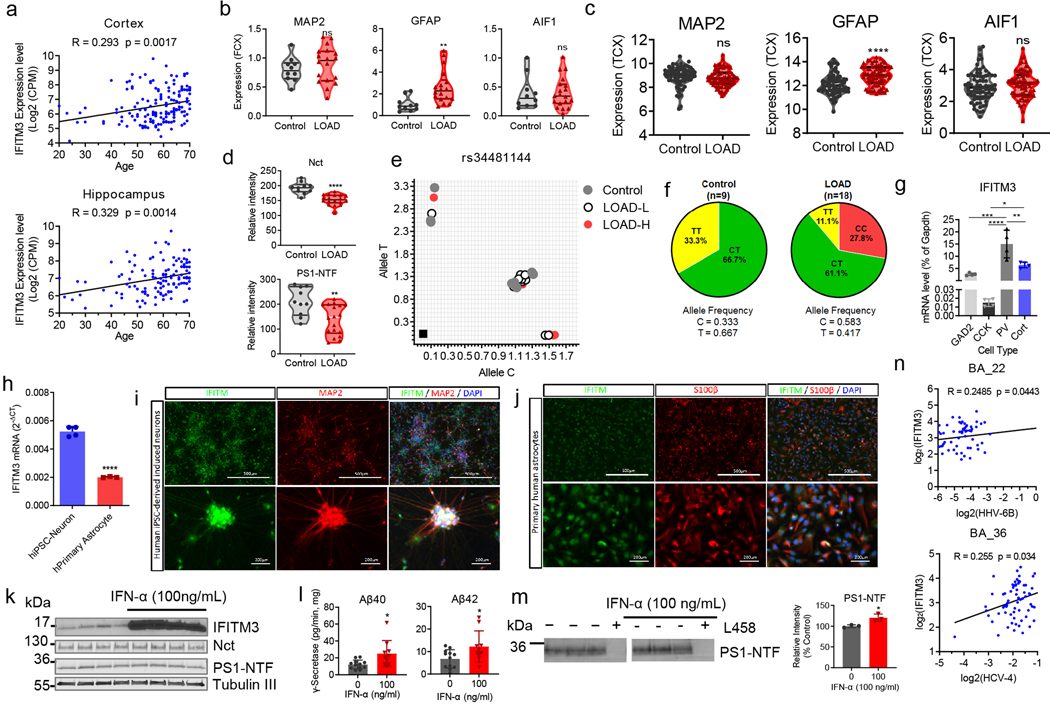
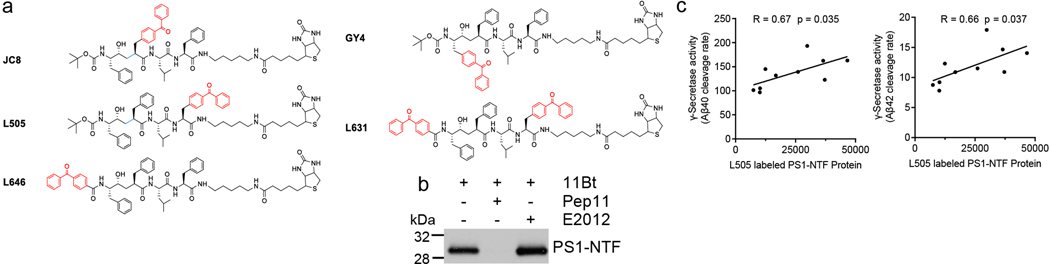
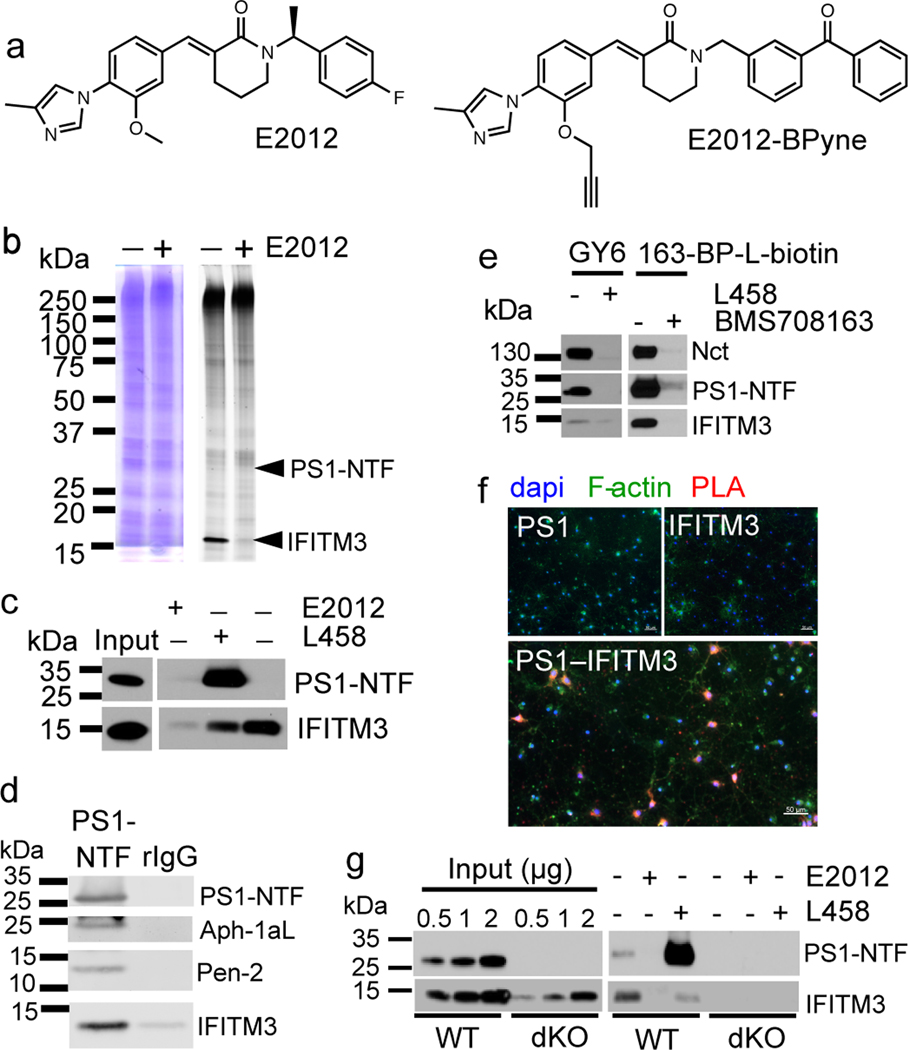
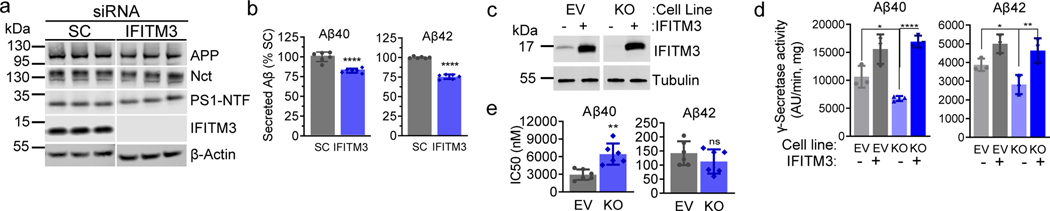
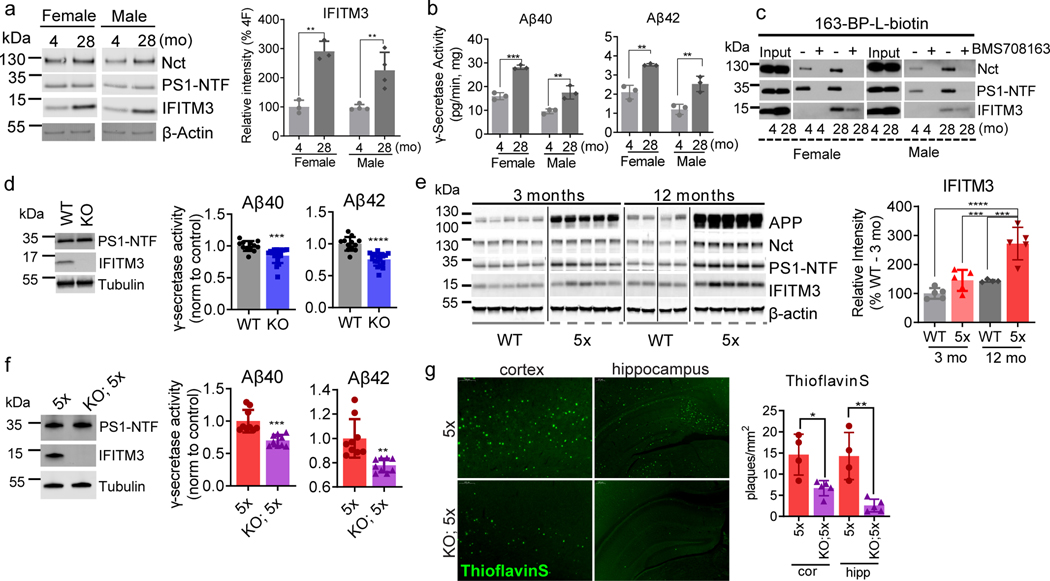
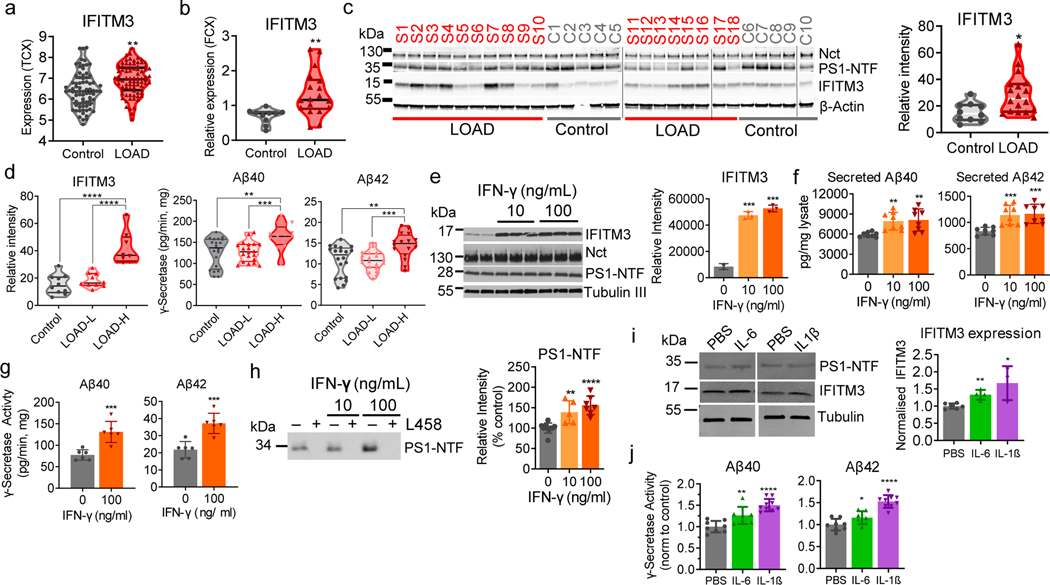
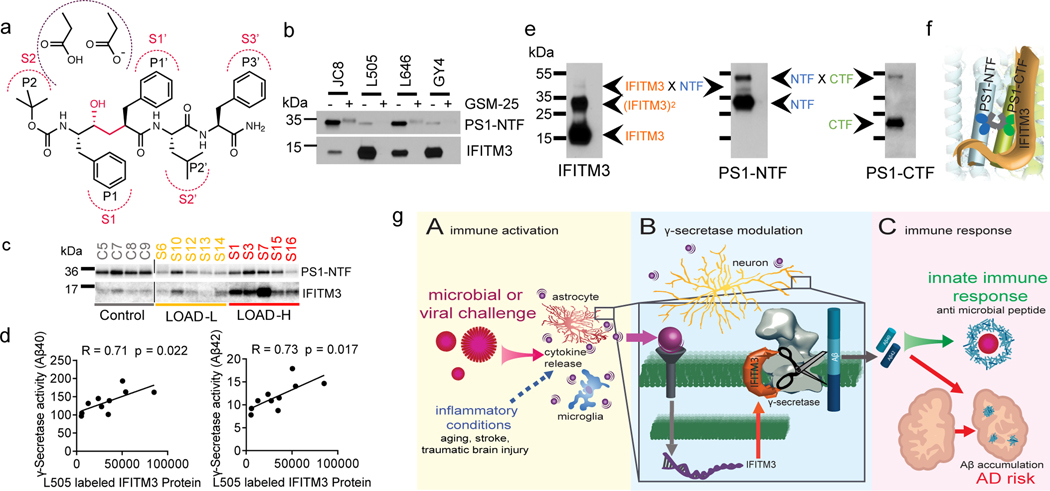
Innate immunity is associated with Alzheimer's disease1, but the influence of immune activation on the production of amyloid-β is unknown2,3. Here we identify interferon-induced transmembrane protein 3 (IFITM3) as a γ-secretase modulatory protein, and establish a mechanism by which inflammation affects the generation of amyloid-β. Inflammatory cytokines induce the expression of IFITM3 in neurons and astrocytes, which binds to γ-secretase and upregulates its activity, thereby increasing the production of amyloid-β. The expression of IFITM3 is increased with ageing and in mouse models that express familial Alzheimer's disease genes. Furthermore, knockout of IFITM3 reduces γ-secretase activity and the formation of amyloid plaques in a transgenic mouse model (5xFAD) of early amyloid deposition. IFITM3 protein is upregulated in tissue samples from a subset of patients with late-onset Alzheimer's disease that exhibit higher γ-secretase activity. The amount of IFITM3 in the γ-secretase complex has a strong and positive correlation with γ-secretase activity in samples from patients with late-onset Alzheimer's disease. These findings reveal a mechanism in which γ-secretase is modulated by neuroinflammation via IFITM3 and the risk of Alzheimer's disease is thereby increased.


Conflict of interest statement

COI

LYM is co-inventor of intellectual property (assay for gamma secretase activity and screening method for gamma secretase inhibitors) owned by MSKCC and licensed to Jiangsu Continental Medical Development.

Figures

Extended Data Figure 1.
Extended Data Figure 1.. Identification of IFITM3 as γ-secretase binding protein.
(a) LC-MS/MS analysis of the 15 kDa band identified four peptides that match with human IFITM3. (b) WB analysis of E2012-BPyne (500 nM) labeled PS1-NTF protein. (c) Structures of imidazole GSMs, acid GSM and GSIs. (d) WB analysis of E2012-BPyne labeled proteins in the absence or presence of imidazole GSMs, acid GSM and GSIs. Labeled proteins were captured and analyzed by WB for IFITM3. (e) Structures of GY6 and 163-BP-L-biotin. (f) IFITM3 co-immunoprecipitates with γ-secretase subunits. CHAPSO solubilized cell membranes were immunoprecipitated with anti-IFITM3 antibody and probed with antibodies against PS2-CTF and Pen-2. Rabbit IgG was used as a negative control. (g) IFITM3 does not co-immunoprecipitate with SPP. CHAPSO solubilized cell membranes were immunoprecipitated with a monoclonal anti-IFITM3 antibody (9D11) and probed with antibodies against SPP and IFITM3. Mouse IgG was used as a negative control. (h) Analysis of the total protein level in WT MEF or PS1/2 double KO MEF cells. The same amount of membrane proteins was loaded and analyzed by Western blotting. (i) IFITM3 mRNA expression levels were measured by RT-PCR in WT MEF or PS1/2 double KO MEF cells (n=6). All WB images and graphs are representative of three independent experiments (except; a/d: 2 replicates). Graphs are mean ± SD. ns, not significant, two-sided Student’s t-test.
Extended Data Figure 2.
Extended Data Figure 2.. Effect of IFITM3 knockdown and knockout on γ-secretase.
(a) Quantification of WB (Fig. 2a) showed that IFITM3 KD did not change protein expression levels of APP, Nct and PS1-NTF in HEK-APPWT cells (n=3). (b) Schematic representation of cell-free γ-secretase assay. γ-Secretase is incubated with a recombinant APP substrate in the presence of 0.25% CHAPSO. Cleaved Aβ40 and 42 species are measured with cleavage specific antibodies and AlphaLISA technology. (c) Schematic model showing different GSM and GSI binding sites in γ-secretase: E2012 (imidazole GSM), GSM-1 (acid GSM), and L458 (transition state analogue inhibitor, GSI). (d-f) Comparison of IC50 of (d) GSM-25 (EV: n=9, KO: n= 8) for Aβ40 (****p<0.0001) and Aβ42 (ns), (e) GSM-1 (n=6) for Aβ40 (**p=0.0039) and Aβ42 (ns), and (f) L458 (n=3) for Aβ40 (ns) and Aβ42 (ns) cleavages in the U138 EV or KO cell lines (n≥3). (g) IFITM3 knockdown (KD) does not affect expression of γ-secretase subunits. IFITM3 was knocked-down by siRNA (6 pmol, n=3) in HEK-NotchΔE cells and scramble siRNA (SC, n=3) was used as a negative control. Cell lysates were probed by antibodies against Nct, PS1-NTF and IFITM3. β-Actin was used as a loading control. (h) Effect of IFITM3 KD on γ-secretase activity. IFITM3 KD increased γ-secretase cleaved product NICD, analyzed by WB. Cell lysates were probed by antibodies against c-myc (NotchΔE) and NICD and a representative quantification of NICD (n=8, ***p=0.001) is shown (lower panel). (i) Cell based NICD AlphaLISA assay (left panel) revealed an increase in NICD production with IFITM3 KD. Quantification of NICD (n=8, ***p=0.001) is shown in the right panel. (j) Effect of IFITM3 KO on γ-secretase activity. KO cells lines have increased γ-secretase activity as compared to the EV cell line. The NICD cleavage in vitro was measured by AlphaLISA assay (n=3,**p=0.0096). All WB images and graphs are representative of three independent experiments Graphs are mean ± SD. ns, not significant, two-sided Student’s t-test.
Extended Data Figure 3.
Extended Data Figure 3.. Effect of aging and the expression of APP/PS1 on the level of γ-secretase and IFITM3.
(a) WBs for Nct and PS1-NTF (Fig. 3a) were quantified by Odyssey imaging (n=5 mice pooled per group, except n=4 for 28F, all=ns). (b) Effect of aging on subcellular localizations of IFITM3. A hemibrain from male wild-type C57BL/6 mouse at 4 and 28 months (n=1 per group) were homogenized and layered on iodixanol gradient (2.5 – 30 %). Fractions were collected from the top and resolved by WBs for γ-secretase, IFITM3 and different subcellular markers. (c) WBs for APP, Nct, and PS1-NTF (Fig. 3e) were quantified by Odyssey imaging (n=5 mice per group except n=4 for WT at 12 months). APP: 3moWT-3mo5X: ****p<0.001, 3mo5X-12mo5X: ****p<0.0001, 12moWT-12mo5X: ****p<0.0001). Nct: 3moWT-12moWT: ****p<0.001, 3mo5X-12mo5X: ****p<0.001, 12moWT-12mo5X: ****p<0.001. PS1-NTF: 3moWT-12mo5X: ***p=0.0004, 12moWT-12mo5X: ****p<0.001. (d) Immunostaining of IFITM3 in mouse brains. Fluorescence microscopy of IFITM3 expression in 12-month-old PFA perfused mice (WT, upper panel, 5XFAD, lower panel). Representative images of cortex, hippocampus and subiculum (left to right) show IFITM3 (green) and DAPI (blue). Scale bar = 1000μm, 200μm, 100μm (left to right). Total IFITM3 fluorescence area within the hippocampus and cortex of WT and 5XFAD was quantified using FIJI. Total IFITM3 was divided by tissue area and 5XFAD expression was normalized to average of WT (WT: n=7, 5XFAD: n=9)(cor (cortex): **p=0.0035, hip (hippocampus): ****p<0.0001 ). (e) IFITM3 expression in astrocytes and microglia is upregulated in 5XFAD mice compared to WT mice. Fluorescence microscopy of IFITM3, GFAP (top) and Iba1 (bottom) expression in 12-month-old PFA perfused mice (WT, upper panel, 5XFAD, lower panel). Representative images of the hippocampus and cortex show IFITM3 (red), GFAP (green – top), Iba1 (green - bottom), and DAPI (blue), scale bar = 500μm. Inset panels (left to right) show GFAP or Iba1 (green), IFITM3 (red) and merge. Scale bar = 50μm. All WB images and graphs are representative of three independent experiments (except; b: 2 replicates). Graphs are mean ± SD. ns, not significant, , two-sided Student’s t-test, (except; c: one-way ANOVA followed by Tukey).
Extended Data Figure 4.
Extended Data Figure 4.. Expression profile of IFITM3 and other markers in LOAD and age-matched controls.
(a) Spearman’s correlation of mRNA expression of human IFITM3 gene with age was analyzed in the cortex (n=158) and hippocampus (n=123) of normal human brains using the Genotype-Tissue Expression (GTEx) cohort.. (b) mRNA expression in non-demented subject control (n=10) and LOAD samples (n=18) of MAP2 (ns), GFAP (**p=0.0046), and AIF1 (ns) were measured, which were used in Fig. 4c–d. (c) Expression profiles of MAP2 (ns), GFAP (****p<0.0001), and AIF1 (ns) in the temporal cortex of human control (n=76) and LOAD samples (n=80) using the Mayo Clinic cohort data. Correlation analyses were carried out and p values were calculated. (d) The protein levels of Nct (****p<0.0001) and PS1-NTF (**p=0.0042) in human brain membranes (control and LOAD). The samples were analyzed by WB and quantified (n=10 and 18, respectively). Signal was normalized to HeLa cell membrane. (e-f) IFITM3 SNP Genotypes. (e) Allelic discrimination plot depicting rs34481144 genotype calls for control (n=9), LOAD-L (n=10), and LOAD-H (n=8) brain samples. The axes show delta Rn values obtained from TaqMan SNP genotyping analysis. Samples without genomic DNA were used as non-template controls (shown as black squares in the left lower quadrant, n=2). (f) Allele frequency of rs34481144 genotype in control (n=9) and LOAD (n=18). (g) mRNA level of IFITM3 gene in four types of EGFP/L10a-expressing mouse hippocampal neurons (GAD2 (glutamate decarboxylase 2), CCK (cholecystokinin), PV (parvalbumin), and CORT (cortistatin) expressing GABAergic neurons)(n=4 per group, GAD2-PV: ***p=0.0003, CCK-PV: ****p<0.0001, CCK-Cort *p=0.0363, PV-Cort: **p=0.0059). (h) mRNA levels of IFITM3 in human iPSC-derived neurons (n=4) and human primary astrocytes (n=3) were measured by qPCR (****p<0.0001). (i-j) Human iPSC-derived neurons (i) and human primary astrocytes (j) were stained for IFITM3 with MAP2 (neuronal marker) or S100β (astrocyte marker). DAPI was used for nucleus staining. Scale bar = 200 and 500 μm. (k) Induction of IFITM3 by IFN-α in primary neurons. E16 mouse primary neurons were treated with 100 ng/ml of IFN-α at DIV12 for 24 hours. The protein levels of γ-secretase and IFITM3 were analyzed by WB (n=4 per group). β-Tubulin III was used as a loading control. (l) Effect of IFITM3 induction on γ-secretase activity for Aβ40 (*p=0.0116) and Aβ42 (*p=0.0319) activity. Membranes from primary neurons were incubated with the recombinant APP substrate C100-ΔID-FLAG and γ-secretase activity (Aβ cleavage rate) was assayed by human Aβ three-plex MSD kits (n=12, 10). (m) JC8 whole cell photolabeling. Neuronal membranes were photolabeled with JC8 in the absence or presence of L458 and analyzed by anti-PS1-NTF antibody. Photolabeled PS1-NTF protein level was quantified by Odyssey imaging (n=3, *p=0.0210). (n) Spearman’s correlation between the expression level of IFITM3 and viruses. In the Brodmann Area 22 (BA-22 region) in the Mount Sinai Brain Bank (MSBB) cohort, the expression level of IFITM3 is positively correlated with the expression level of the human herpesvirus-6B (HHV-6B) (rho=0.248, p=0.044, n=66). In the Brodmann Area 36 (BA-36 region), the expression level of IFITM3 is positively correlated with the expression of hepatitis C virus genotype 4 (rho=0.255, p=0.033, n=70). All WB images and graphs are representative of two independent experiments (except; b/e: 1 replicate, h: data pooled from 2 experiments, k: 3 replicates, l: data pooled from 4 experiments). Bar graphs are mean ± SD. Violin plots represent median (middle line) and interquartile range (outer lines). ns, not significant, * P < 0.05, ** P < 0.01, **** P < 0.0001, two-sided Student’s t-test (except; g: One-Way ANOVA followed by Tukey).
Extended Data Figure 5.
Extended Data Figure 5.. Correlation between L505 labeled protein and γ-secretase activity.
(a) Structures of JC8, L505, L646, GY4 and L631. (b) WB analysis of 11Bt labeled proteins in the absence or presence of its parent compound, a substrate binding site inhibitor pep11 and imidazole GSM, E2012. Labeled proteins were captured and analyzed by WB for PS1-NTF (n=1). (c) Pearson’s correlation between γ-secretase activity (Aβ40, Aβ42 cleavage rates in Fig. 4d) and L505 labeled PS1-NTF (in Fig. 5c) in LOAD samples (n=10). Linear regression analysis was used to calculate R and p values.
Fig. 1.
Fig. 1.. IFITM3 directly binds to γ-secretase.
(a) E2012 and E2012-BPyne structures. (b) Cell membranes were photolabeled with E2012-BPyne and then clicked with TAMRA-azide and analyzed (left: Coomassie blue; right: in-gel fluorescence). (c) Biotinylated proteins were captured by E2012-BPyne and analyzed by WB. (d) IFITM3 co-immunoprecipitated with γ-secretase subunits using anti-PS1. (e) IFITM3 was co-purified with γ-secretase subunits by GY6 or 163-BP-L-biotin. (f) An interaction (red) between PS1 and IFITM3 was determined by in situ PLA in mouse primary neurons (bottom panel). Negative controls using PS1 or IFITM3 alone (top two panels), dapi (blue), F-actin (green), scale bar = 50μm. (g) Labeling of IFITM3 by E2012-Bpyne in WT and dKO MEF cells. All WB and IF images are representative of three independent experiments (except b: 2 replicates).
Fig. 2.
Fig. 2.. Effect of IFITM3 on γ-secretase activity for APP cleavage.
(a) IFITM3 KD by siRNA (n=3) in HEK-APPWT cells was confirmed by WB. Scramble siRNA (SC, n=3), a negative control. (b) IFITM3 KD reduces secreted Aβ40 (n=6, ****p<0.0001) and 42 (n=6, ****p<0.0001). Aβ levels were calculated as % of SC. (c) IFITM3 was KO of U138 cells, and empty vector (EV) was used as control. IFITM3 was reintroduced by transient transfection in both EV and KO cell lines. IFITM3 expression was confirmed by WB. (d) Effect of KO and rescue of IFITM3 on γ-secretase activity for Aβ40 (n=3, *p= 0.0249, ****p<0.0001) and 42 (n=3, *p=0.0359, **p=0.0025) cleavage. (e) Comparison IC50 of GSM E2012-BPyne against γ-secretase for Aβ40 (n=6, **p= 0.0017) and Aβ42 (n=6, ns) cleavages in U138 EV and KO cells. All WB images and graphs are representative of three independent experiments (except; e: contains data from 2 experimental replicates of n=3). Graphs are mean ± SD. Ns, not significant, two-sided Student’s t-test (except; d: one-way ANOVA and Fishers LSD test).
Fig. 3.
Fig. 3.. Effect of aging and the expression of APP/PS1 on IFITM3 and γ-secretase.
(a) Protein levels of γ-secretase subunits and IFITM3 in pooled membranes from 4- and 28-month-old WT mouse brains (n=5 mice per age and sex group except n=4 for 28 female, female: **p=0.0014, male: **p=0.0065). Quantified as percent of 4-month female level. (b) γ-Secretase activity for Aβ40 (female: p=***0.0002, male: **p=0.0095) and Aβ42 (female: p=**0.0024, male: **p=0.0088) production in vitro from pooled membrane. (c) Solubilized membranes were captured by 163-BP-L-biotin and then analyzed for γ-secretase and IFITM3 levels. (d) WB for PS1-NTF and IFITM3 (left panel, representative mice shown) in membranes of 18-month-old WT (n=4) and IFITM3−/− (n=5) mouse brains. γ-Secretase activity for Aβ40 (***p=0.0004) and 42 (****p=<0.0001) cleavage (right panels). (e) APP, Nct, PS1-NTF and IFITM3 in membranes from 3- and 12-month-old WT and 5xFAD mice. Quantified as percent of 3-months-old WT (n=5 per group except n=4 for WT at 12 months)(3moWT-12mo5X: ****p<0.0001, 12moWT-12mo5X: ***p=0.004, 3mo5X-12mo5X: ***p=0.0003). (f) WB for PS1-NTF and IFITM3 (left panel) in membranes from 4-month-old 5xFAD (n=3) and IFITM3−/−; 5xFAD (n=3) mouse brains. γ-Secretase activity in vitro for Aβ40 (***p=0.0003) and 42 (**p=<0.0011) cleavage (right panels). (g) Fluorescence microscopy of amyloid plaques in cortex and hippocampus (Thioflavin-S, green) in 4-month-old PFA perfused mice (5xFAD: n=4, IFITM3−/−; 5xFAD: n=5). Scale bar = 300μm (left), 200μm (right). Number of plaques per mm2 of tissue was calculated throughout the brain and averaged (cor (cortex): *p=0.0109, hip (hippocampus): **p=0.0026). All WB and IF images and graphs are representative of three independent experiments (except; c and quantifications in e: 2 replicates and g: every 1/6th section throughout the brain). Bar graphs are mean ± SD. Violin plots represent median (middle line) and interquartile range (outer lines). Ns, not significant, two-sided Student’s t-test (except; e: two-way ANOVA followed by Tukey).
Fig. 4.
Fig. 4.. The association of IFITM3 with the γ-secretase complex in human brains.
(a) The expression profiles of IFITM3 in human control (n=76) and LOAD (n=80) from temporal cortex (**p=0.002)(Mayo Clinic cohort). (b) IFITM3 mRNA expression levels in control and LOAD samples (LOAD: n=18 and control: n=10, **p=0.0056). (c) The protein levels of γ-secretase subunits and IFITM3 in human brain membranes (LOAD: n=18 and control: n=10, *p=0.0127). IFITM3 quantified as relative intensity. (d) IFITM3 expression (left) between control (n=10), LOAD-L (n=10) and LOAD-H (n=8)(****p<0.0001). γ-Secretase activity for Aβ40 (**p=0.0037, ***p=0.0007) and 42 (**p=0.0036, ***p=0.0002) cleavage between groups. (e) Primary mouse neurons were treated with control (n=2), 10ng/mL (n=3, ***p=0.0005) or 100 ng/mL (n=3, ***p=0.0003) of IFN-γ, membranes were probed for γ-secretase and IFITM3 (left panel, quantified: right panel). (f) Quantification of secreted Aβ40 from 10ng/mL (n=8, **p=0.0010) and 100 ng/mL (n=8, **p=0.0026) IFN-γ treated neurons Aβ42 from 10ng/mL (n=8, ***p=0.0006) and 100 ng/mL (n=8, ***p=0.0003) IFN-γ (n=8). (g) γ-Secretase activity for Aβ40 (n=6, ***p=0.0007) and 42 (n=6, ***p=0.006) cleavage from IFN-γ treated neuron membranes. (h) Photolabeled PS-NTF in neuronal membranes and quantified as % of control (control: n=10, 10ng/ml: n=5, **p=0.0023, 100ng/ml: n=7,****p<0.0001). (i) WB for IFITM3 and PS1-NTF primary human astrocytes treated with PBS, IL-6, or IL-1β (control: n=6, IL-6: n=4, **p=0.0014, IL-1β: n=3, *p=0.0103), data normalized to PBS. (j) γ-Secretase activity for Aβ40 (control: n=8 IL-6: n=7, **p=0.0098, IL-1β: n=9,****p<0.0001) and 42 (control: n= IL-6: n=7, *p=0.0467, IL-1β: n=9, ****p<0.0001) in astrocyte membrane. All WB images and graphs are representative of three independent experiments (except; b: 1 replicate, c/g: 2 replicates, d: γ-secretase activity graph contains data from two independent replicates, h: 5 replicates). Graphs are mean ± SD. Ns, not significant, *P ≤ 0.05, **P ≤ 0.01, ***P ≤ 0.001, two-sided Student’s t-test.
Fig. 5.
Fig. 5.. IFITM3 is located near the active site of γ-secretase.
(a) Schematic model showing L458 binding to the subsites (S2-S3’) in the active site of γ-secretase. (b) Photolabeling of IFITM3 and PS1 by four inhibitors. (c) Photolabeling of IFITM3 and PS1 by L505 in human brains (control: n=4, LOAD-L: n=5, LOAD-H: n=5). (d) Pearson’s correlation between γ-secretase activity (Fig. 4d) and L505 labeled IFITM3 (Fig. 5c) in LOAD samples (n=10). (e) Double cross-linking of γ-secretase and IFITM3 by the dual probe, L631. WB reveals multiple protein complex species containing IFITM3, PS1-NTF, PS1-CTF, IFITM3 homodimer, IFITM3-PS1 and PS1-NTF-CTF heterodimers. (f) Schematic representation of the interaction between IFITM3 and γ-secretase, IFITM3 is near the active site and can be crosslinked with PS1-NTF. (g) IFITM3 connects infections and innate immunity with Aβ production and AD risk. (A) Pathogenic challenge, or other inflammatory conditions, induce the release of proinflammatory cytokines from astrocytes and microglia. (B) Cytokines upregulate IFITM3 expression in neurons and astrocytes that potentiates γ-secretase, increasing Aβ production. (C) As part of an innate immune response, Aβ acts as an antimicrobial or antiviral peptide. In turn, Aβ accumulation also triggers AD pathology. All WB images and graphs are representative of three independent experiments (except; c: 2 replicates).

Comment in

Similar articles

Cited by

References

References and Notes:

    1. Shi Y & Holtzman DM Interplay between innate immunity and Alzheimer disease: APOE and TREM2 in the spotlight. Nature reviews. Immunology 18, 759–772, doi:10.1038/s41577-018-0051-1 (2018). - DOI - PMC - PubMed
    1. Griciuc A et al. Alzheimer’s disease risk gene CD33 inhibits microglial uptake of amyloid beta. Neuron 78, 631–643, doi:10.1016/j.neuron.2013.04.014 (2013). - DOI - PMC - PubMed
    1. Wang Y et al. TREM2 lipid sensing sustains the microglial response in an Alzheimer’s disease model. Cell 160, 1061–1071, doi:10.1016/j.cell.2015.01.049 (2015). - DOI - PMC - PubMed
    1. De Strooper B. Aph-1, Pen-2, and Nicastrin with Presenilin generate an active gamma-Secretase complex. Neuron 38, 9–12 (2003). - PubMed
    1. Gertsik N, Chiu D & Li YM Complex regulation of gamma-secretase: from obligatory to modulatory subunits. Frontiers in aging neuroscience 6, 342, doi:10.3389/fnagi.2014.00342 (2014). - DOI - PMC - PubMed

Methods references

    1. Li YM et al. Photoactivated gamma-secretase inhibitors directed to the active site covalently label presenilin 1. Nature 405, 689–694 (2000). - PubMed
    1. Chun J, Yin YI, Yang G, Tarassishin L & Li YM Stereoselective Synthesis of Photoreactive Peptidomimetic gamma-Secretase Inhibitors. J Org Chem 69, 7344–7347 (2004). - PubMed
    1. Gertsik N, Chau DM & Li YM gamma-Secretase Inhibitors and Modulators Induce Distinct Conformational Changes in the Active Sites of gamma-Secretase and Signal Peptide Peptidase. ACS Chem Biol, doi:10.1021/acschembio.5b00321 (2015). - DOI - PMC - PubMed
    1. Crump CJ et al. Development of Sulfonamide Photoaffinity Inhibitors for Probing Cellular gamma-Secretase. ACS Chem Neurosci 7, 1166–1173, doi:10.1021/acschemneuro.6b00127 (2016). - DOI - PMC - PubMed
    1. Crump CJ et al. Piperidine acetic acid based gamma-secretase modulators directly bind to Presenilin-1. ACS Chem Neurosci 2, 705–710, doi:10.1021/cn200098p (2011). - DOI - PMC - PubMed

Publication types

MeSH terms