. 2020 Sep;585(7824):303-308.
doi: 10.1038/s41586-020-2654-5. Epub 2020 Sep 2.

Shared structural mechanisms of general anaesthetics and benzodiazepines

Affiliations

Shared structural mechanisms of general anaesthetics and benzodiazepines

Jeong Joo Kim et al. Nature. 2020 Sep.

Abstract

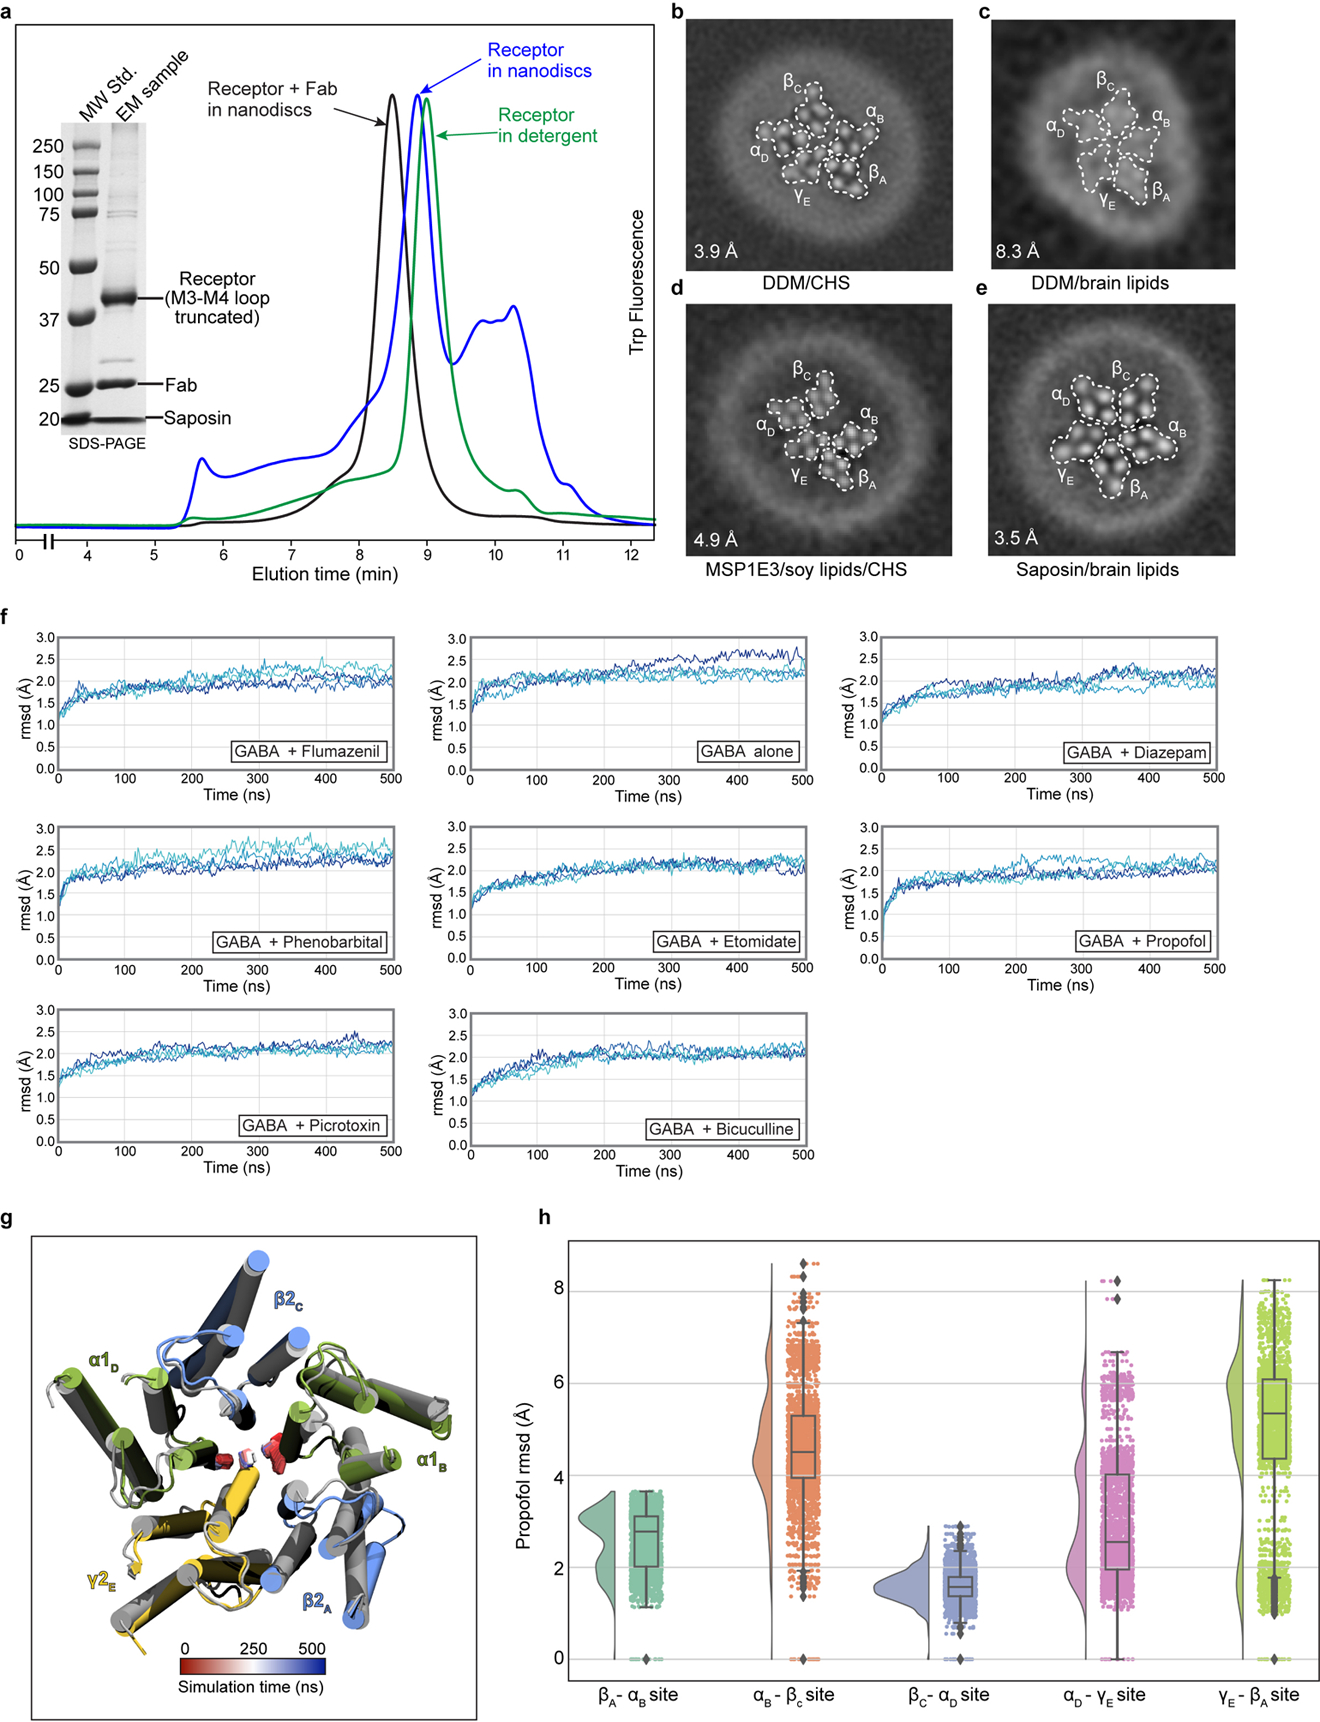
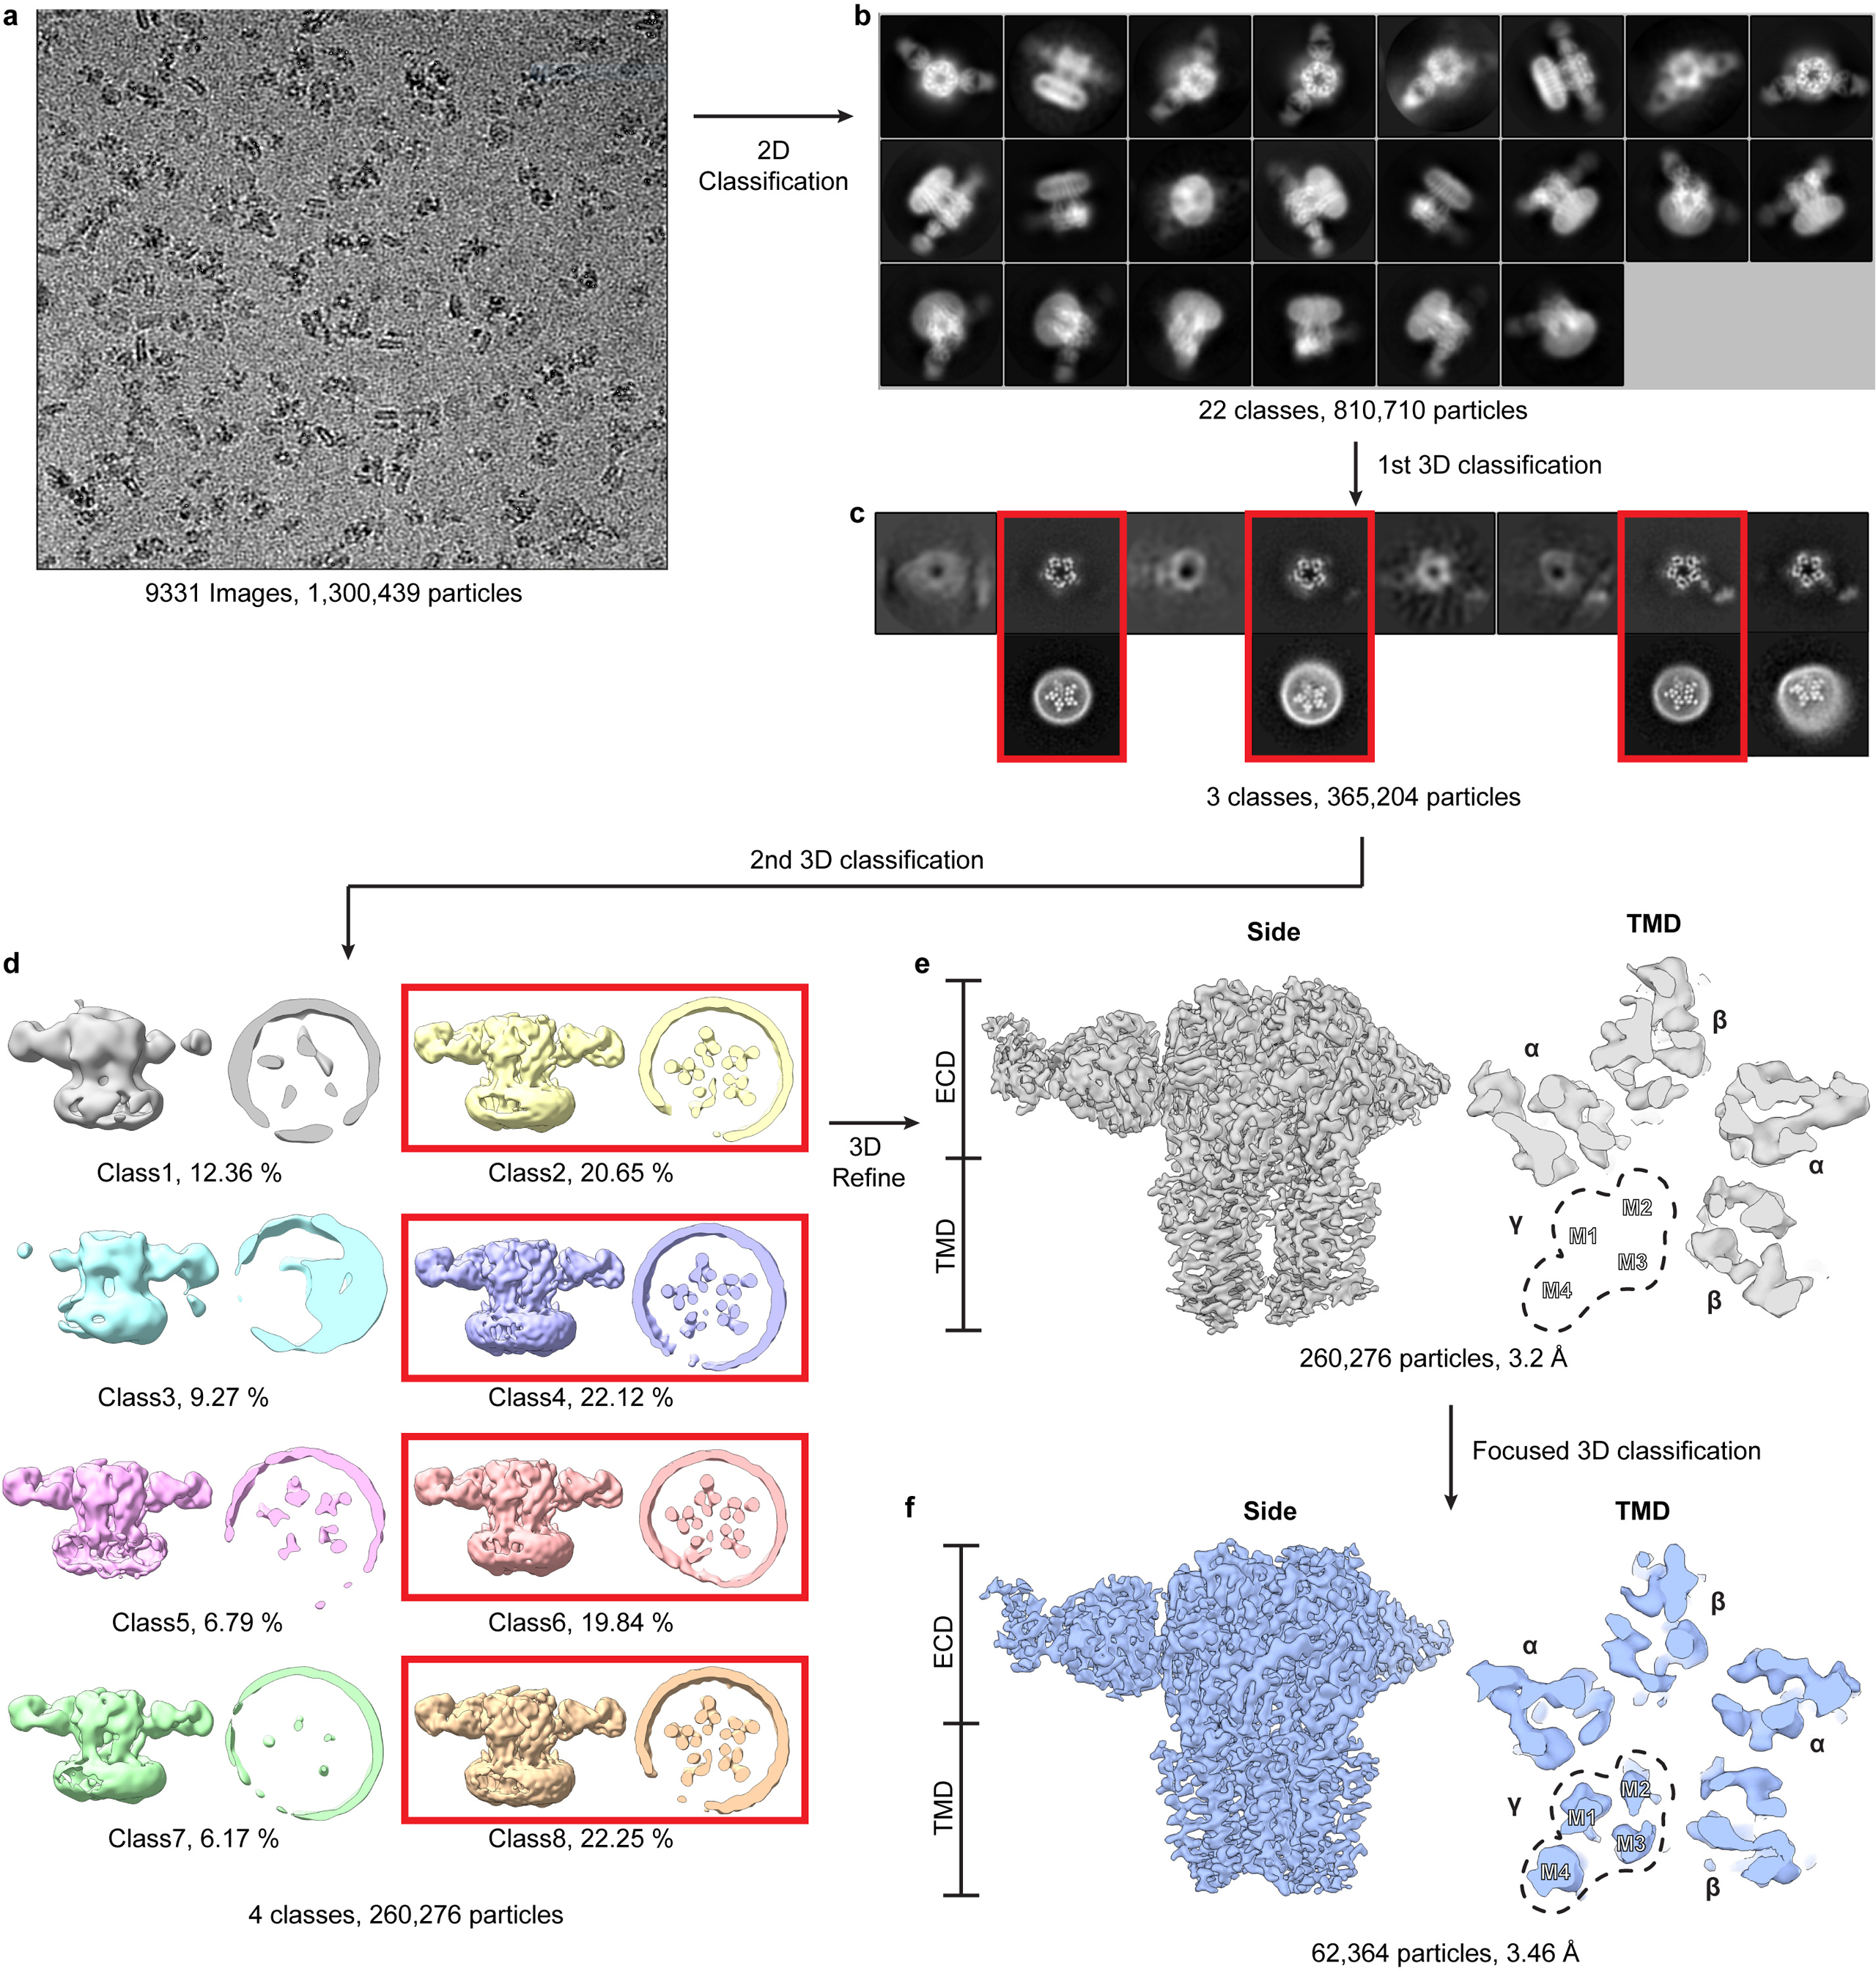
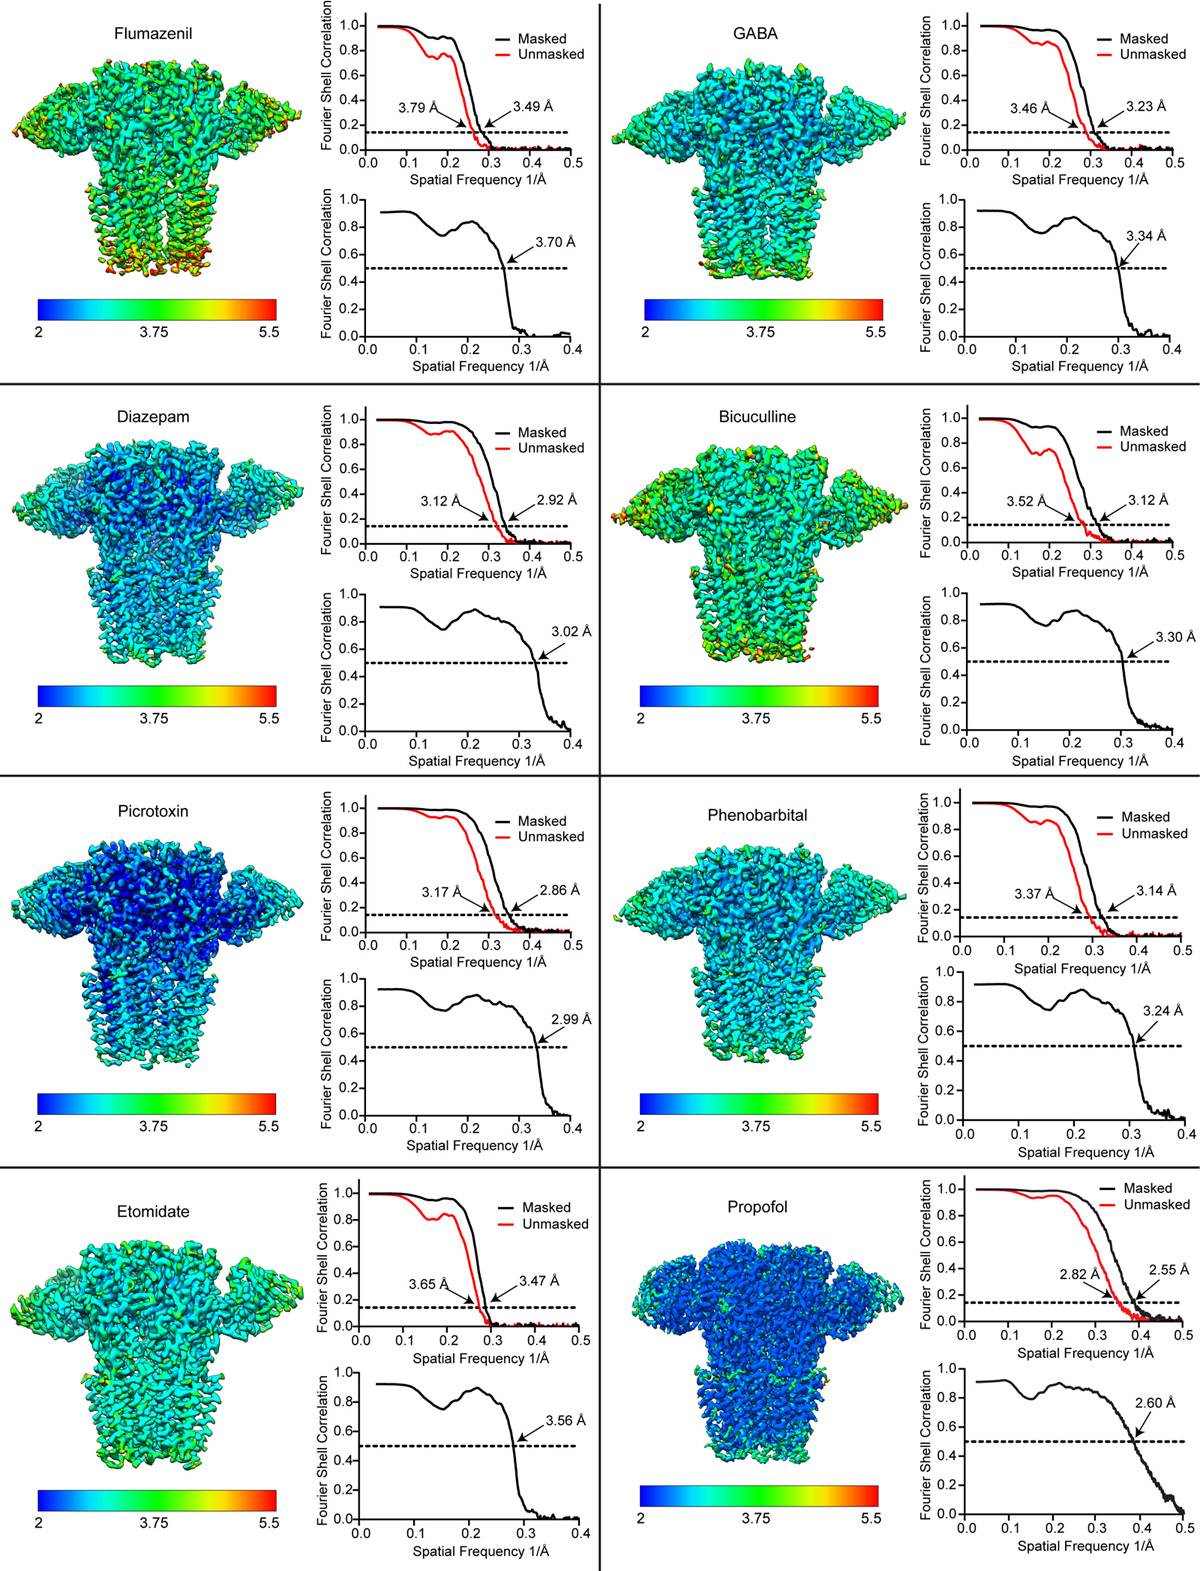
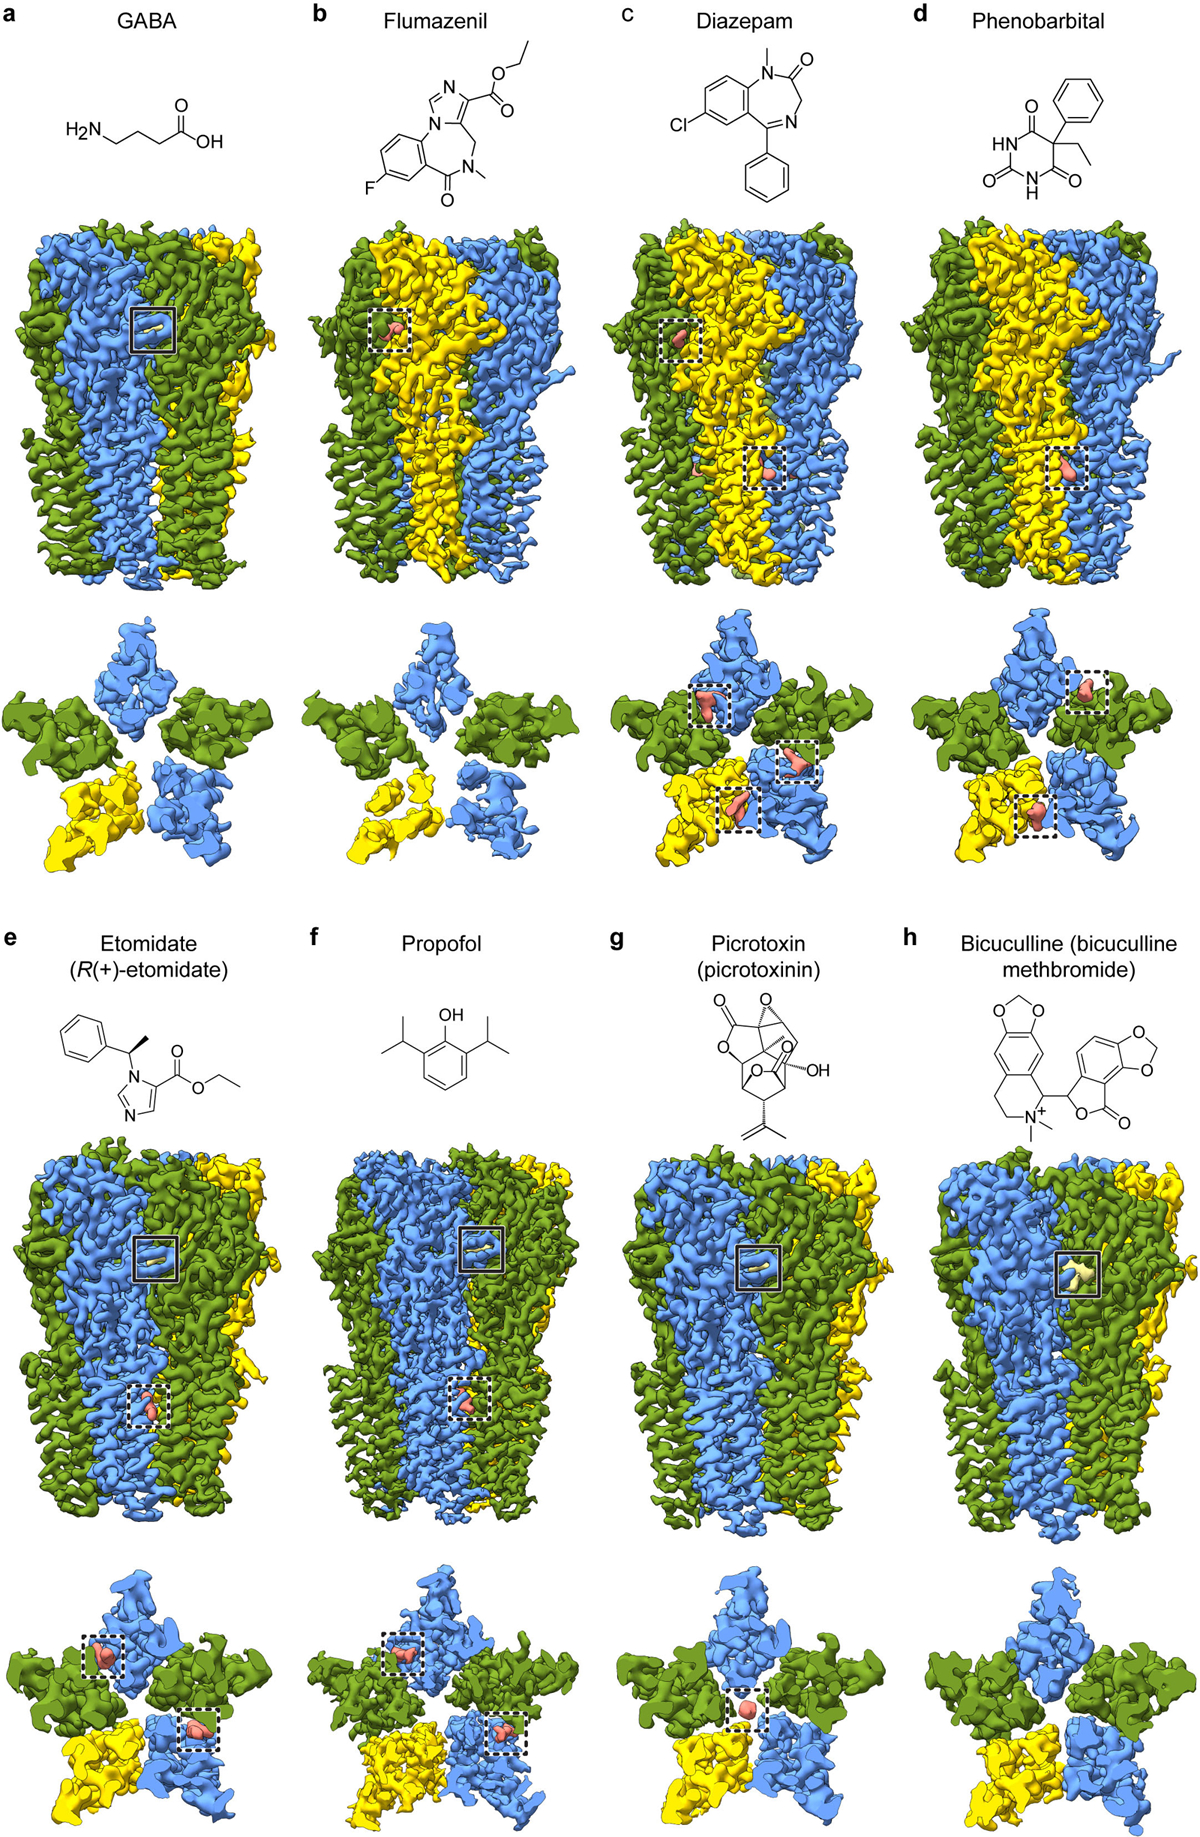
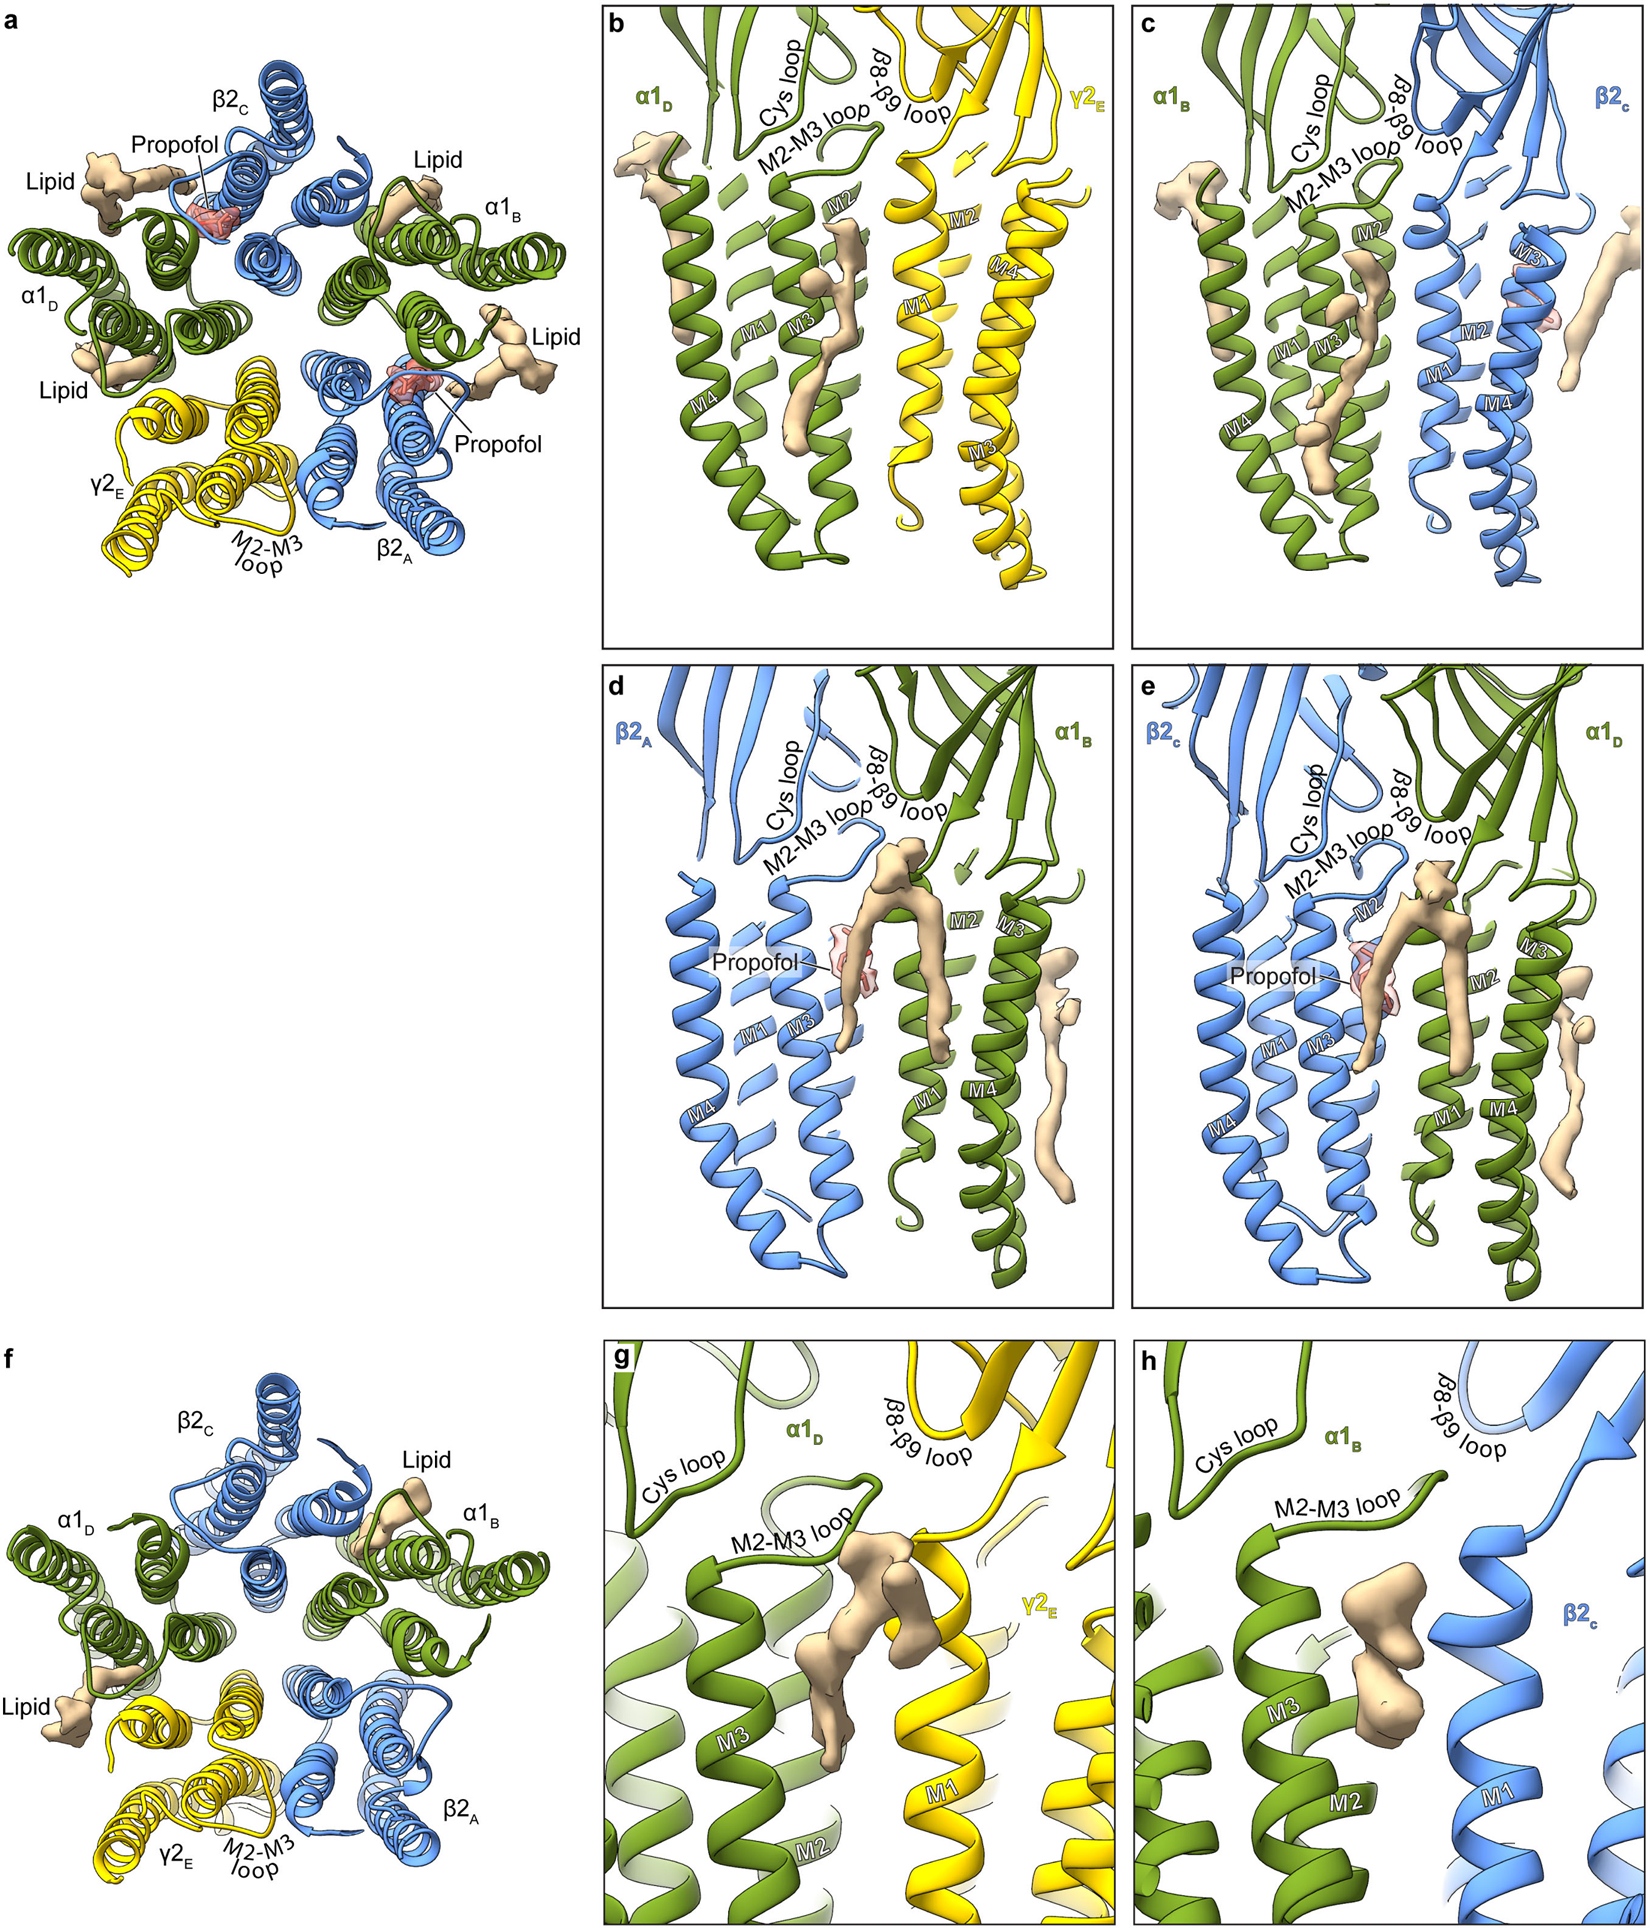
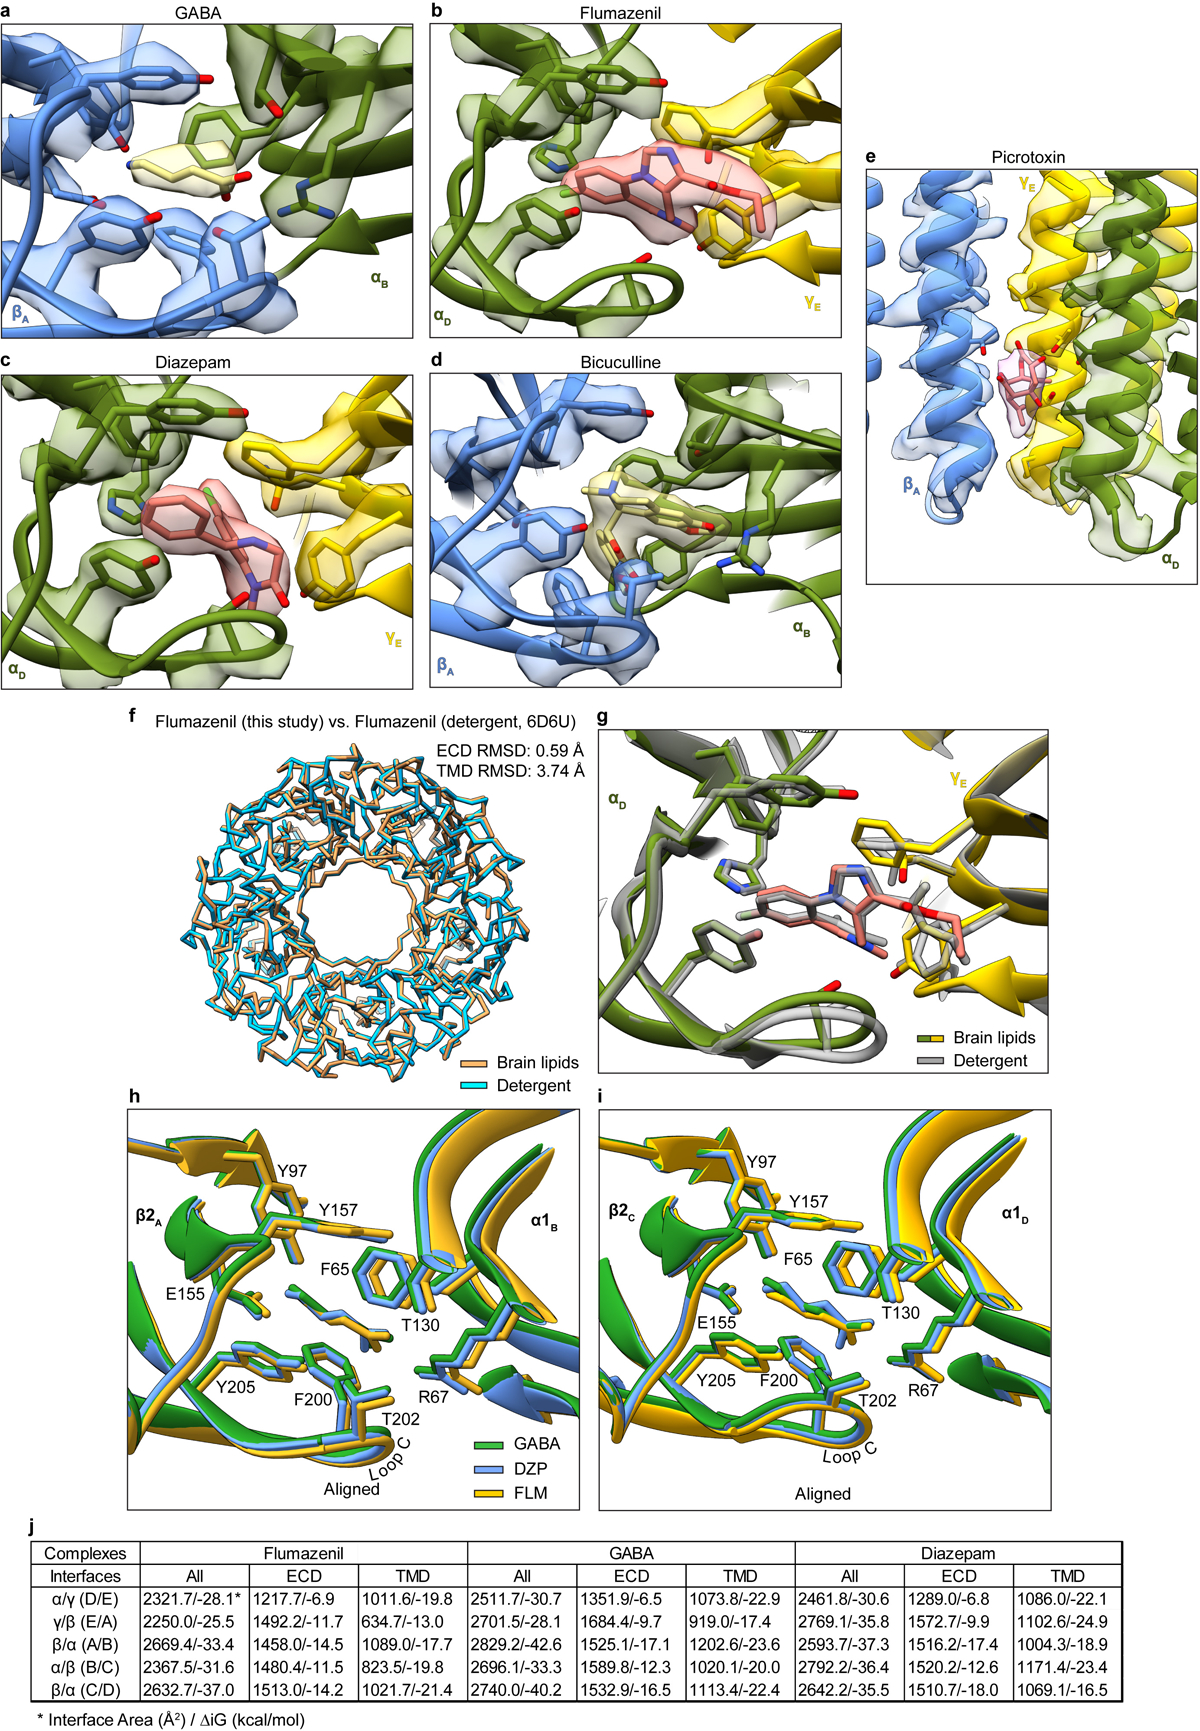
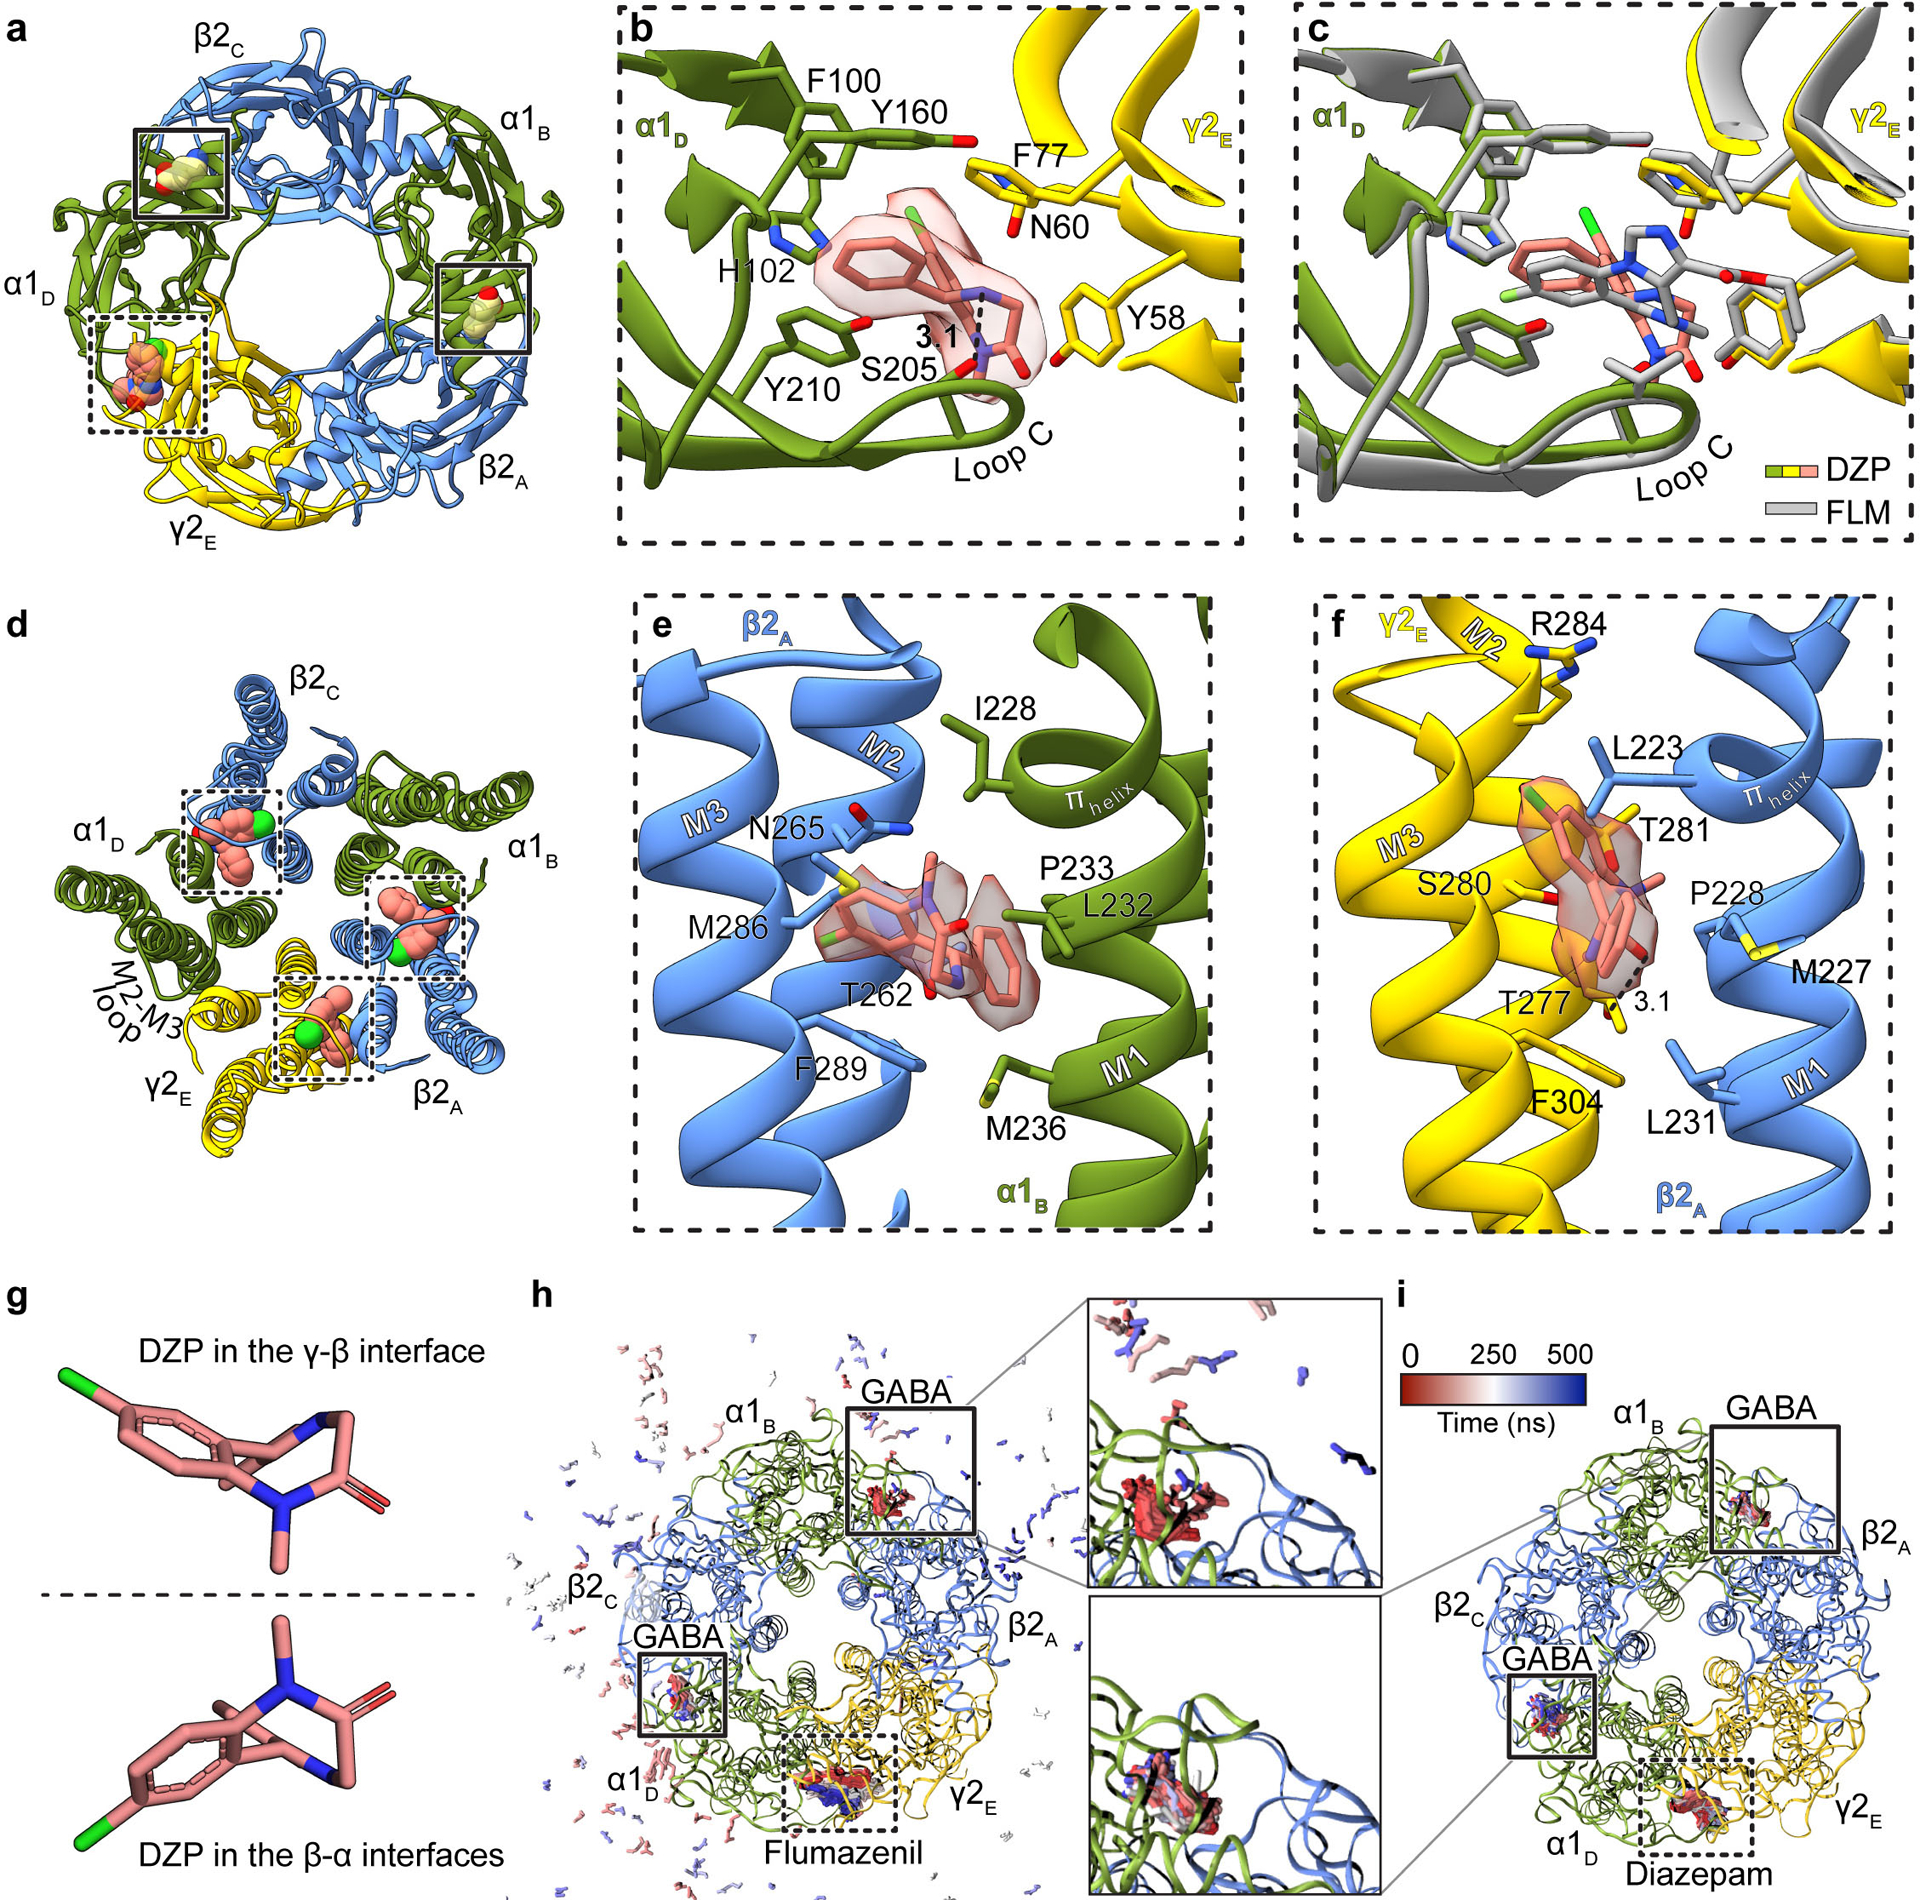
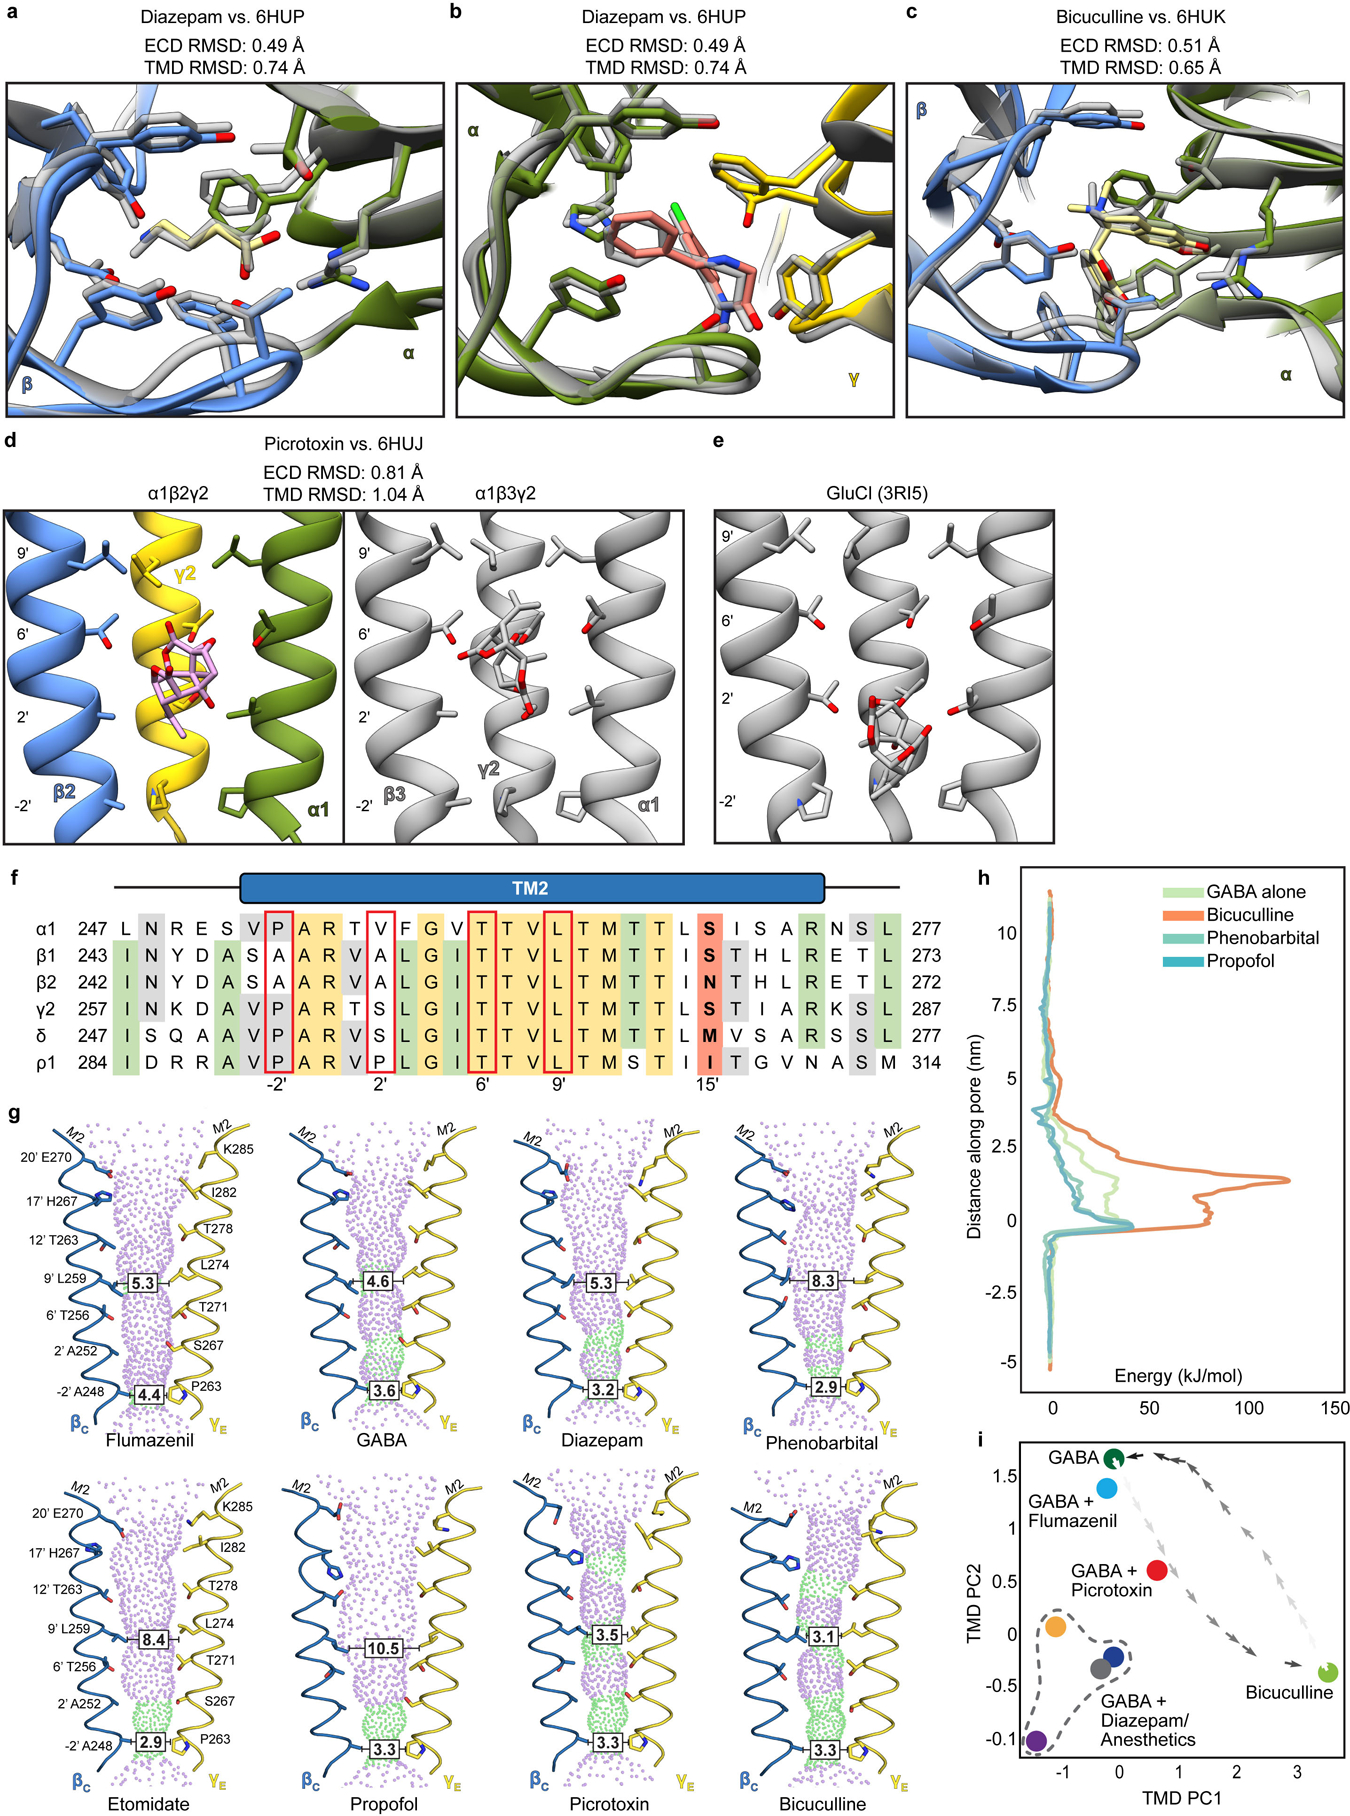
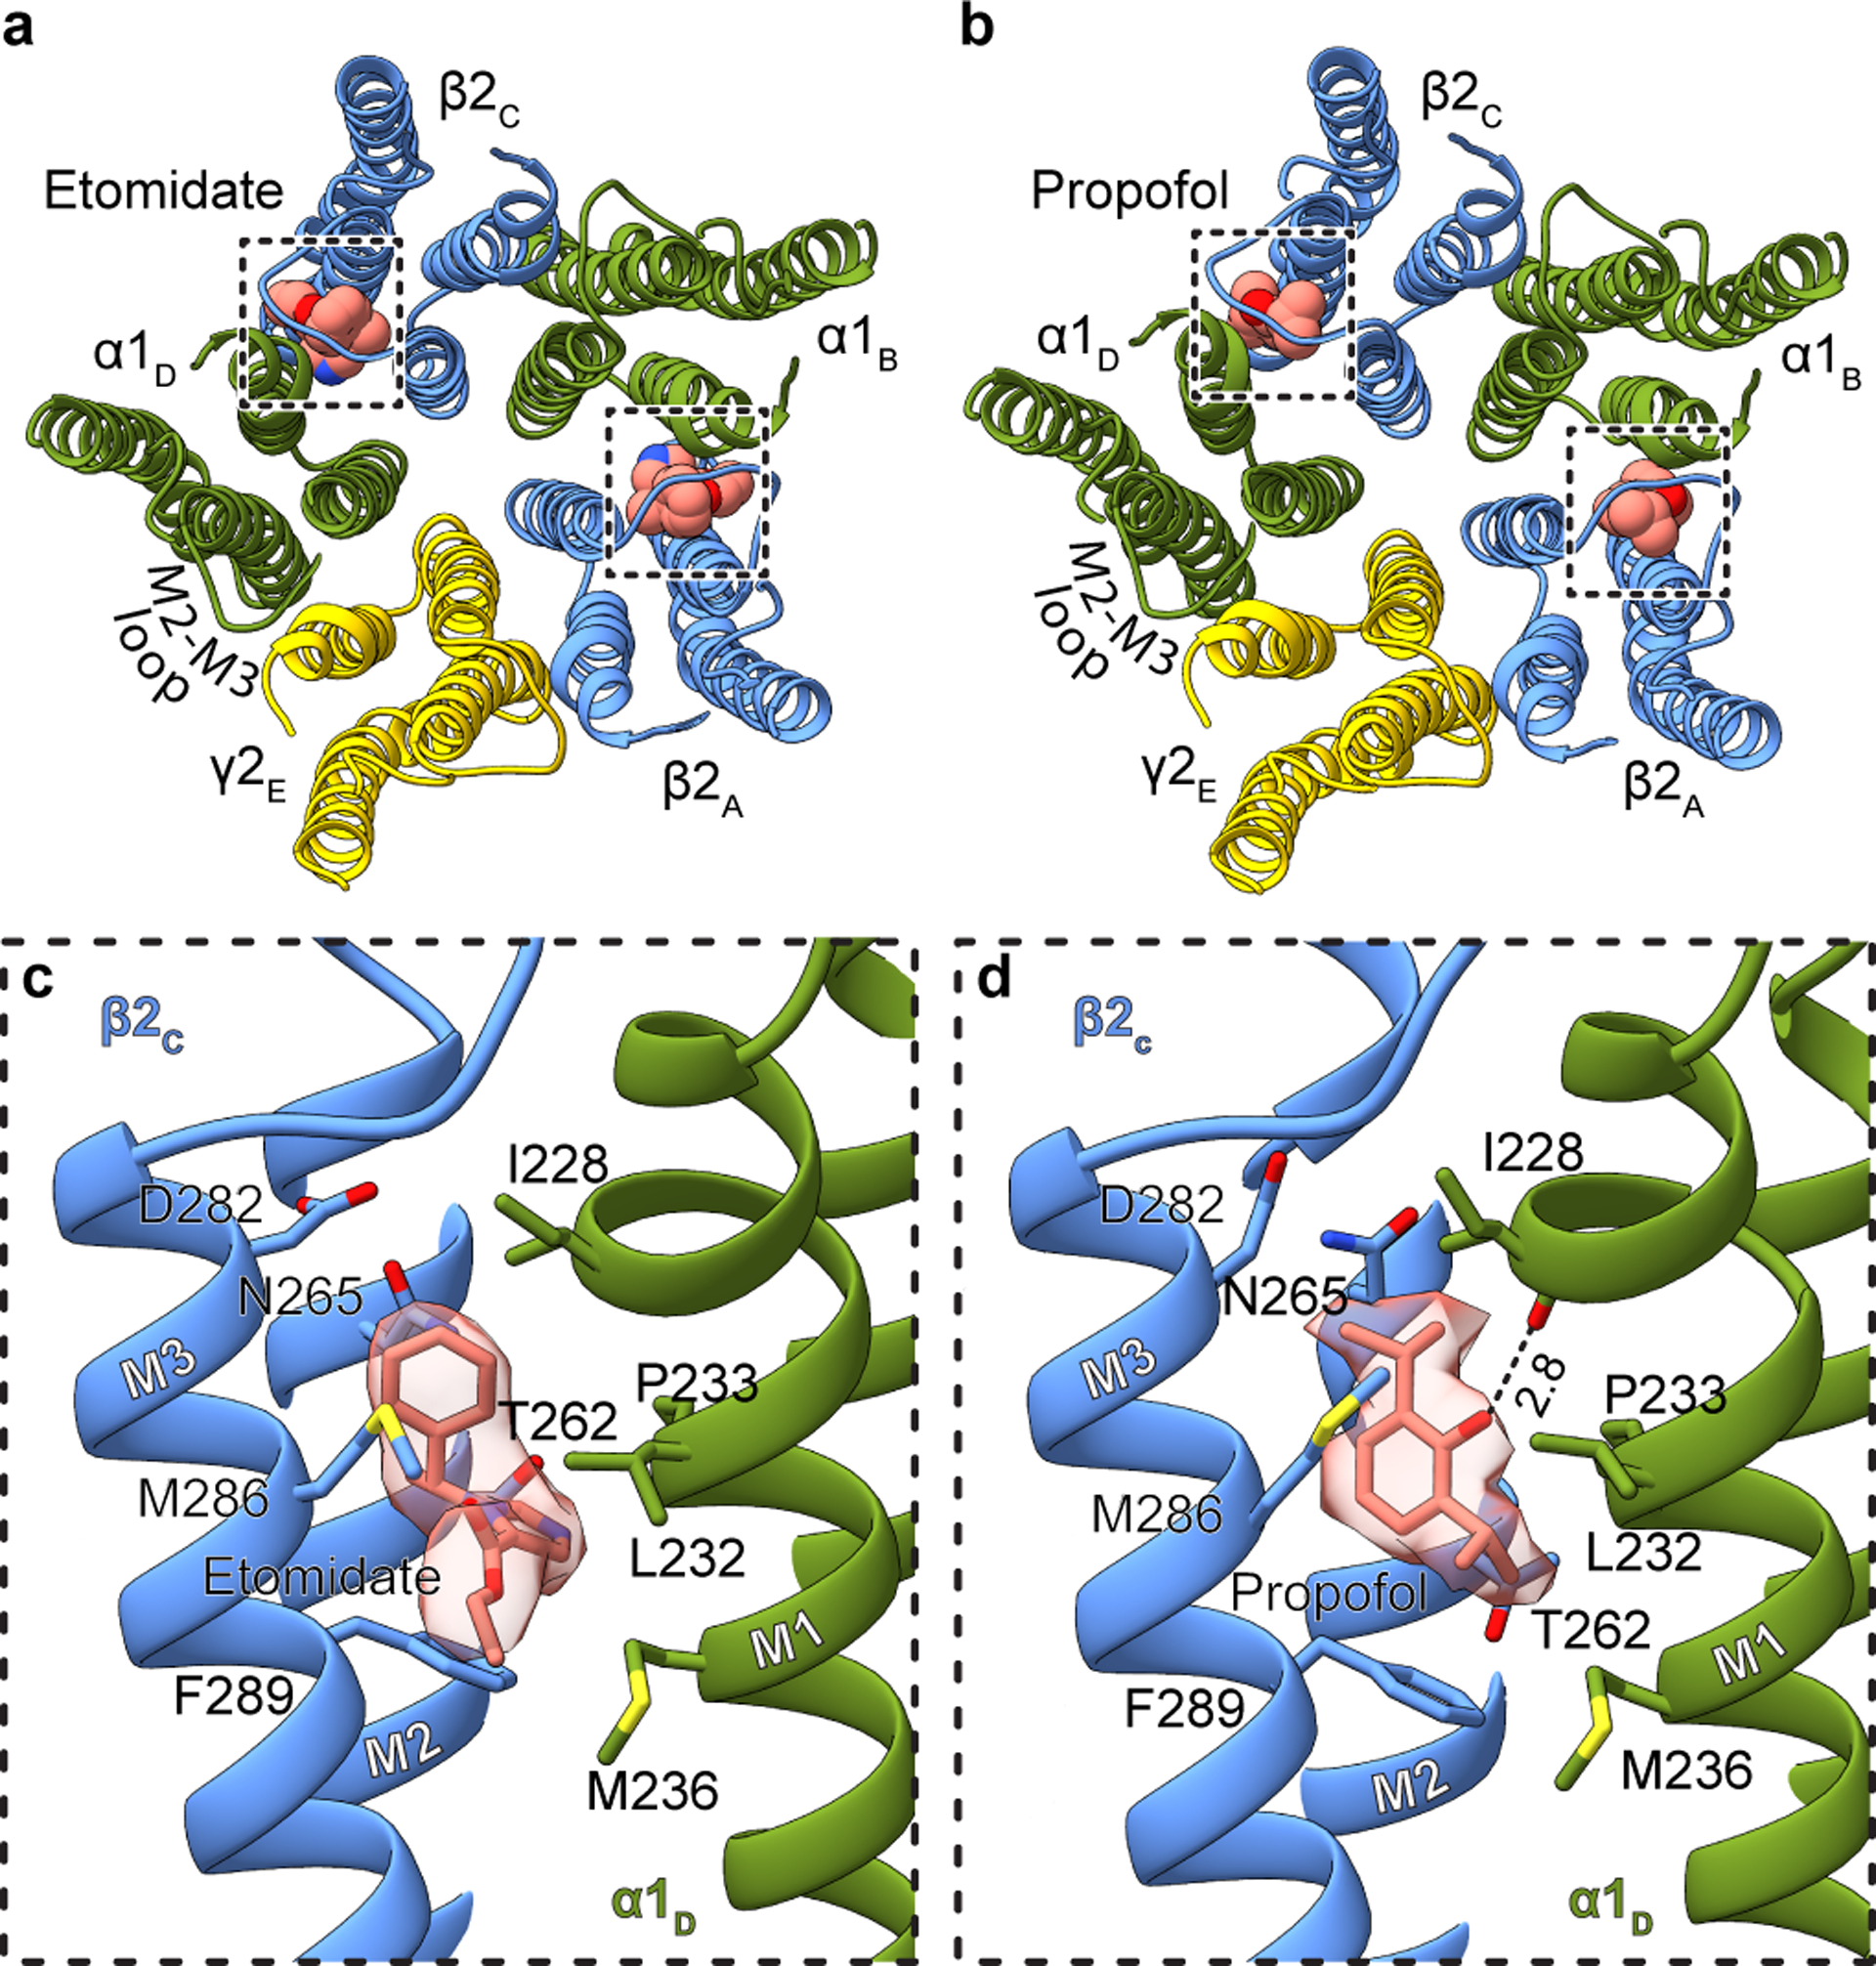
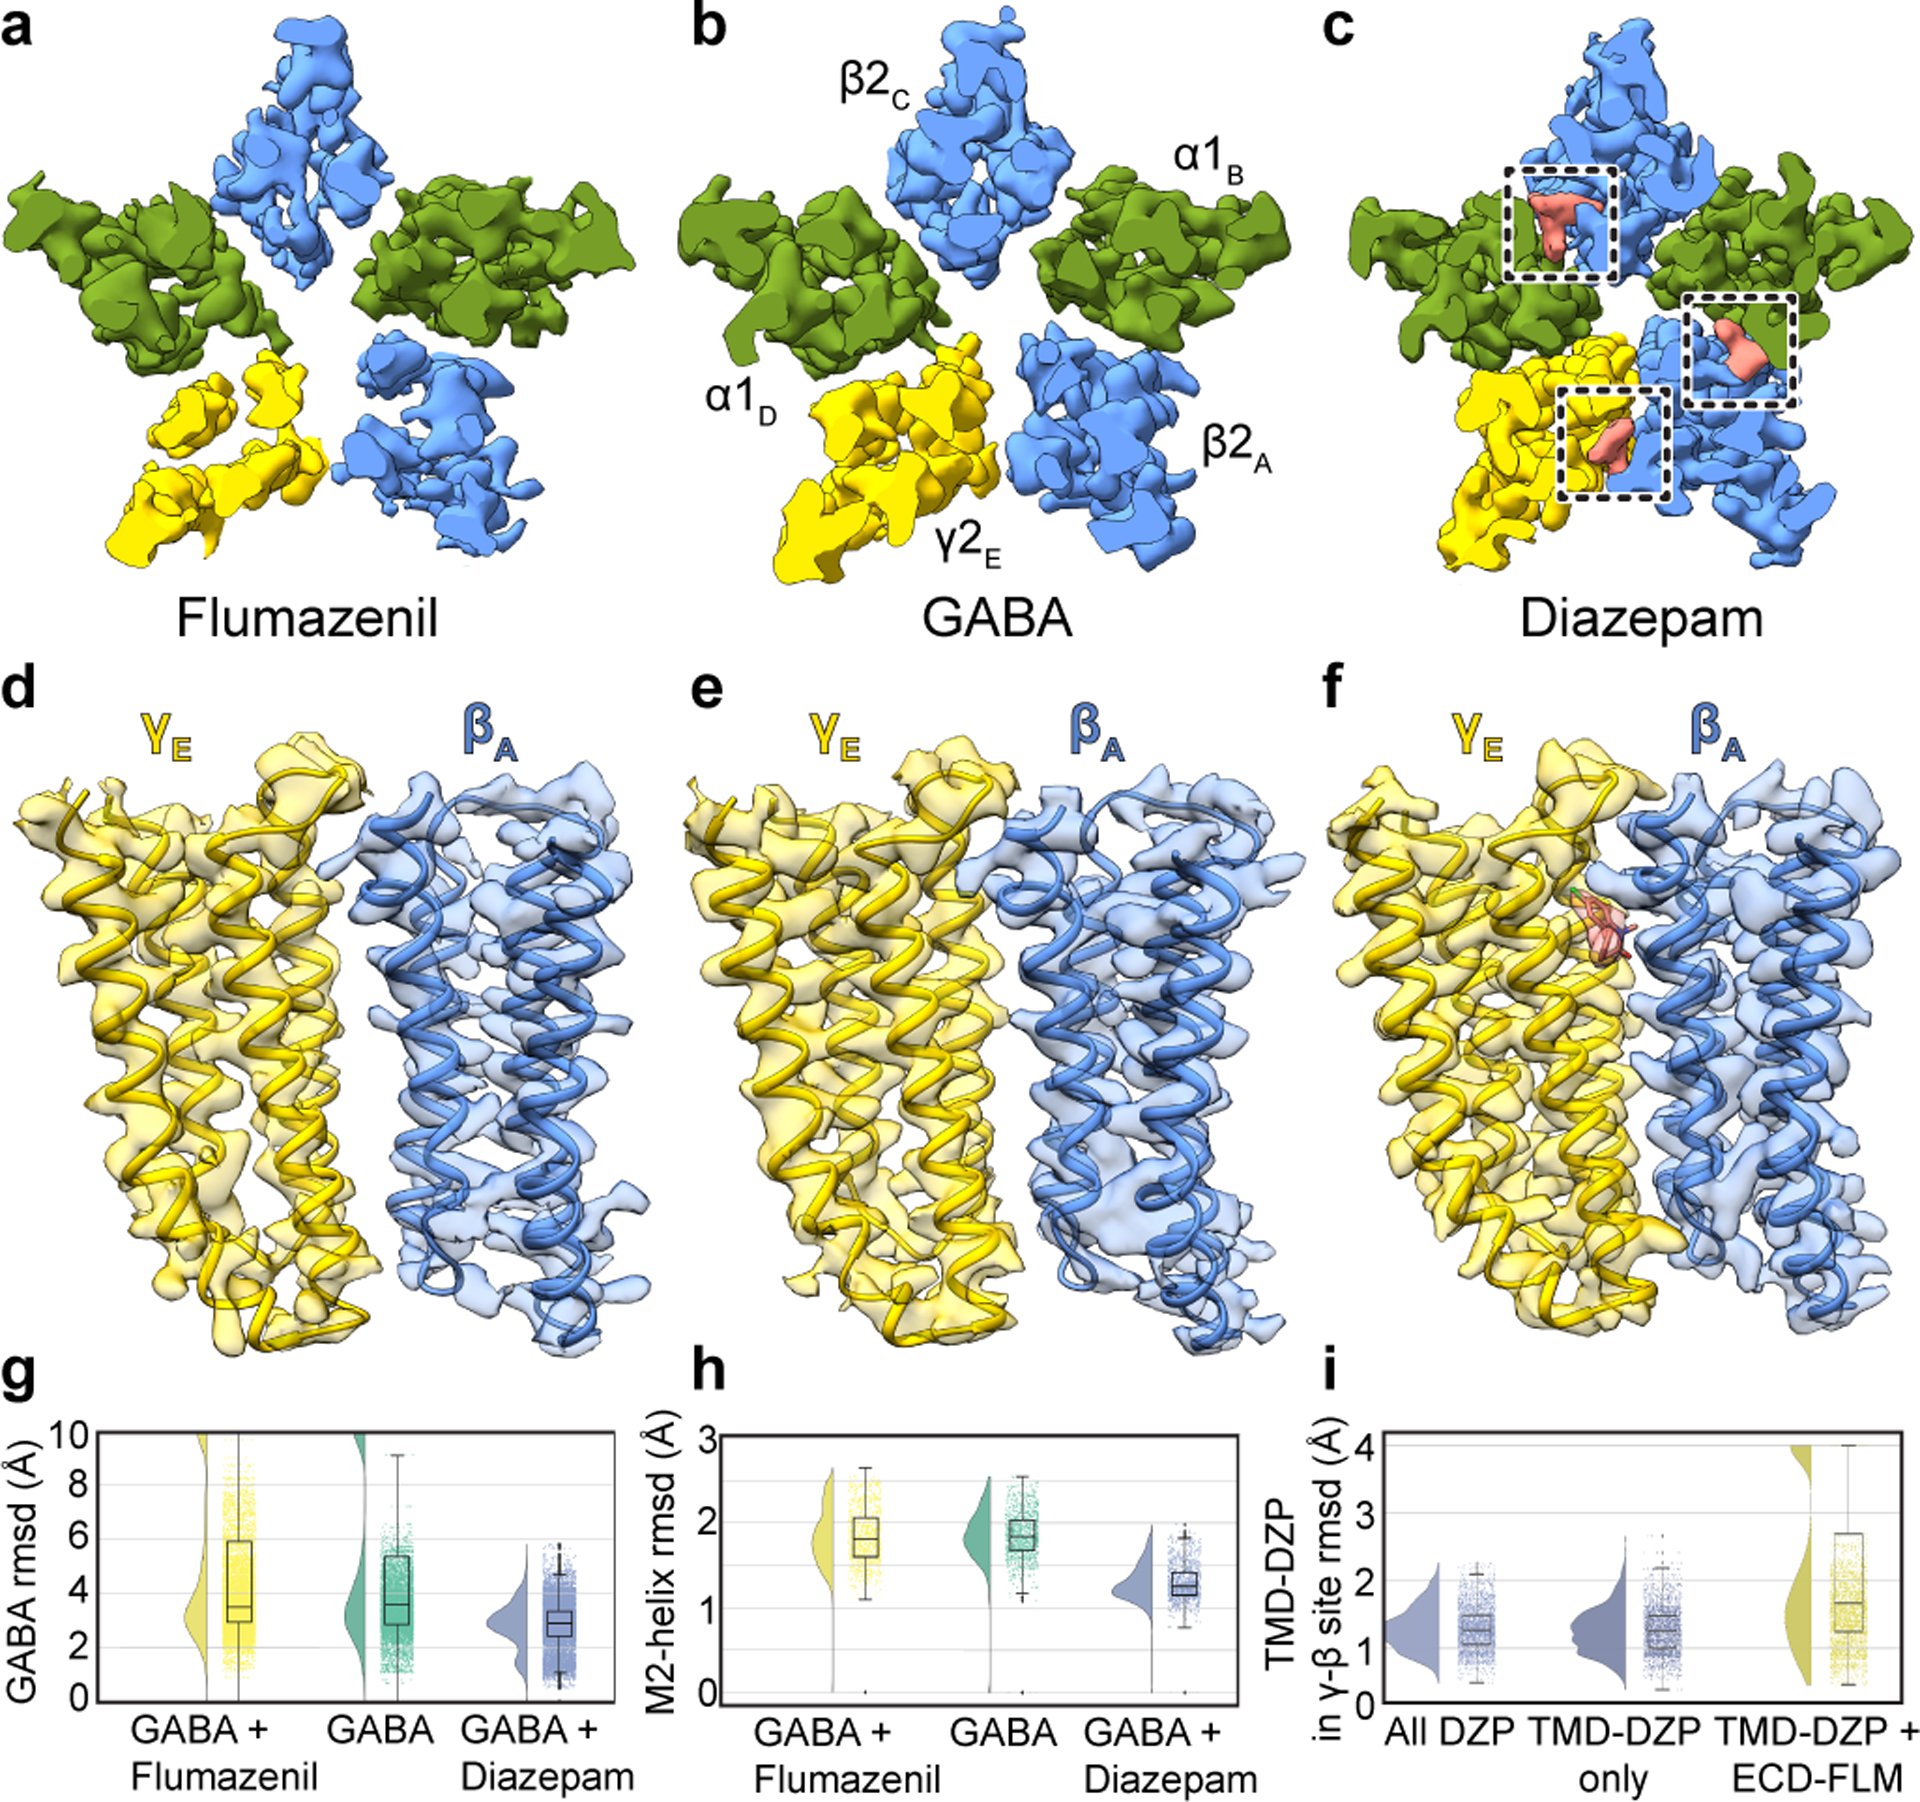
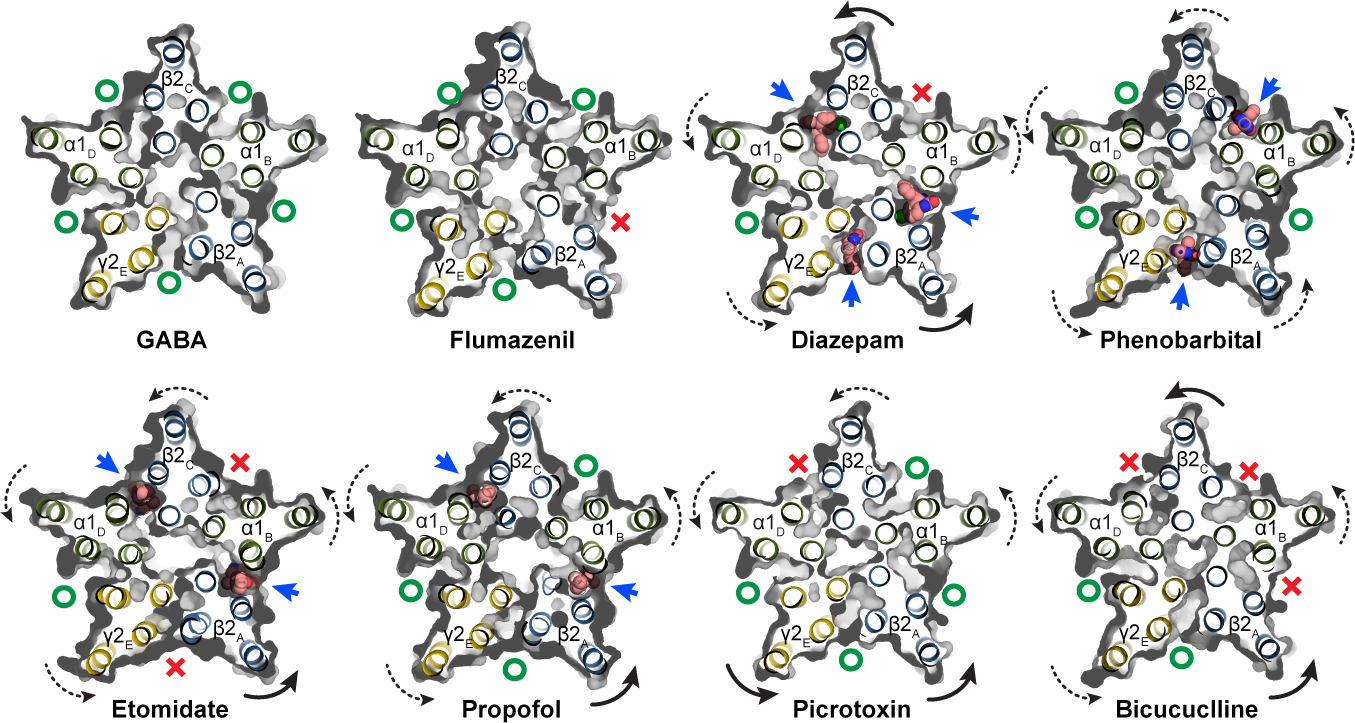
Most general anaesthetics and classical benzodiazepine drugs act through positive modulation of γ-aminobutyric acid type A (GABAA) receptors to dampen neuronal activity in the brain1-5. However, direct structural information on the mechanisms of general anaesthetics at their physiological receptor sites is lacking. Here we present cryo-electron microscopy structures of GABAA receptors bound to intravenous anaesthetics, benzodiazepines and inhibitory modulators. These structures were solved in a lipidic environment and are complemented by electrophysiology and molecular dynamics simulations. Structures of GABAA receptors in complex with the anaesthetics phenobarbital, etomidate and propofol reveal both distinct and common transmembrane binding sites, which are shared in part by the benzodiazepine drug diazepam. Structures in which GABAA receptors are bound by benzodiazepine-site ligands identify an additional membrane binding site for diazepam and suggest an allosteric mechanism for anaesthetic reversal by flumazenil. This study provides a foundation for understanding how pharmacologically diverse and clinically essential drugs act through overlapping and distinct mechanisms to potentiate inhibitory signalling in the brain.


Conflict of interest statement

Declaration of interests: The authors declare no competing interests.

Figures

Extended Data Figure 1:
Extended Data Figure 1:. Biochemistry, sample condition screening, and stability of atomistic MD simulations in brain lipids.
In 2018, our group reported the structure of the α1β2γ2 receptor in complex with GABA and flumazenil in detergent. While this initial study revealed details of the classical neurotransmitter and benzodiazepine binding sites, the structures showed an unanticipated asymmetric occluded state in the transmembrane region, where we observed the γ2 transmembrane domain (TMD) collapsed into the pore or structurally disordered. Structures in complex with GABA or with a nanobody modulator (unpublished), also in detergent, exhibited very low resolution in the membrane domain that precluded detailed analysis. Structures of the α1β3γ2 receptor in lipid nanodiscs were reported more recently, with a well-ordered and approximately symmetric transmembrane domain,. We first sought to improve order and prevent collapse of the symmetric transmembrane domain (TMD) quaternary structure by optimizing lipid reconstitution of the GABA plus flumazenil receptor complex as a benchmark. Panel a shows analytical size-exclusion chromatography of the α1β2γ2 receptor at different stages of preparation of the GABA plus flumazenil complex, which we used to benchmark the reconstitution approach: receptor in detergent, increasing in size after exchange into nanodiscs, then a further increase in size after addition of Fab. Inset SDS-PAGE shows relatively pure nanodisc-Fab-receptor complex, which was used for grid preparation. Panels b-e show TMD z-slices of 3D reconstructions from preparations with GABA, flumazenil and various membrane mimetics. Inset numbers are resolution values from the reconstructions and white dashed lines highlight subunit boundaries. Panel b is from the dataset published in 2018. Panel c is from sample purified in DDM supplemented with brain lipids, more symmetric but very low resolution. Panel d is from protein purified in DDM supplemented with soy polar lipid extract (Avanti) and cholesteryl hemisuccinate (CHS, Anatrace) and exchanged in MSP1E3 nanodiscs containing soy lipids, highly asymmetric. Panel e is the condition used to obtain the GABA plus flumazenil complex in this study. We applied this purification and nanodisc reconstitution approach to all other complexes. Panel f shows results from atomistic MD simulations validating the stability of these complexes in a brain-lipid environment, as well as differential dynamics in the presence of different ligands. After embedding our models in mixed membranes with expected brain-lipid proportions and equilibrating with coarse-grained simulations, cholesterol and phosphatidylinositol 4,5-bisphosphate (PIP2) were found to accumulate at the protein surface, particularly at subunit interfaces (Supplementary Videos 9 and 10, respectively). Such interactions could contribute to the symmetrizing effect of brain lipids relative to detergent or other lipid mixtures. Subsequent quadruplicate 500-ns all-atom MD simulations of all 8 structures reported in this work were largely stable, converging to ≤ 3 Å root-mean-squared deviation (rmsd) for all protein Cα atoms. This panel shows deviations from starting conformations (rmsd, Å) of protein Cα atoms in α1β2γ2 receptor structures. Each trace represents one of four 500-ns replicates. Panel g illustrates an alternative conformation observed in multiple exploratory simulations of the flumazenil-bound structure (gray) with flumazenil removed. Within 200 ns, the γ M2-helix spontaneously translocates to block the pore (snapshot at 500 ns, colored), supporting a flexible conformational repertoire for this subunit. Transition is tracked over time (red–blue) by the position of P-2′ in α and γ. Panel h presents simulation results for propofol stability at all five interfacial TMD sites, with probability distributions at left, and raw data (n = 500 samples from 4 simulations, see Methods) plus boxplots indicating sample median, interquartile range (25th-75th percentiles), minimum–maximum range, and outliers at right.. Propofol was inserted at the α-β, α-γ and γ-β sites by symmetry superposition of the resolved β-α propofol. In quadruplicate simulations of >400 ns each, the inserted propofol molecules were not stably bound, sampling a broad distribution up to 8 Å rmsd from initial poses. In contrast, propofol at the β-α interfaces remained within 4 Å rmsd of its initial poses. Thus, simulations support a preference for propofol binding at the β-α over other interfaces.
Extended Data Figure 2:
Extended Data Figure 2:. Detailed cryo-EM processing flowchart for GABA plus flumazenil complex.
Panel a shows a representative cryo-EM image. Panel b shows projection images from the final selected 2D classes. Panel c shows 3D classification results; good classes selected for further processing are boxed in red and in lower row have TMD z-slices shown. Note fuzzy nanodisc appearance adjacent to γ2 subunit, consistent with conformational heterogeneity in this region. Panel d shows 3D maps from a second round of 3D classification, from which particle from four classes (red boxes) were selected and used to generate map shown in panel e. Signal subtraction and γ2 subunit focused 3D classification resulted in the map in panel f.
Extended Data Figure 3:
Extended Data Figure 3:. Overall and local map resolution and global map-model agreement.
For each structure, the sharpened map is colored by local resolution, and map FSC (upper right) and map-model FSC (lower right) plots are shown. For the flumazenil complex, two maps were used in building, a higher resolution map that had weak γ-TMD density, and a lower resolution map with strong γ-TMD signal. Shown here for this structure is the lower resolution map with strong signal for the whole receptor. Both maps will be deposited for this flumazenil complex, and relevant statistics for these maps are shown in Extended Data Tables 1, 2.
Extended Data Figure 4:
Extended Data Figure 4:. Map quality and ligand binding sites.
Each panel a-h shows a side view and a TMD slice from the experimental density map, accompanied by the chemical structure of the ligand in that complex. Note, GABA is present in all structures except the bicuculline complex. Solid boxes highlight GABA binding sites; dashed boxes highlight allosteric ligands (including picrotoxin) binding sites. Propofol binding sites at subunit interfaces in f are distinct from the intrasubunit sites identified initially in the prokaryotic GLIC channel, and similar in location but distinct in pose compared to the intersubunit site mutants of GLIC.
Extended Data Figure 5:
Extended Data Figure 5:. Lipid interactions in TMD.
Panel a shows an atomic model overview of the TMD sites for possible lipid binding in the GABA plus propofol complex; densities for putative lipids are shown in tan. A subset of these are consistent with those modeled as POPC in the α1β3γ2 structures,. Panels b-e show side views of lipid density at the different subunit interfaces. The lipid density maps shown were generated using the unsharpened map. Panels f-h are made from the GABA plus diazepam complex structure. Panel f shows an atomic model overview of the TMD sites for possible lipid binding; densities for putative lipids are shown in tan. Panels g and h show side views of potential lipid density at the subunit interfaces.
Extended Data Figure 6:
Extended Data Figure 6:. Representative map quality and model fit and structural analysis of GABA alone, diazepam and flumazenil complexes.
Semitransparent surface is shown for central ligand and contacting side chains for panels a-d. Panel a shows GABA site at chain A-B β-α interface in GABA alone structure. The two β-α GABA sites from the structure superimpose nearly perfectly and do not shed light on the differences in functional contributions found in electrophysiology studies with concatamers. Structures of apo receptor may be essential in identifying structural differences in the two GABA sites. Panel b shows flumazenil site at α-γ interface; panel c shows diazepam at same ECD interface in its structure. Panel d shows bicuculline site at same interface as panel a. Panel e shows picrotoxin site in TMD; here, density is shown for ligand and all nearby protein structure elements. Panel f shows superposition of two GABA plus flumazenil complexes, one from the detergent condition and one from this study in brain lipids, to illustrate absence of differences in backbone conformation. Note, loops that interact with the TMD do vary in conformation. Panel g shows detail of flumazenil site from the superposition in panel f. Panels h and i show superpositions of three structures from the current study: GABA alone, GABA plus diazepam and GABA plus flumazenil, focused on the two GABA binding sites. Panel j shows calculated interface areas and interaction energies for each subunit pair, for each of the benzodiazepine-related structures.
Extended Data Figure 7:
Extended Data Figure 7:. Agonist and benzodiazepine complexes.
Panels a-c focus on ECD binding sites viewed from synaptic perspective; a, Overview of the diazepam complex. Panel b, position of diazepam with ligand map quality shown; side chains shown for residues contacting diazepam. Panel c, superposition of flumazenil and diazepam complexes. Panel d shows the three TMD sites identified for diazepam. Panels e and f show binding site details for diazepam at β-α and γ-β interfaces. The two enantiomeric conformations of diazepam identified in the TMD sites are in panel g. Panels h-i show snapshots from MD simulations viewed from the extracellular side. Extracellular GABA and benzodiazepines are shown as sticks, colored by frame (red-blue scale). Panel h, flumazenil-bound simulation with GABA in the upper site unbinding within 100 ns (pink-blue peripheral sticks). Panel i, diazepam-bound simulation with GABA retained in both orthosteric sites. Subunit subscripts denote chain ID. Stick representation is shown for residues within van der Waals contact range.
Extended Data Figure 8:
Extended Data Figure 8:. Ligand site comparisons among α1β2γ2, α1β3γ2 and GluCl structures, and panel of pore conformations.
Panels a and b show superpositions of the GABA and diazepam ECD binding sites from the α1β2γ2 receptor (this study; subunits and ligands are colored) and the α1β3γ2 receptor (in grey), respectively. Panel c shows a superposition similar to those in a and c but for the bicuculline complexes (N,N-dimethyl higher affinity form from this study; bicuculline (single N-methyl) for α1β3γ2 in grey). Panels d and e compare picrotoxin binding sites from three structures: this study, the α1β3γ2 structure and GluCl. The results suggest picrotoxin can bind to multiple conformations at different depths of the pore. GluCl is most widely open and picrotoxin binds most deeply; in that study, picrotoxin was used as a probe for an open-state conformation. The pore is more tightly closed in α1β3γ2 than in α1β2γ2, which may allow picrotoxin to bind more deeply in the latter structure. In GluCl and in α1β2γ2, the picrotoxin isoprenyl tail orients toward the cytosol; in α1β3γ2, tail orients toward extracellular surface. This orientation allows in GluCl for favorable interactions between the “basket” oxygens and the polar 2′ residues. The α1β2/β3γ2 receptors are more hydrophobic at the 2′ position, which may also explain favorable positioning of picrotoxin higher in the pore, where in the α1β2γ2 structure these oxygens are likely to make hydrogen-bonding interactions with conserved 6′ threonine hydroxyls. Panel f shows a sequence alignment of GABAA subunit M2 helices. Red boxes highlight residues potentially important in picrotoxin binding; in bold are the 15′ residues that play a role in anesthetic selectivity and sensitivity. Panel g shows pore conformational states for all ligand complexes, with opposing β1 and γ2 M2 α-helices shown as ribbons with pore-lining side chains shown as sticks. Purple and green spheres illustrate shape of the pore. Boxed distances in the pore are diameters at the desensitization gate (−2′) and resting gate (9′) positions. Panel h shows free energies for chloride ion permeation along the pore axis (cytoplasmic side down, with −2′ gate at 0 nm), for representative α1β2γ2 complexes. Overlaid plots show the energy barrier at the 9′ hydrophobic gate (~2 nm) in the bicuculline complex (orange) to be partially relieved in the GABA complex (green), and further relieved in complexes with GABA + phenobarbital or + propofol (light or dark blue, respectively). Panel i shows all α1β2γ2 structures reported in this work (n = 8 independent structures), plotted along dominant principal components (PCs) calculated for the TMD. Snapshots of a simulated transition between the GABA and bicuculline complexes (dark-to-light crosses) show that the GABA + picrotoxin complex maps along this pathway. GABA + diazepam and IV anesthetics bound structures (GABA + diazepam, dark blue; etomidate, gray; phenobarbital, orange; propofol, purple) cluster at lower left, distinct from GABA-alone or flumazenil- or inhibitor-bound states.
Extended Data Figure 9:
Extended Data Figure 9:. Ion pore conformation and TMD subunit interface packing in α1β2γ2 vs. α1β3γ2 structures.
Panels a-b show pore conformations for α1β2γ2 (this study) and α1β3γ2 structures bound by GABA plus diazepam, respectively, with opposing β1 and γ2 M2 α-helices shown as ribbons and pore-lining side chains shown as sticks. Purple and green spheres illustrate shape of the pore; purple is for radii > 2.8 Å; green is 1.4–2.8 Å; red is < 1.4 Å. Distances on right side of pore are radii at the desensitization gate (−2′) and resting gate (9′) positions. Panel c compares these two structures in the form of a pore radius vs. distance along the pore plot. Structures were aligned at y=0 at the level of the −2′ desensitization gate. Panels d-f and g-i make the same comparisons, but for the bicuculline and GABA plus picrotoxin complexes, respectively. Panel j compares interface area buried per subunit interface (Å2, ECD+TMD) for representative anion-selective receptors; top three are homopentamers where the area given is the average from all interfaces, while for the two bicuculline structures the area comes from the average of the two β-α interfaces. Comparison is limited to anion-selective receptors due to absence of ordered intracellular domains; eukaryotic cation-selective receptors contain intracellular domains that contribute to interface surface area. Panel k tabulates buried TMD subunit interface areas between pairs of GABAA receptor structures to illustrate tighter packing in the α1β3γ2 receptor structures.
Extended Data Figure 10:
Extended Data Figure 10:. Nanodisc sizes correspond to lipid ratio used in reconstitution.
Panels a-c compare experimental EM maps (with docked structures), low-pass filtered to 10 Å resolution, between matched α1β2γ2 and α1β3γ2 ligand complexes. Panel d compares the reconstitution approach from the current study with the on-column approach used to obtain the α1β3γ2 receptor structures,. Asterisks indicate steps we hypothesize give rise to the observed different nanodisc sizes: washing with lipid-free detergent buffer removes lipids, and the step of collecting affinity resin by centrifugation removes excess lipids, such that when the MSP2N2 scaffold and biobeads are added, there are no extra lipids to fill the large scaffold.
Extended Data Figure 11:
Extended Data Figure 11:. Example electrophysiological recordings with cryo-EM construct.
All recordings were made in whole-cell voltage-clamp mode at −75 mV with transiently-transfected HEK cells. In panel a, WT, full-length receptor compared to cryo-EM construct, response to application of GABA. All remaining recordings are with the EM construct. In panel b, a representative response is shown for application of GABA, then GABA plus diazepam, then GABA plus flumazenil, then GABA plus diazepam plus flumazenil. In panel c, application of GABA, then GABA plus phenobarbital. In d, application of GABA, then GABA plus etomidate. In e, application of GABA, then GABA plus propofol. In f, application of GABA, then GABA plus methylated form of bicuculline. The patch clamp experiments were repeated 3 times independently.
Figure 1:
Figure 1:. Phenobarbital binding sites.
Panel a provides overview of atomic model of TMD viewed down channel axis from synaptic perspective; boxes highlight phenobarbital sites with ligand shown as spheres. Panel b shows the effect of mutation at the 15’ position of different subunits on fold potentiation of GABA activation by phenobarbital. The bars indicate mean ± SD, n = 7 (WT), 4 (αS270M), 5 (βN265M), 3 (γS280M) and 5 (double mutant) *, p < 0.01 ; ** p < 0.0001. “n=X” represents biologically independent patch clamp experiments with individual cells. Panels c and d show binding site details for phenobarbital at γ-β and α-β interfaces. H-bonds indicated with dashed line and distance.
Figure 2:
Figure 2:. Etomidate and propofol interactions.
Panels a and b show atomic model overview of the TMD sites for etomidate and propofol, respectively; ligands are shown as spheres. Subunit subscripts denote chain ID. Panels c and d show binding site details for one of the two equivalent β-α sites for each ligand. Experimental density for ligands is shown as semi-transparent surface.
Figure 3.
Figure 3.. Benzodiazepine sites and mechanism.
Panels a-c show z-slices in the TMD of cryo-EM density maps for the three complexes; boxes in c highlight diazepam (salmon) TMD sites. Panels d-f show map and model in TMD at the γ-β interface to illustrate large interfacial gap in flumazenil complex, smaller gap in GABA alone complex, and absence of a gap in diazepam complex. Panels g-i show stability (rmsd, Å) in benzodiazepine-related simulations, with probability distribution at left, and raw data (n = 500 samples from 4 simulations, see Methods) plus boxplots indicating median, interquartile (25th-75th percentiles) and minimum–maximum ranges at right. Panel g, diazepam-bound simulations (blue) exhibit stabilization of GABA over both orthosteric sites relative to flumazenil-bound (yellow) or GABA-alone (green) conditions. Panel h, stabilization of M2 helices in the presence of diazepam. Panel i, destabilization of the transmembrane γ-β interface in the presence of extracellular flumazenil, relative to either diazepam or no ligand at the extracellular α-γ interface.
Figure 4:
Figure 4:. Anesthetic cavity selectivity and conformation.
Models and molecular surfaces are shown from a perspective down the channel axis, at the level of the TMD binding sites identified for diazepam, phenobarbital, etomidate and propofol. Straight arrows indicate occupied binding sites with ligands shown as spheres. Curved arrows indicate rigid body subunit transformations relative to the GABA alone structure (dashed lines are minor; solid lines are major rotations/translations). Green “O’s” indicate open or partially open cavities; red “X’s” indicate closed-off cavities.

Similar articles

Cited by

References

    1. Hemmings HC Jr. et al. Emerging molecular mechanisms of general anesthetic action. Trends Pharmacol Sci 26, 503–510, doi:10.1016/j.tips.2005.08.006 (2005). - DOI - PubMed
    1. Forman SA & Miller KW Mapping General Anesthetic Sites in Heteromeric gamma-Aminobutyric Acid Type A Receptors Reveals a Potential For Targeting Receptor Subtypes. Anesth Analg 123, 1263–1273, doi:10.1213/ANE.0000000000001368 (2016). - DOI - PMC - PubMed
    1. Sieghart W & Savic MM International Union of Basic and Clinical Pharmacology. CVI: GABAA Receptor Subtype- and Function-selective Ligands: Key Issues in Translation to Humans. Pharmacol Rev 70, 836–878, doi:10.1124/pr.117.014449 (2018). - DOI - PubMed
    1. Sigel E & Ernst M The Benzodiazepine Binding Sites of GABAA Receptors. Trends Pharmacol Sci 39, 659–671, doi:10.1016/j.tips.2018.03.006 (2018). - DOI - PubMed
    1. Olsen RW GABAA receptor: Positive and negative allosteric modulators. Neuropharmacology 136, 10–22, doi:10.1016/j.neuropharm.2018.01.036 (2018). - DOI - PMC - PubMed

Publication types

MeSH terms