. 2020 Sep;585(7824):277-282.
doi: 10.1038/s41586-020-2682-1. Epub 2020 Sep 2.

Cancer SLC43A2 alters T cell methionine metabolism and histone methylation

Affiliations

Cancer SLC43A2 alters T cell methionine metabolism and histone methylation

Yingjie Bian et al. Nature. 2020 Sep.

Abstract

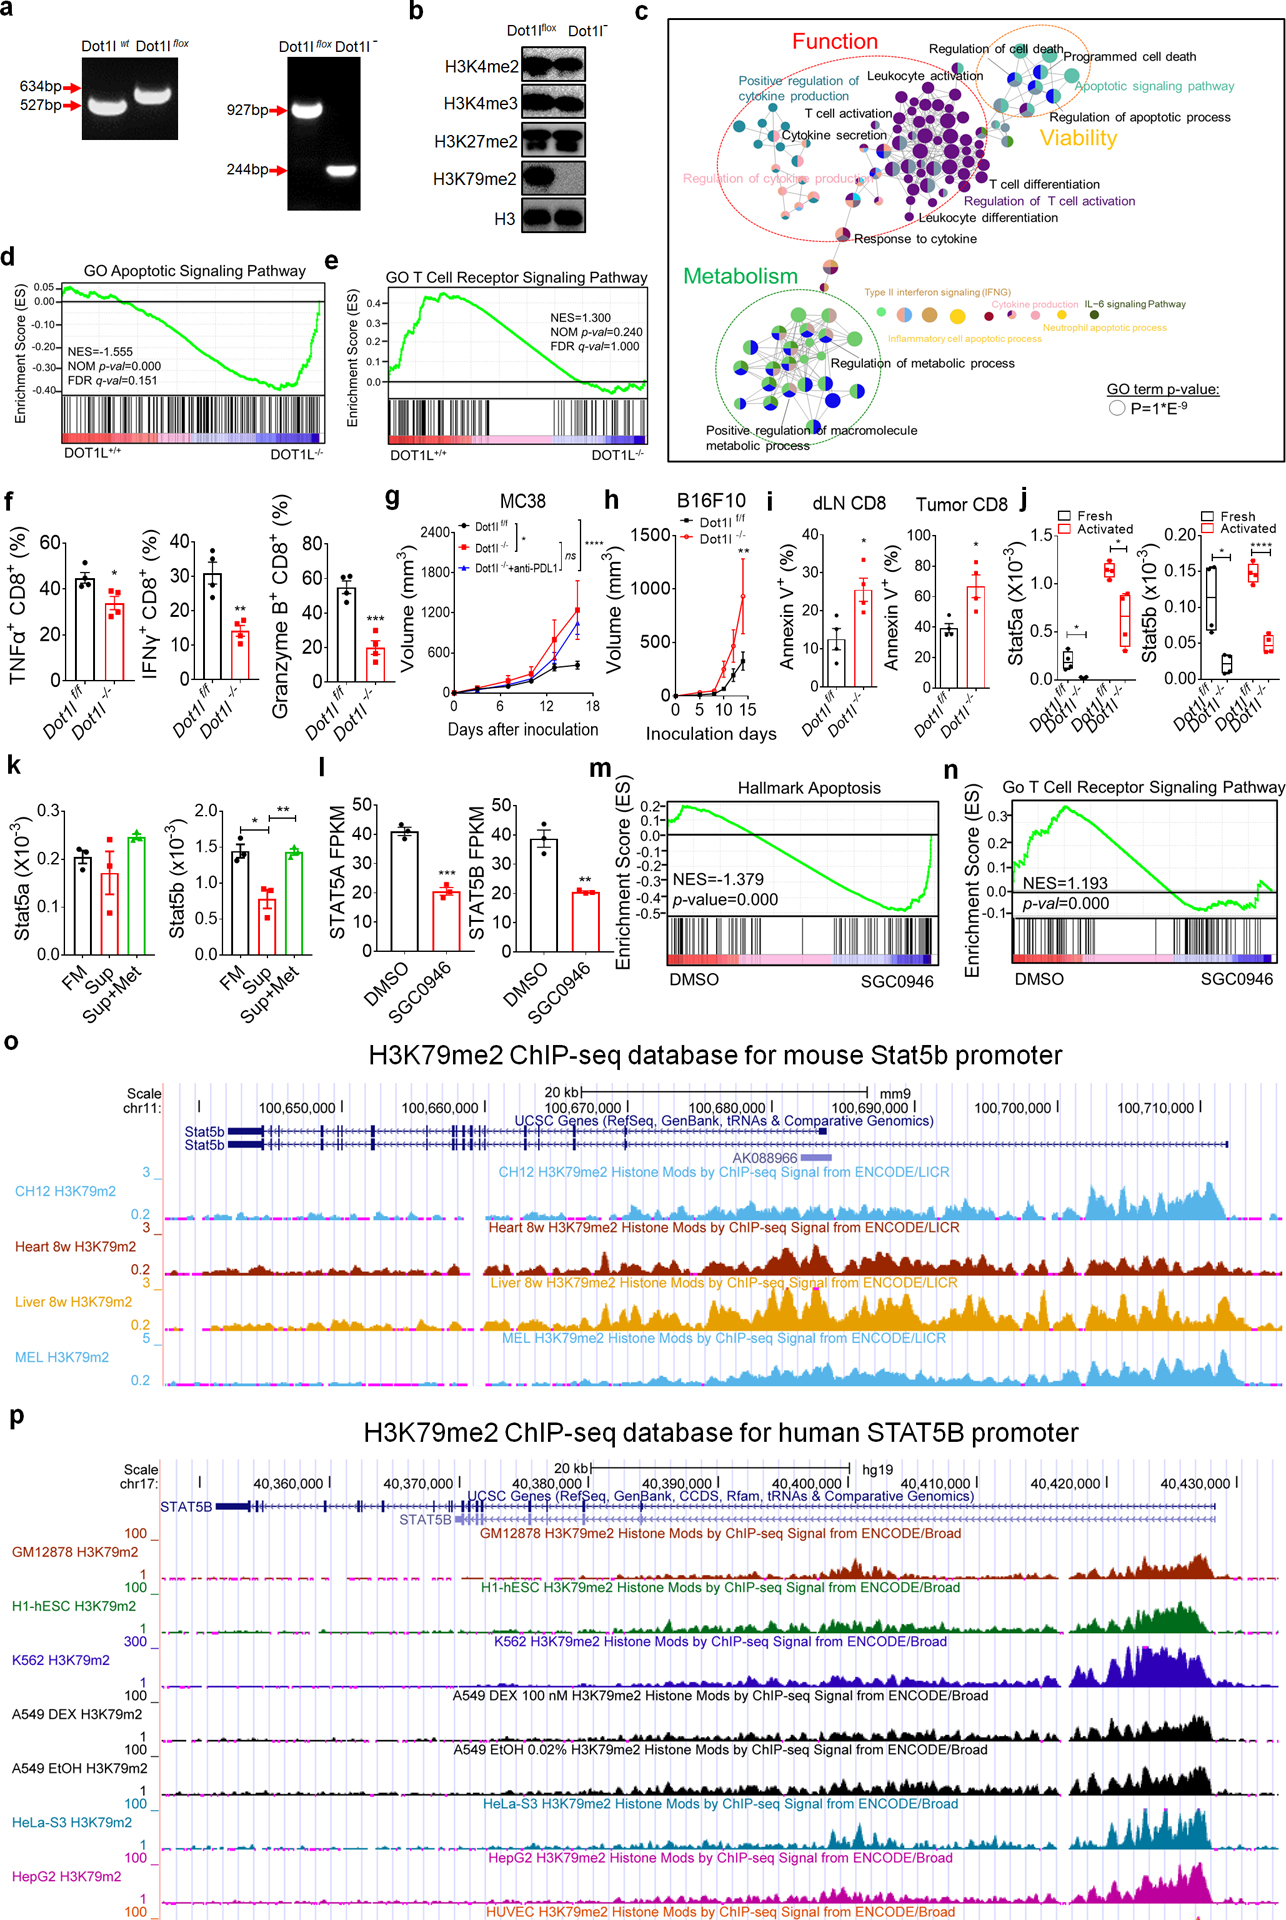
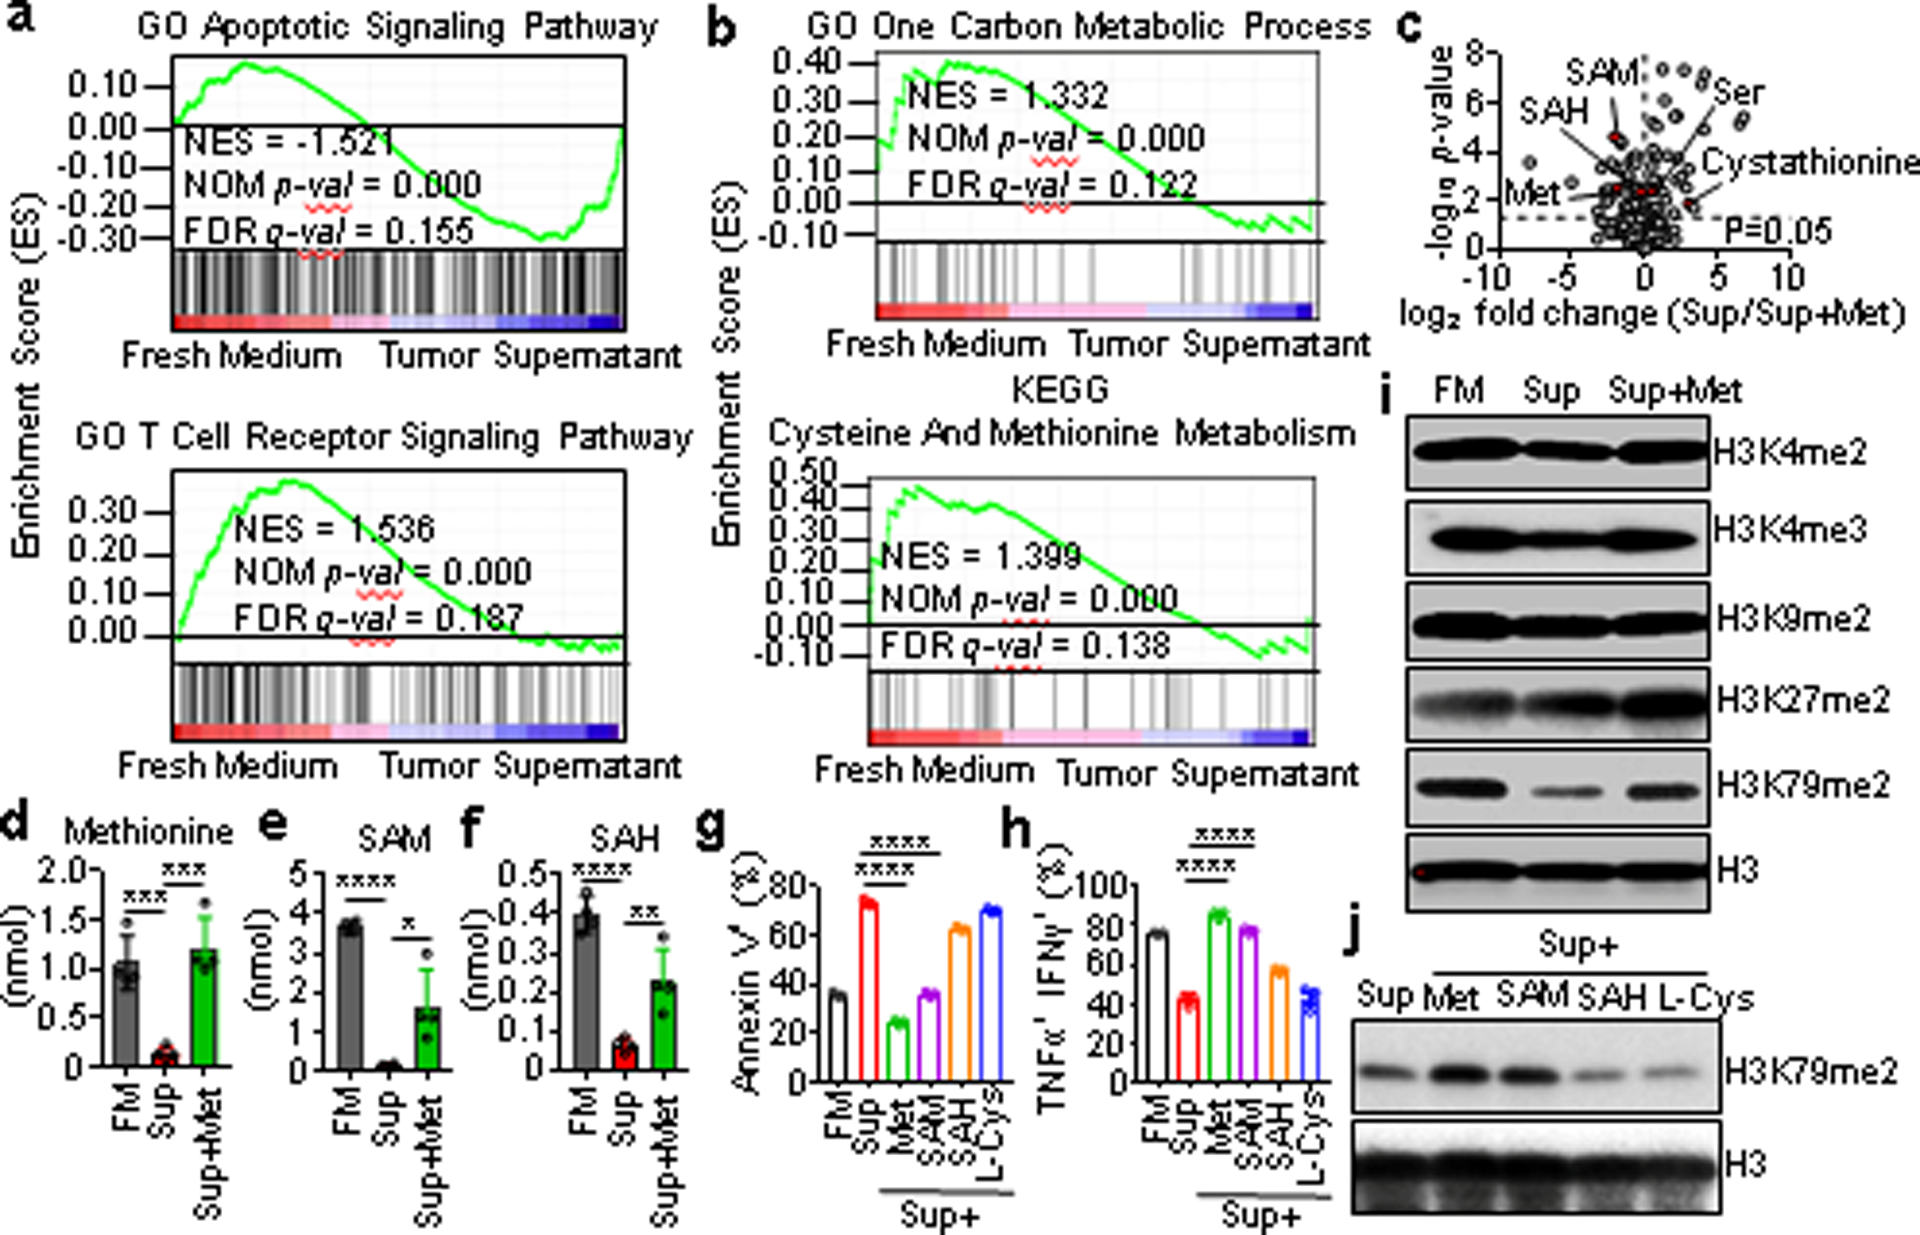
Abnormal epigenetic patterns correlate with effector T cell malfunction in tumours1-4, but the cause of this link is unknown. Here we show that tumour cells disrupt methionine metabolism in CD8+ T cells, thereby lowering intracellular levels of methionine and the methyl donor S-adenosylmethionine (SAM) and resulting in loss of dimethylation at lysine 79 of histone H3 (H3K79me2). Loss of H3K79me2 led to low expression of STAT5 and impaired T cell immunity. Mechanistically, tumour cells avidly consumed methionine and outcompeted T cells for methionine by expressing high levels of the methionine transporter SLC43A2. Genetic and biochemical inhibition of tumour SLC43A2 restored H3K79me2 in T cells, thereby boosting spontaneous and checkpoint-induced tumour immunity. Moreover, methionine supplementation improved the expression of H3K79me2 and STAT5 in T cells, and this was accompanied by increased T cell immunity in tumour-bearing mice and patients with colon cancer. Clinically, tumour SLC43A2 correlated negatively with T cell histone methylation and functional gene signatures. Our results identify a mechanistic connection between methionine metabolism, histone patterns, and T cell immunity in the tumour microenvironment. Thus, cancer methionine consumption is an immune evasion mechanism, and targeting cancer methionine signalling may provide an immunotherapeutic approach.


Conflict of interest statement

Declaration of Interests

The authors declare no competing interests.

Figures

Extended Data Fig. 1
Extended Data Fig. 1. Tumor cells outcompete T cells for methionine to impair T cell function.
a-c, Effect of tumor cells on T cell apoptosis. Tumor supernatants were collected from MC38 (a), CT26 (b), and human melanoma A375 (c) tumor cells cultured for 48 hours with media containing different concentrations of methionine (Met). Then, CD8+ T cells were cultured for 36 hours with these tumor supernatants (Sup) or fresh medium (FM). Apoptosis was determined by Annexin V staining. d, e, Effect of methionine on ID8 tumor infiltrating cells. T cells were cultured with fresh medium (FM), ID8 supernatant (Sup), and supernatant plus methionine (Sup+Met). T cell apoptosis (d) and cytokine production (e) were determined by FACS. f, g, Amino acid levels in ovarian cancer patient plasma. Amino acids were detected in healthy donor and ovarian cancer patient plasma by liquid chromatography mass spectrometry (LC-MS). (f) Volcano showed plasma free amino acid changes. Red dot showed methionine (Met). (g) Plasma methionine in ovarian cancer patients vs healthy controls. h, Methionine concentration in pre- and post- tumor cultured medium. i, j, Effect of amino acid supplementation on human T cell function. CD8+ T cells were cultured with A375 supernatants (Sup) supplemented with different amino acids for 36 hours. FACS analysis showed T cell apoptosis (i) and effector cytokines (j). k-m, Effect of glucose supplementation on the role of methionine-affected T cell apoptosis and function. n, Schematic figure showing tumor and T cell co-culture in the Transwell system. o, p, Effect of methionine on human CD8+ T cell (o) and tumor cell (p) viability, EC50 was determined by nonlinear regression (log (agonist) vs. response). FM: fresh medium. Sup: tumor supernatant. EAA: essential amino acid, NEAA: non-essential amino acid. Data are mean ± s.e.m. Information on sample sizes, experimental number, times, biological replicates, statistical tests, and P values is available in ‘Statistics and reproducibility’.
Extended Data Fig. 2
Extended Data Fig. 2. Tumor alters CD8+ T cell methionine metabolism to diminish H3K79me2.
a, Gene profile changes in CD8+ T cells. Mouse CD8+ T cells were cultured with fresh medium (FM), B16F10 tumor supernatant (Sup), or tumor supernatants plus methionine (Sup+Met) for 36 hours. Gene profile changes were analyzed by RNA-seq. b, Gene signatures were compared between groups from FM and Sup. Functionally grouped network of enriched categories was generated for the hub genes and their regulators using ClueGO. Visualization has been carried out using Cytoscape 3.7.1.c-e, GSEA plot showed recovery of TCR signaling pathway (c) and methionine metabolism signaling (d, e) in CD8+ T cells cultured with Sup+Met compared to Sup. f, Metabolites changes in CD8+ T cells cultured with FM, Sup and Sup+Met. Upper panel: Metabolites induced upon methionine supplementation. Lower panel: Metabolites suppressed upon methionine supplementation. g, The diagram of methionine cycle is shown. h, i, CD8+ T cells were cultured with FM, Sup, or Sup+Met for 36 hours. Metabolites related to the methionine cycle, including intracellular serine (h) and L-cystathionine (i), were detected by MS. j, k, Effect of tumor supernatants on CD8+ T cell histone methylation. Mouse (j) or human (k) CD8+ T cells were cultured with or without methionine (Met) for 36 hours with fresh medium (FM), CT26 and MC38 tumor supernatants (j), or human A375 tumor supernatants (Sup) (k). T cell histone marks were determined by Western blots. Data are mean ± s.e.m. Information on sample sizes, experimental number, times, biological replicates, statistical tests, and P values is available in ‘Statistics and reproducibility’.
Extended Data Fig. 3
Extended Data Fig. 3. Loss of H3K79me2 impairs T cell anti-tumor immunity through STAT5.
a, Genotyping for Dot1lf/f and Dot1l−/− mice by PCR. b, Effect of Dot1l knockout on histone marks in T cells. c-e, Gene signature comparison between Dot1l−/− and Dot1lf/f CD8+ T cells. Functionally grouped network of enriched categories was generated for the hub genes and their regulators using ClueGO. Visualization has been carried out using Cytoscape 3.7.1. (c). GSEA plot showed enriched apoptotic gene pathway (d) and impaired TCR signaling pathway (e) in Dot1l−/− CD8+ T cells. f, Effect of DOT1L deficiency on T cell function in MC38 tumor. MC38 cells were inoculated into Dot1lf/f and Dot1l−/− mice. Expression of TNFα, IFNγ, and granzyme B in tumor infiltrating CD8+ T cells was determined by FACS. g, Effect of anti-PD-L1 on tumor growth in Dot1l+/+ and Dot1l−/− mice. h, i, B16F10 cells were inoculated into Dot1l−/− and Dot1lf/f mice. Effect of T cell DOT1L deficiency on tumor growth (h) and T cell viability (i) were monitored. j, Real-time PCR showed Stat5a and Stat5b transcripts in fresh or anti-CD3/CD28 activated Dot1lf/f and Dot1l−/− CD8+ T cells. k, Real-time PCR showed Stat5a and Stat5b transcripts in activated CD8+ T cells cultured with fresh media (FM), B16F10 tumor supernatants (Sup), or supernatants plus methionine (Sup+Met) for 24 hours. l-n, RNA-seq showed the effect of DOT1L inhibitor (SGC0946) on human CD8+ T cells (Database: GSE108694). STAT5A and STAT5B (l) transcripts were quantified in human CD8+ T cells treated with DOT1L inhibitor SGC0946. GSEA enrichment plot showed enrichment of apoptotic gene pathway (m) and defects in T cell receptor related pathways (n) in human CD8+ T cells treated with DOT1L inhibitor. o, p, H3K79me2 ChIP-seq in ENCODE database showing Stat5b promoter in mice (o) and humans (p). Data are mean ± s.e.m. Information on sample sizes, experimental number, times, biological replicates, statistical tests, and P values is available in ‘Statistics and reproducibility’.
Extended Data Fig. 4
Extended Data Fig. 4. Methionine supplementation promotes T cell anti-tumor immunity.
a, b, H3K79me2 (a) and STAT5 (b) levels in CD8+ T cells from tumor draining lymph node (dLN) and tumor in B16F10 bearing mice. c, d, H3K79me2 (c) and STAT5 (d) levels in CD8+ T cells from spleen and tumor ascites in ID8 bearing mice. e, H3K79me2 levels in CD8+ T cells from healthy peripheral blood and human ovarian cancers ascites. f, g, H3K79me2 (f) and STAT5 (g) levels in CD8+ T cells from healthy human blood and human ovarian cancer omentum tissues. h, i, FACS showed H3K79me2 and STAT5 levels in human tumor infiltrating CD8+ T cells. j-m, Effect of methionine on human tumor infiltrating CD8+ T cells. Human colorectal cancer infiltrating CD8+ T cells were cultured with or without methionine. T cell cytokine production (j, k), H3K79me2 (l), and STAT5 (m) were analyzed by FACS. One representative of four is shown. n, Effect of methionine supplementation on apoptosis of tumor infiltrating CD8+ T cells and ID8 tumor cells in vivo. ID8 tumor bearing mice were treated with methionine or PBS. T cell and tumor cell apoptosis was determined by FACS. o, Methionine levels in ID8 tumor after methionine or PBS treatment. p-r: Effect of anti-PD-L1 on methionine-affected CT26 tumor progression. Mice bearing CT26 tumor were treated with anti-PD-L1, methionine, and their combination. Tumor volume (p), T cell tumor infiltration (q) and apoptosis (r) were assessed. Data are mean ± s.e.m. Information on sample sizes, experimental number, times, biological replicates, statistical tests, and P values is available in ‘Statistics and reproducibility’.
Extended Data Fig. 5
Extended Data Fig. 5. Tumor SLC43A2 correlates to poor T cell immunity
a, b, Effects of SLC inhibitors (BCH or MeAIB) on tumor cell affected CD8+ T cell apoptosis (a) and cytokine production (b). c, Real-time PCR showed SLC transporter transcripts in activated CD8+ T cells and B16F10 tumor cells. d, Western Blot showed SLC43A2 and SLC7A5 proteins in activated CD8+ T cells and tumor cells. e, Western Blot showed SLC43A2 protein in human CD8+ T cells and human tumor cells. f, Western Blot showed SLC43A2 knockdown efficiency in B16F10 cells. g, Effect of tumor cell SLC43A2 knockdown on methionine consumption. WT (scramble) and sh-SLC43A2 tumor cells were cultured with fresh medium containing 30 μM methionine for 24 hours. Methionine concentration was measured by MS in fresh medium and supernatants. h, Wild type and sh-SLC43A2 B16F10 tumor growth in Dot1l−/− mice. i, Wild type and SLC43A2 knockdown B16F10 tumor growth in Rag1−/− mice. j, Effect of tumor SLC43A2 knockdown on T cell tumor infiltration in WT or sh-SLC43A2 B16F10 bearing mice. k, Effect of SLC43A2 knockdown and the combination of anti-PD-L1 on B16F10 bearing mice. l, Western Blot showed SLC43A2 knockdown efficiency in ID8-luc cells. m, Wild type and SLC43A2 knockdown ID8-luc tumor growth in Rag1−/− mice. n, o, Effect of tumor SLC43A2 knockdown on ID8 growth (n) and T cell tumor infiltration in WT or sh-SLC43A2 ID8 bearing mice. p, T cell tumor infiltration in B16F10 bearing mice treated with BCH, anti-PD-L1, or their combination. q-s, Kaplan-Meier survival curves showed the prognostic values of SLC43A2 expression in different types of tumor: Cholangiocarcinoma (CHOL, q), low grade glioma (LGG, r), and lung squamous cell carcinoma (LUSC, s). The raw data was from TCGA. t-y, The analysis was based on single cell RNA-seq data (GSE72056). t, SLC43A2 transcripts were compared in tumor cells versus tumor infiltrating T cells from the same human melanoma tissues. u, GSEA plots showed methionine metabolic process genes in tumor cells expressing high versus low SLC43A2. v, Correlation was analyzed between CD8A, CD8B, IFNG transcripts in T cells and SLC43A2 transcripts in tumor cells in the same human melanoma tissues. w-y, GSEA enrichment plot analysis showed defective pathways in tumor infiltrating T cells in melanoma patients with high tumor SLC43A2 compared to low tumor SLC43A2. The pathways included T cell methionine metabolic process (w), histone methylation (x), and IFNγ production (y). Data are mean ± s.e.m. Information on sample sizes, experimental number, times, biological replicates, statistical tests, and P values is available in ‘Statistics and reproducibility’.
Extended Data Fig. 6
Extended Data Fig. 6. Graphical model.
Fig.1
Fig.1. Tumor cells outcompete T cells for methionine to impair T cell function
a-c, Effect of amino acids on T cell apoptosis and effector cytokines. Activated mouse CD8+ T cells were cultured with complete medium (CM) or media with individual amino acid omission for 36 hours. d, e, Effect of tumor supernatants on T cell apoptosis. CD8+ T cells were cultured for 36 hours with ID8 (d) and B16F10 (e) supernatants. f, Mass spectrometry (MS) detection of amino acids consumption by tumor culture. g, h, Effect on T cell apoptosis and cytokines by amino acid supplementation in tumor supernatant. CD8+ T cells were cultured with B16F10 supernatants supplemented with amino acids for 36 hours. i, j, Apoptosis of T cells and tumor cells by methionine competition. B16F10 cells and CD8+ T cells were cultured at different ratios for 72 hours in Transwell with 30 or 100 μM methionine. k, l, Effect of methionine on CD8+ T cell (k) and tumor cell (l) viability. Data are mean ± s.e.m. Sample sizes (n), P values, statistical tests and number of times experiments were replicated are listed in ‘Statistics and reproducibility’.
Fig. 2
Fig. 2. Tumor alters CD8+ T cell methionine metabolism to diminish H3K79me2
a, b, GSEA plot showed enriched apoptotic and TCR signaling pathways (a), and defective methionine metabolism signaling (b) in tumor supernatant (Sup) cultured CD8+ T cells. c-f, Methionine pathway metabolic changes in CD8+ T cells cultured with FM, Sup and Sup+Met. Volcano showed metabolites changes between groups from Sup and Sup+Met (c). Intracellular methionine (d), SAM (e), and SAH (f) were detected by MS. g, h, Effect of metabolites supplementation on CD8+ T cell apoptosis (g) and cytokines (h). i, Effect of tumor supernatants on CD8+ T cell histone methylation. j, Role of methionine metabolites supplementation in CD8+ T cell H3K79 methylation. Data are mean ± s.e.m. Sample sizes (n), P values, statistical tests and number of times experiments were replicated are listed in ‘Statistics and reproducibility’.
Fig. 3
Fig. 3. Loss of H3K79me2 impairs T cell anti-tumor immunity through STAT5
a-c, CD8+ T cells were treated with EPZ004777 for 48 hours. Western Blot showed H3K79me2 in CD8+ T cells (a). FACS demonstrated CD8+ T cell apoptosis (b) and cytokines (c). d, Western Blot showed H3K79me2 in Dot1lf/f and Dot1l−/− CD8+ T cells. e, f, Effect of DOT1L deletion on CD8+ T cells apoptosis (e) and cytokines (f). g-i, Effect of T cell DOT1L deficiency on MC38 growth (g, h) and T cell viability (i). j, k, Effect of methionine supplementation on Dot1lf/f and Dot1l−/− CD8+ T cells apoptosis (j) and cytokines (k). l, GSEA plot showed enriched apoptotic pathway in Dot1l−/− CD8+ T cells. m, Heat map showed Jak-Stats mRNA levels in mouse Dot1l−/− vs Dot1lf/f CD8+ T cells. n, Western blot showed STAT5 and p-STAT5 in Dot1lf/f (f/f) and Dot1l−/− (−/−) CD8+ T cells. o, Western blot showed STAT5 and p-STAT5 in CD8+ T cells cultured with fresh medium (FM), Supernatant (Sup), and Sup supplemented with different metabolites (Sup+). p, ChIP assay showed H3K79me2 occupancy on the Stat5b promoter in CD8+ T cells. q, ChIP assay showed H3K79me2 occupancy on the Stat5b promoter in CD8+ T cells cultured with FM, Sup, or Sup+Met. Data are mean ± s.e.m. Sample sizes (n), P values, statistical tests and number of times experiments were replicated are listed in ‘Statistics and reproducibility’.
Fig. 4
Fig. 4. Methionine supplementation in tumor restores T cell immunity.
a-e, Methionine supplementation restored T cell immunity in B16F10-bearing mice. Tumor growth (a), tumor infiltrating CD8+ T cell H3K79me2 (b) and STAT5 (c) were monitored. FACS showed intratumor CD8+ T cell apoptosis (d) and cytokines (e). f-h, Methionine supplementation restored T cell immunity in ID8-bearing mice. Tumor growth was monitored by bioluminescence imaging (f). FACS showed ascites CD8+ T cell (g) and intratumor CD8+ T cell cytokines (h). i-l, Studies on colorectal cancer patients treated with methionine. Western blot showed p-STAT5 and H3K79me2 in peripheral CD8+ T cells prior and post methionine treatment (i). FACS showed IL-2+ T cells (j), CD8+ T cell effector cytokines (k) and apoptosis (l) in patients prior and post methionine treatment. Data are mean ± s.e.m. Sample sizes (n), P values, statistical tests and number of times experiments were replicated are listed in ‘Statistics and reproducibility’.
Fig. 5
Fig. 5. Tumor cells outcompete T cells for methionine via SLC43A2
a, b, Effects of supernatants from sh-SLC43A2 tumors on T cell apoptosis (a) and cytokines (b). c-e, Effects of tumor SLC43A2 knockdown on T cell apoptosis (c), cytokines (d) and H3K29me2 modification (e). CD8+ T cells were co-cultured with wild type and sh-SLC43A2 B16F10 cells in Transwell in media containing with 30 μM methionine. CD8+ T cell apoptosis (c), cytokines (d) and H3K79me2 (e) were determined by FACS and Western Blot after 72 hours. f, g, Effect of tumor SLC43A2 knockdown on tumor growth (f) and tumor T cells function (g). h-l, Effect of the combination of BCH and anti-PD-L1 on B16F10 (h, i) and ID8 (j-l) bearing mice. Tumor growth (h, j, k), and TNFα+, IFNγ+ and granzyme B+ CD8+ T cells (i, l) were compared. m, SLC43A2 transcripts in tumors and paired adjacent normal tissues in several types of tumor in TCGA. Data are mean ± s.e.m. Sample sizes (n), P values, statistical tests and number of times experiments were replicated are listed in ‘Statistics and reproducibility’.

Comment in

References

    1. Wherry EJ T cell exhaustion. Nature Immunology 12, 492–499, doi:10.1038/ni.2035 (2011). - DOI - PubMed
    1. Pauken KE et al. Epigenetic stability of exhausted T cells limits durability of reinvigoration by PD-1 blockade. Science (New York, N.Y.) 354, 1160–1165, doi:10.1126/science.aaf2807 (2016). - DOI - PMC - PubMed
    1. Sen DR et al. The epigenetic landscape of T cell exhaustion. Science (New York, N.Y.) 354, 1165–1169, doi:10.1126/science.aae0491 (2016). - DOI - PMC - PubMed
    1. Philip M et al. Chromatin states define tumour-specific T cell dysfunction and reprogramming. Nature 545, 452–456, doi:10.1038/nature22367 (2017). - DOI - PMC - PubMed
    1. Zou W, Wolchok JD & Chen L PD-L1 (B7-H1) and PD-1 pathway blockade for cancer therapy: Mechanisms, response biomarkers, and combinations. Science translational medicine 8, 328rv324, doi:10.1126/scitranslmed.aad7118 (2016). - DOI - PMC - PubMed

Publication types

MeSH terms