. 2020 Nov;587(7832):126-132.
doi: 10.1038/s41586-020-2698-6. Epub 2020 Sep 2.

Pervasive chromosomal instability and karyotype order in tumour evolution

Thomas B K Watkins #  1 Emilia L Lim #  1   2 Marina Petkovic  3 Sergi Elizalde  4 Nicolai J Birkbak  1   5   6 Gareth A Wilson  1 David A Moore  2   7 Eva Grönroos  1 Andrew Rowan  1 Sally M Dewhurst  8 Jonas Demeulemeester  9   10 Stefan C Dentro  9   11   12 Stuart Horswell  13 Lewis Au  14   15 Kerstin Haase  9 Mickael Escudero  13 Rachel Rosenthal  1   2   16 Maise Al Bakir  1 Hang Xu  17 Kevin Litchfield  1 Wei Ting Lu  1 Thanos P Mourikis  2   18 Michelle Dietzen  2   18 Lavinia Spain  14   15 George D Cresswell  19 Dhruva Biswas  1   16 Philippe Lamy  5 Iver Nordentoft  5 Katja Harbst  20   21 Francesc Castro-Giner  22   23 Lucy R Yates  24   25 Franco Caramia  26 Fanny Jaulin  27 Cécile Vicier  28 Ian P M Tomlinson  29 Priscilla K Brastianos  30   31   32 Raymond J Cho  33 Boris C Bastian  33   34   35 Lars Dyrskjøt  5 Göran B Jönsson  20   21 Peter Savas  26   36 Sherene Loi  26   36 Peter J Campbell  24 Fabrice Andre  37   38   39 Nicholas M Luscombe  19   40   41 Neeltje Steeghs  42 Vivianne C G Tjan-Heijnen  43 Zoltan Szallasi  44   45   46 Samra Turajlic  14   15 Mariam Jamal-Hanjani  2   47 Peter Van Loo  9 Samuel F Bakhoum  48   49 Roland F Schwarz  50   51   52 Nicholas McGranahan  53   54 Charles Swanton  55   56   57
Affiliations

Pervasive chromosomal instability and karyotype order in tumour evolution

Thomas B K Watkins et al. Nature. 2020 Nov.

Abstract

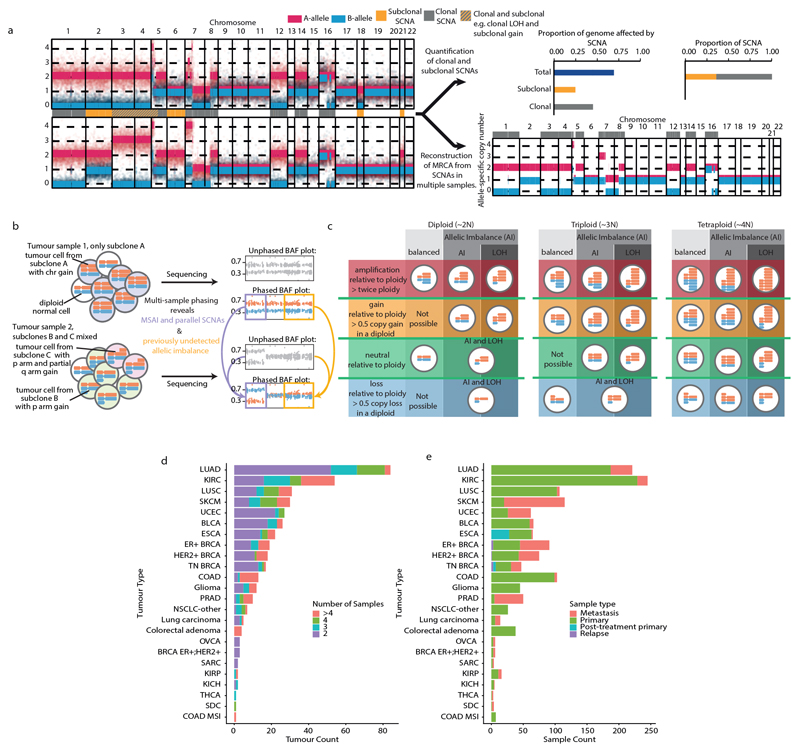
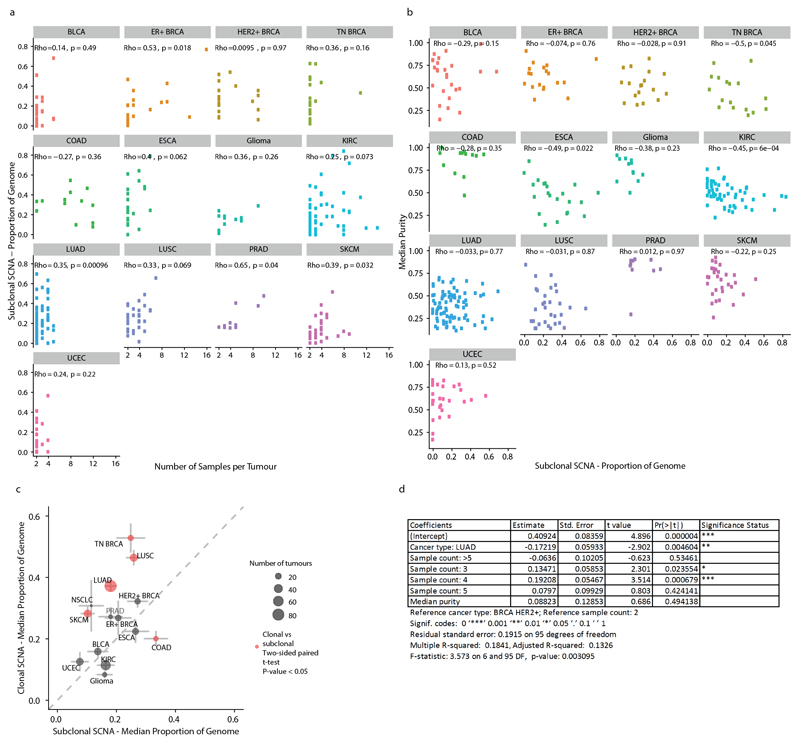
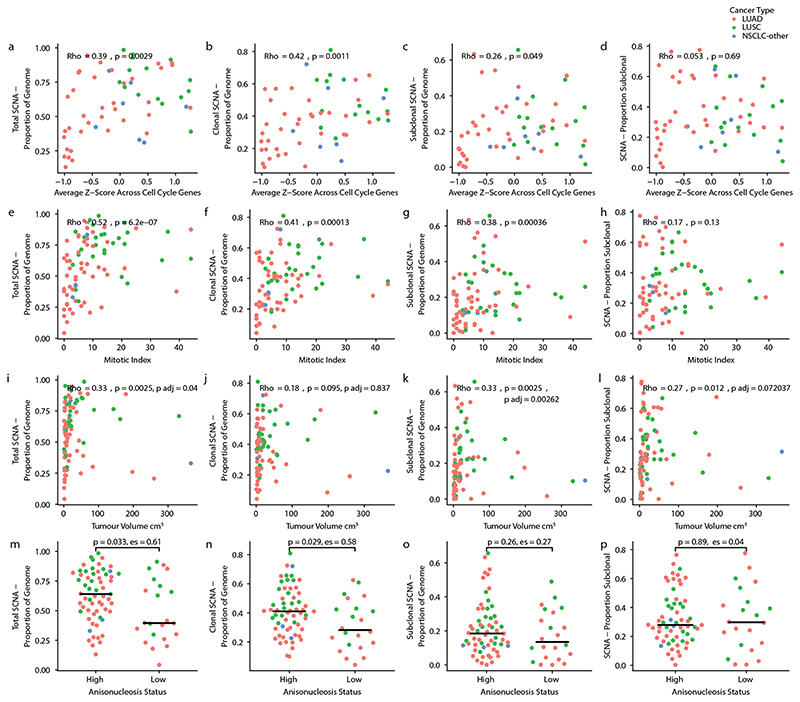
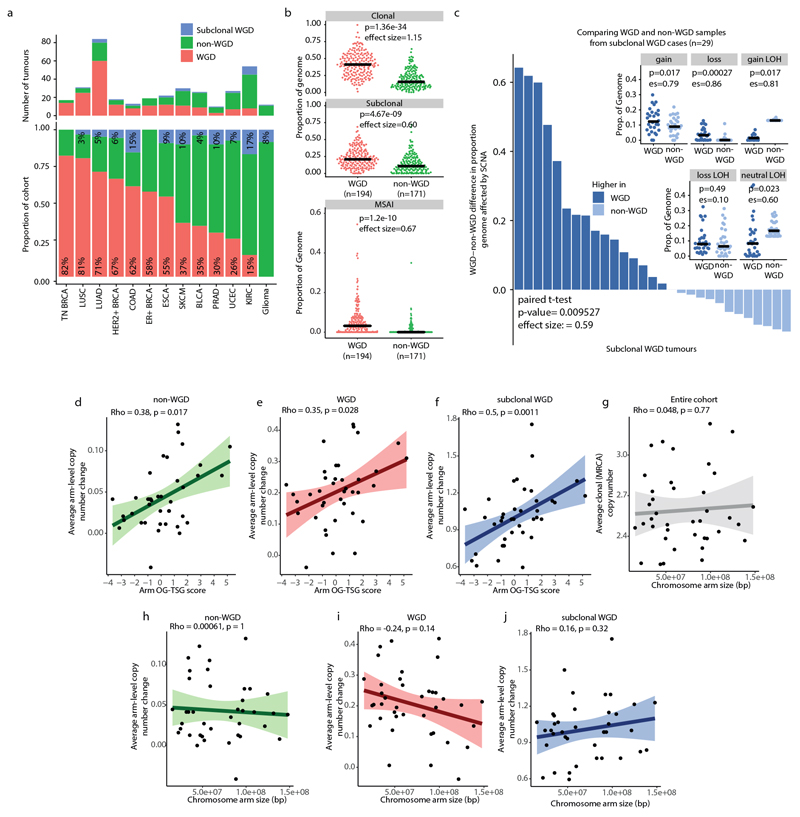
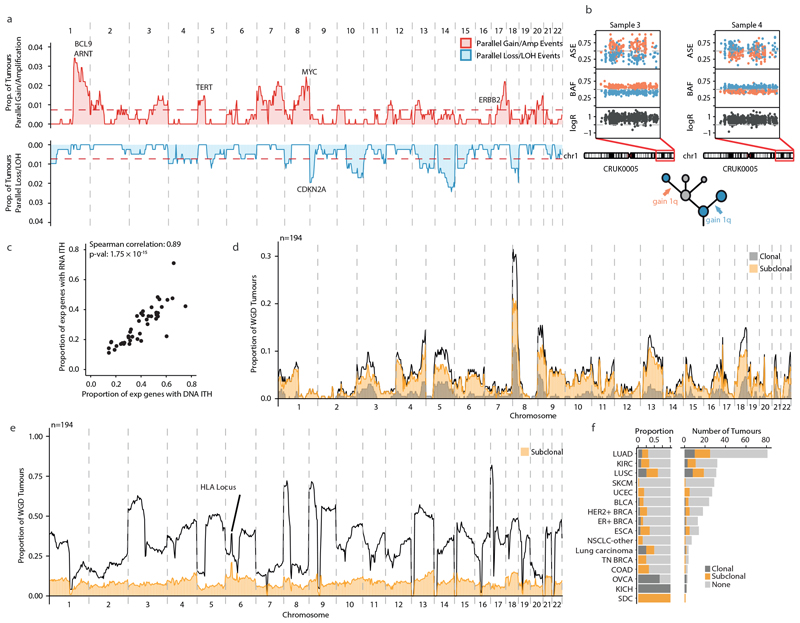
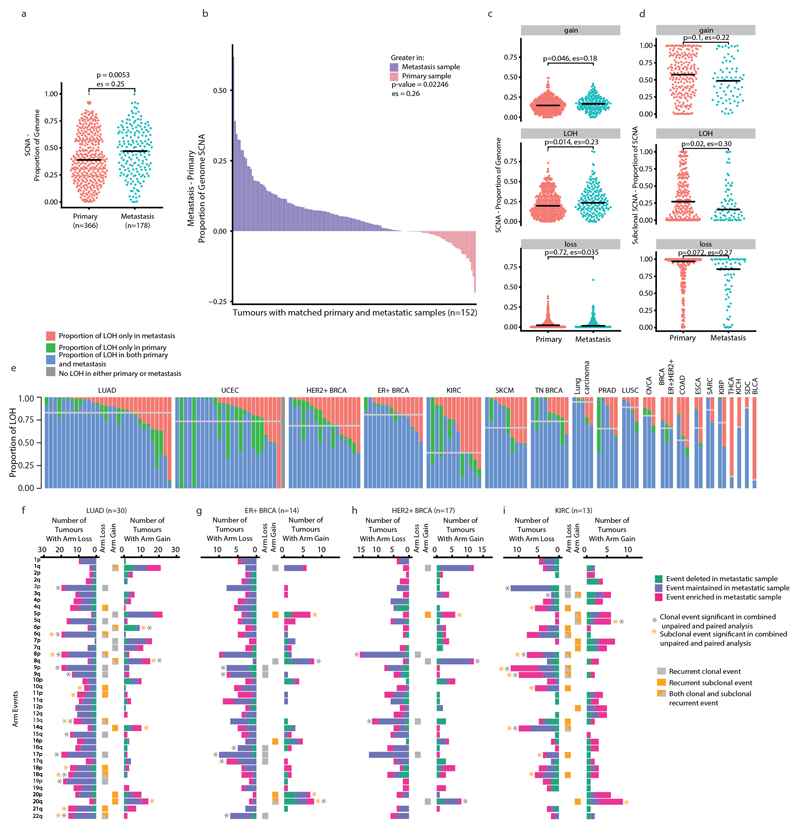
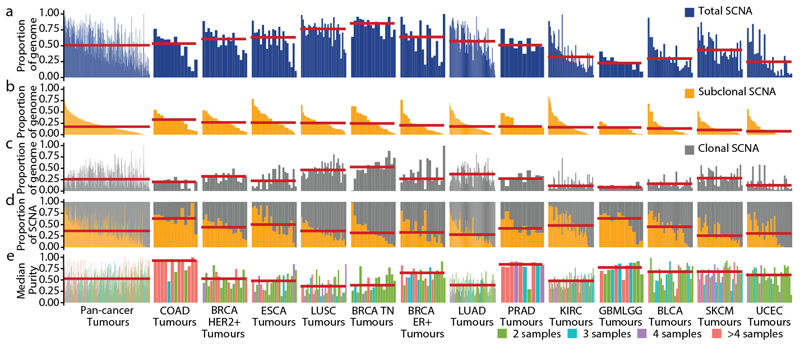
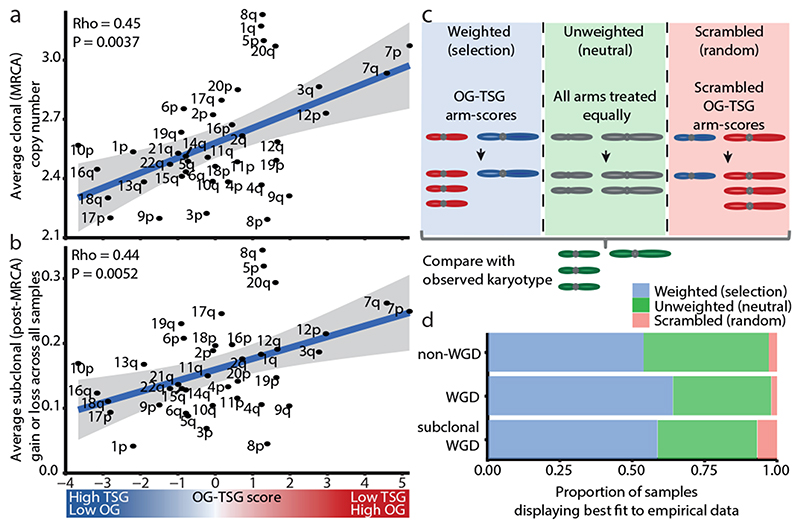
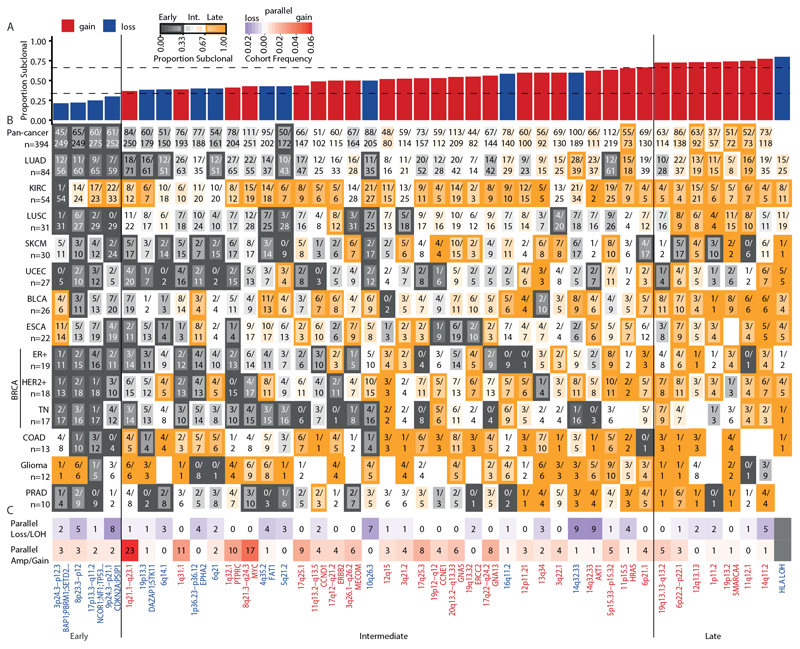
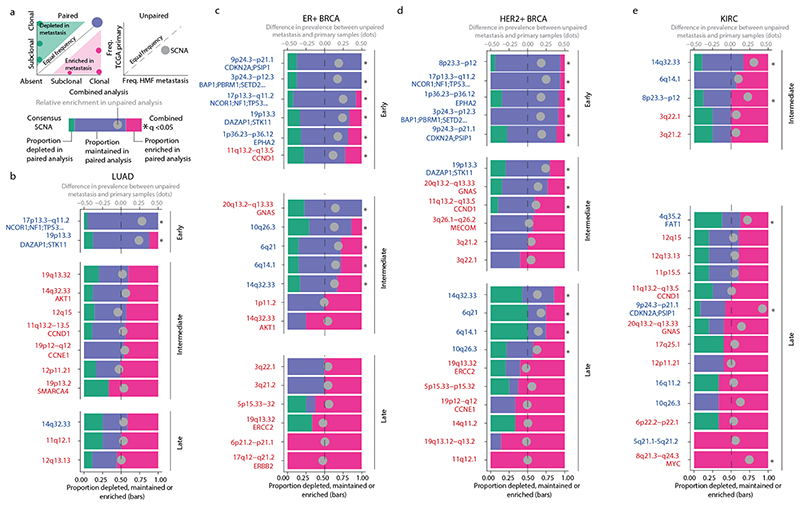
Chromosomal instability in cancer consists of dynamic changes to the number and structure of chromosomes1,2. The resulting diversity in somatic copy number alterations (SCNAs) may provide the variation necessary for tumour evolution1,3,4. Here we use multi-sample phasing and SCNA analysis of 1,421 samples from 394 tumours across 22 tumour types to show that continuous chromosomal instability results in pervasive SCNA heterogeneity. Parallel evolutionary events, which cause disruption in the same genes (such as BCL9, MCL1, ARNT (also known as HIF1B), TERT and MYC) within separate subclones, were present in 37% of tumours. Most recurrent losses probably occurred before whole-genome doubling, that was found as a clonal event in 49% of tumours. However, loss of heterozygosity at the human leukocyte antigen (HLA) locus and loss of chromosome 8p to a single haploid copy recurred at substantial subclonal frequencies, even in tumours with whole-genome doubling, indicating ongoing karyotype remodelling. Focal amplifications that affected chromosomes 1q21 (which encompasses BCL9, MCL1 and ARNT), 5p15.33 (TERT), 11q13.3 (CCND1), 19q12 (CCNE1) and 8q24.1 (MYC) were frequently subclonal yet appeared to be clonal within single samples. Analysis of an independent series of 1,024 metastatic samples revealed that 13 focal SCNAs were enriched in metastatic samples, including gains in chromosome 8q24.1 (encompassing MYC) in clear cell renal cell carcinoma and chromosome 11q13.3 (encompassing CCND1) in HER2+ breast cancer. Chromosomal instability may enable the continuous selection of SCNAs, which are established as ordered events that often occur in parallel, throughout tumour evolution.


Conflict of interest statement

Competing interests

G.A.W. has consulted for and has stock options in Achilles Therapeutics. D.A.M. reports speaker fees from AstraZeneca. M.A.B. has consulted for Achilles Therapeutics. C.V. has received travel expenses from Astellas, Roche and Pfizer, and grant support from Bristol Myers Squibb. R.R. has consulted for and has stock options in Achilles Therapeutics. K.L. reports speaker fees from Roche Tissue Diagnostics. P.K.B. has consulted for Angiochem, Roche-Genentech, Eli Lilly, Tesaro, ElevateBio, Pfizer (Array), and received grant or research support from Merck, Bristol Myers Squibb and Eli Lilly and honoraria from Merck, Roche-Genentech and Eli Lilly. L.D. has sponsored research agreements with C2i-genomics, Natera, AstraZeneca and Ferring, and has an advisory/consulting role at Ferring. P.S. serves an uncompensated consultant for Roche-Genentech. S.L. receives research funding to her institution from Novartis, Bristol Myers Squibb, Merck, Roche-Genentech, Puma Biotechnology, Pfizer, Eli Lilly and Seattle Genetics, has acted as consultant (not compensated) to Seattle Genetics, Pfizer, Novartis, Bristol Myers Squibb, Merck, AstraZeneca and Roche-Genentech and has acted as consultant (paid to her institution) to Aduro Biotech, Novartis, GlaxoSmithKline and G1 Therapeutics. F.A. is a member of the Advisory Boards for Pfizer, AstraZeneca, Eli Lilly, Roche-Genentech, Novartis and Daiichi Sankyo, acknowledges grant support from Pfizer, AstraZeneca, Eli Lilly, Novartis and Daiichi Sankyo and is a co-founder of Pegacsy. V.C.G.T.-H. reports grants and personal fees from Pfizer, Roche, Novartis and Eli Lilly, grants from Eisai and personal fees from Accord. S.T. has received funding from Ventana Medical Systems Inc (grant numbers 10467 and 10530), has received speaking fees from Roche, AstraZeneca, Novartis and Ipsen and has the following European and US patent filed: Indel mutations as a therapeutic target and predictive biomarker (PCTGB2018/051892) and European patent: Clear Cell Renal Cell Carcinoma Biomarkers (P113326GB). M.J.-H. is a member of the Advisory Board for Achilles Therapeutics. S.F.B. holds a patent related to some of the work described targeting CIN and the cGAS-STING pathway in advanced cancer, owns equity in, receives compensation from and serves as a consultant and on the Scientific Advisory Board and Board of Directors of Volastra Therapeutics, and has also consulted for Sanofi, received sponsored travel from the Prostate Cancer Foundation, and both travel and compensation from Cancer Research UK. N.M. has stock options in and has consulted for Achilles Therapeutics and holds a European patent in determining HLA LOH (PCT/GB2018/052004). C.S. acknowledges grant support from Pfizer, AstraZeneca, Bristol Myers Squibb, Roche-Ventana, Boehringer-Ingelheim, Archer Dx Inc (collaboration in minimal residual disease sequencing technologies) and Ono Pharmaceutical, is an AstraZeneca Advisory Board Member and Chief Investigator for the MeRmaiD1 clinical trial, has consulted for Pfizer, Novartis, GlaxoSmithKline, MSD, Bristol Myers Squibb, Celgene, AstraZeneca, Illumina, Genentech, Roche-Ventana, GRAIL, Medicxi and the Sarah Cannon Research Institute, has stock options in Apogen Biotechnologies, Epic Bioscience, GRAIL, and has stock options and is co-founder of Achilles Therapeutics. C.S. holds European patents relating to assay technology to detect tumour recurrence (PCT/GB2017/053289); to targeting neoantigens (PCT/EP2016/059401), identifying patent response to immune checkpoint blockade (PCT/EP2016/071471), determining HLA LOH (PCT/GB2018/052004), predicting survival rates of patients with cancer (PCT/GB2020/050221), identifying patients who respond to cancer treatment (PCT/GB2018/051912), a US patent relating to detecting tumour mutations (PCT/US2017/28013) and both a European and US patent related to identifying insertion/deletion mutation targets (PCT/GB2018/051892).

Figures

Extended Data Fig. 1
Extended Data Fig. 1. Measuring CIN across tumour types.
a, Schematic of the analyses of allele-specific copy number alterations. Left, the SCNA profiles across the genome for the two samples of a tumour (red, A allele; blue, B allele), with raw allele-specific copy number values for heterozygous SNPs shown as points and inferred allele-specific integer copy number states as lines. The clonality of the SCNAs across the two samples is indicated by a track between the two SCNA profiles, with clonal SCNAs indicated in grey, subclonal SCNAs in yellow and both clonal and subclonal SCNAs in dashed yellow and grey. All SCNA profile plots in the figure are scaled by the number of data points per chromosome. Top right, the approach to summarise SCNA timing (clonal versus subclonal) from the tumour. Bottom right, the integer SCNA profile across the genome of the inferred MRCA based on the integer SCNA profiles of the two samples of the tumour. b, c, Multi-sample phasing (b) and SCNA calling relative to ploidy (c). b, Multi-sample phasing is the method that we used to obtain allele-specific copy number profiles. This allowed us to identify previously undetected allelic imbalance (yellow boxes), and mirrored subclonal allelic imbalance and parallel SCNAs (purple boxes). c, Chromosomal illustrations and nomenclature of various SCNAs. As SCNAs are reported relative to ploidy, illustrations are provided for the diploid, triploid and tetraploid states. AI, allelic imbalance. d, e, Pan-cancer cohort characteristics. Our pan-cancer multi-sample cohort is summarised by tumour type in these bar plots, indicating the total number of patients (d) with the bar plot coloured according to the number of samples each tumour contributes, and tumour samples (e) with the bar plot coloured according to the type of sample.
Extended Data Fig. 2
Extended Data Fig. 2. SCNA correlates across tumour types.
a, Scatter plots indicating, for each tumour type, the association between the number of samples and the proportion of the genome affected by subclonal SCNAs. ρ and P values are from Spearman correlation tests. b, Scatter plots showing median purity per tumour versus the proportion of the genome affected by subclonal SCNA. ρ and P values are from Spearman correlation tests. c, Comparing the proportion of the genome affected by clonal and subclonal SCNAs. The median value for each tumour type is indicated. The size of the dots indicates the number of tumours in the corresponding tumour type. Red dots indicate tumour types with significant differences in the proportion of the genome affected by clonal versus subclonal SCNAs. A two-sided Student’s t-test was used to compare proportions of the genome affected by clonal and subclonal SCNAs. ac, Tumour types with tumour samples from at least 10 patients were included: bladder urothelial carcinoma (BLCA, n = 26), ER+ breast cancer (ER+ BRCA, n = 19), HER2+ breast cancer (HER2+ BRCA, n = 18), triple-negative breast cancer (TN BRCA, n = 17), colorectal adenocarcinoma (COAD, n = 13), oesophageal adenocarcinoma (ESCA, n = 22), glioma (n = 12), clear cell renal cell carcinoma (KIRC, n = 54), lung adenocarcinoma (LUAD, n = 84), lung squamous cell carcinoma (LUSC, n = 31), prostate adenocarcinoma (PRAD, n = 10), melanoma (SKCM, n = 30) and endometrial carcinoma (UCEC, n = 27). d, The results of the linear regression analysis between LUAD and HER2+ breast cancer of the proportion of the genome subject to subclonal SCNAs along with the number of samples from each tumour and the median sample purity for each tumour.
Extended Data Fig. 3
Extended Data Fig. 3. NSCLC SCNAs correlate with cell cycle gene expression and tumour cell characteristics.
a, b, Scatter plots comparing the average cell cycle gene expression in LUAD tumours (n = 36), LUSC tumours (n = 15) and NSCLC-other tumours (n = 7) with the total proportion of the genome affected by SCNAs. Each dot is coloured according to tumour type. (a) and the proportion of the genome affected by clonal SCNAs (b). c, The proportion of the genome affected by subclonal SCNAs. d, The proportion of SCNAs that are subclonal. ad, ρ and P values are from Spearman correlation tests. Associations between tumour cell characteristics and SCNA statistics for LUAD (n = 53), LUSC (n = 27) and NSCLC-other (n = 3). eh, Mitotic index scores for each tumour are compared against total SCNAs (e), clonal SCNAs (f), subclonal SCNAs (g) and the proportion of SCNAs that are subclonal (h) in each tumour. Each dot is coloured according to tumour type. ρ and P values are from Spearman correlation tests. il, Association between tumour volume and SCNA metrics. For each tumour for which both digitized slides and tumour volume information were available (n = 83), we performed Spearman correlation tests comparing the tumour volume with the total proportion of the genome affected by SCNAs (i), the proportion of the genome affected by clonal SCNAs (j), the proportion of the genome affected by subclonal SCNAs (k) and the proportion of SCNAs that are subclonal (l). Padj values reflect P values from linear regression models incorporating the number of samples as well as estimated tumour volume and SCNA measure investigated. mp, Associations between tumour cell characteristics and SCNA statistics for LUAD (n = 53), LUSC (n = 27) and NSCLC-other (n = 3). Anisonucleosis scores for each tumour are compared with the proportion of the genome affected by SCNAs (m), clonal SCNAs (n) or subclonal SCNAs (o) and the proportion of SCNAs that are subclonal (p) in each tumour. Each dot is coloured according to tumour type. The lines represent the median of each group. es, effect size.
Extended Data Fig. 4
Extended Data Fig. 4. WGD across tumour types.
a, Bar plots indicating the number and proportion of tumours of each tumour type that show WGD. Subclonal WGD tumours are indicated in blue. b, Beeswarm plots comparing the proportion of the genome affected by clonal or subclonal SCNAs and mirrored subclonal allelic imbalance (MSAI) in WGD and non-WGD tumours. Black bars indicate the median of each distribution. Two-sided Student’s t-tests were used for each comparison. c, Comparing the proportion of the genome affected by clonal or subclonal SCNAs in matched WGD and non-WGD samples from tumours with subclonal WGD. Bars indicate, for each patient with subclonal WGD, the difference between the median proportion of the genome affected by SCNAs in WGD and non-WGD samples. The inset beeswarm plots compare the proportion of the genome affected by different types of SCNAs in WGD and non-WGD samples. The black bars in the beeswarm plots represent the medians of each group. df, Impact of OG-TSG score on average arm-level copy number changes. Scatter plots showing the average subclonal arm-level change from MRCA in non-WGD (d; n = 171), WGD (e; n = 194) and subclonal WGD (f; n = 29) tumours versus arm OG–TSG score. Shaded areas indicate the 95% confidence interval. ρ and P values are from Spearman correlation tests. g, Scatter plot showing the average clonal (MRCA) copy number in the entire cohort (n = 394) versus chromosome arm size. hj, Scatter plots showing the average subclonal arm-level change from MRCA in non-WGD (h; n = 171), WGD (i; n = 194) and subclonal WGD (j; n = 29) tumours versus chromosome size. Shaded areas indicate the 95% confidence interval. ρ and P values are from Spearman correlation tests.
Extended Data Fig. 5
Extended Data Fig. 5. Markov chain modelling of karyotype evolution.
a, List of parameters used for Markov chain modelling. b, Diagrams of simplified Markov chain for each chromosome arm and bar charts of the resulting probability distributions of arm-level copy number. ce, Beeswarm plots showing the difference in deviance score on a per-tumour basis for non-WGD (n = 171), WGD (n = 194) and subclonal WGD (n = 29) tumours. Black horizontal bars indicate the median of the distribution. Paired two-tailed Student’s t-tests were performed between the deviance scores of the first and second model included in each comparison. es, effect size. c, Comparison between the unweighted (neutral) model and the weighted model that includes OG–TSG scores. d, Comparison between the unweighted model and the model with scrambled OG–TSG scores. e, Comparison between the weighted model that includes OG–TSG scores and the model with scrambled OG–TSG scores. f, g, For each context (non-WGD, WGD or subclonal WGD), the percentage of samples in which the OG–TSG-weighted model outperforms the unweighted model (f) or scrambled model (g) is shown. hj, Robustness analysis of the Markov chain model of karyotype evolution. Graphs show the relative performance of the three iterations of the model with varying values of g with non-WGD (pGD = 0), WGD (pGD = 0.005) and subclonal WGD (pGD = 0.012) input. The model with scrambled scores has been run for 10 different random permutations of the chromosomes. k, l, Graphs show the performance of three iterations of the model with changing values of pGD (pGD = 0.003 in k and pGD = 0.007 in l) with WGD data. m, n, Graphs show the performance of three iterations of the model with changing values of pGD (pGD = 0.01 in m and pGD = 0.014 in n) with subclonal WGD data. oq, Graphs show the performance of the three iterations of the model when varying pmisseg with non-WGD, WGD and subclonal WGD input data.
Extended Data Fig. 6
Extended Data Fig. 6. Subclonal SCNA landscape across tumour types.
ah, The following tumour types were analysed: bladder urothelial carcinoma (a; n = 26), ER+ breast cancer (b; n = 19), HER2+ breast cancer (c; n = 18), triple-negative breast cancer (d; n = 17), colorectal adenocarcinoma (e; n = 13), oesophageal adenocarcinoma (f; n = 22), glioma (g; n = 12) and KIRC (h; n = 54). n numbers represent tumours. Across-genome plots show clonal and subclonal SCNAs. Within each tumour type for each chromosome, the following data are shown (top to bottom): the proportion of patients with gains or amplifications. The black line indicates the total proportion of patients with gains/amplifications; the yellow and grey lines or shades indicate the proportion of patients with subclonal and clonal gains, respectively. The MRCA was derived by phylogenetic analysis (see Methods, ‘Ancestral reconstruction and phylogeny inference’). For each locus, the frequency of gains (red) and losses (blue) found in the MRCAs of the tumours are indicated. The GISTIC2.0 events. These tracks indicate significant SCNA focal events that were identified by GISTIC2.0 (see Methods, ‘GISTIC2.0 peak definition’ and ‘GISTIC2.0 consensus peak definition’) and recurrent arm-level events (see Methods, ‘Arm-level SCNA definition’). The proportion of patients with loss/LOH events. The black line indicates the total proportion of patients with loss/LOH events; the yellow and grey lines or shades indicate the proportion of patients with subclonal and clonal losses, respectively. The black, yellow and grey lines indicate significance thresholds for total loss/LOH, subclonal loss/LOH and clonal loss/LOH, respectively. Proportion of patients with mirrored subclonal allelic imbalance (MSAI) originating from distinct haplotypes identified by multi-sample phasing. The red line indicates the significance threshold determined by a permutation test at the 0.05 level (see Methods, ‘Permutation test for recurrence of SCNA across tumours’).
Extended Data Fig. 7
Extended Data Fig. 7. Subclonal SCNA landscape across tumour types.
ae, The following tumour types were analysed: LUAD (a; n = 84), LUSC (b; n = 31), prostate adenocarcinoma (c; n = 10), SKCM (d; n = 30) and endometrial carcinoma (e; n = 27). Across-genome plots show clonal and subclonal SCNAs. Within each tumour type for each chromosome, the following data are shown (top to bottom): the proportion of patients with gains or amplifications. The black line indicates the total proportion of patients with gains/amplifications; the yellow and grey lines or shades indicate the proportion of patients with subclonal and clonal gains, respectively. The MRCA was derived by phylogenetic analysis (see Methods, ‘Ancestral reconstruction and phylogeny inference’). For each locus, the frequency of gains (red) and losses (blue) found in the MRCAs of the tumours are indicated. The GISTIC2.0 events. These tracks indicate significant SCNA focal events that were identified by GISTIC2.0 (see Methods, ‘GISTIC2.0 peak definition’ and ‘GISTIC2.0 consensus peak definition’) and recurrent arm-level events (see Methods, ‘Arm-level SCNA definition’). The proportion of patients with loss/LOH events. The black line indicates the total proportion of patients with loss/LOH events; the yellow and grey lines or shades indicate the proportion of patients with subclonal and clonal losses, respectively. The black, yellow and grey lines indicate significance thresholds for total loss/LOH, subclonal loss/LOH and clonal loss/LOH, respectively. Proportion of patients with mirrored subclonal allelic imbalance (MSAI) originating from distinct haplotypes identified by multi-sample phasing. The red line indicates the significance threshold determined by a permutation test at the 0.05 level (see Methods, ‘Permutation test for recurrence of SCNA across tumours’).
Extended Data Fig. 8
Extended Data Fig. 8. Recurrent SCNA across tumour types.
a, b, Difference in gains and losses in consensus-peak region gains (red, n = 255) and losses (blue, n = 149) (a) and chromosome arm gains (red, n = 95) and losses (blue, n = 200) across all tumour types (b). Black horizontal bars indicate the median of the distribution. Significance testing was performed using an unpaired Student’s t-test. c, Classification of chromosomal arm-level events according to timing. Left, heat map of the percentage of subclonal occurrence of all events in each tumour type. The numerator within each cell indicates, in that tumour type, the total number of subclonal occurrences of that event and the denominator indicates the total number of both clonal and subclonal occurrences of that event in that tumour type. Shading of each cell in the heat map indicates the percentage of subclonal occurrences of an event within a tumour type with orange indicating a higher subclonality and grey indicating a higher clonality. The border of each cell indicates the classification of that event in a tumour type as either early (grey border), intermediate (no border) or late (orange border). Right, bar plot of arm-level events ordered by median percentage of subclonal occurrences across tumour types (bottom axis). Bars representing gain events are coloured in red and loss events are coloured in blue. Horizontal black lines indicate separation of events into pan-cancer categories of early, intermediate and late, according to tertiles of the median proportion of SCNAs that is subclonal. Dots centred on the same axis positions indicate the total event count of each loss or gain event across tumour types (top axis). d, Enrichment of early, intermediate and late consensus peak events with known cancer-associated genes. Heat map indicating the resulting P values from two-sided Fisher’s exact tests comparing the overlap of genes in early, intermediate and late consensus peaks with previously reported oncogenes and tumour-suppressor genes. Gain peaks were investigated in relation to oncogenes, while loss peaks were investigated in relation to tumour-suppressor genes. Significant overlaps (Benjamini–Hochberg-adjusted P < 0.05) are indicated with an asterisk (see Methods, ‘Cancer-associated gene and fragile site enrichment’). e, Enrichment of early, intermediate and late consensus peak events with chromosome fragile sites. Heat map indicating the resulting P values from Fisher’s exact tests comparing the overlap of cytobands found in early, intermediate and late consensus peaks with cytobands from previously reported chromosome fragile sites. Significant overlaps (Benjamini–Hochberg-adjusted P < 0.05) are indicated with an asterisk (see Methods, ‘Cancer-associated gene and fragile site enrichment’). f, Prevalence of SNVs and indels in cancer-associated genes. Heat map displaying the proportion of samples from each tumour type with an SNV or indel in the corresponding cancer-associated gene. Yellow asterisks indicate where the SNVs and indels are present clonally in ≥75% of tumours in the corresponding tumour type.
Extended Data Fig. 9
Extended Data Fig. 9. Recurrent parallel evolution and LOH across the genome.
a, Across-genome plot showing the frequency of parallel gain/amplification events in red and frequency of parallel LOH events in blue. The dashed red lines indicate the significance threshold determined by a permutation test. b, Example of parallel evolution on chromosome 1 in CRUK0005. log2[R], B-allele frequency (BAF) and allele-specific expression (ASE) plots are shown for chromosome 1 in samples 3 and 4. On the phylogenetic tree, we indicate the branches in which the parallel gains of chromosome 1 were identified. c, Correlating intra-tumour heterogeneity (ITH) for each gene at the DNA and RNA levels. The scatter plot shows that the percentage of expressed genes with allele-specific DNA intratumour heterogeneity correlates with the percentage of expressed genes with allele-specific RNA intratumour heterogeneity. Only the 43 tumours, for which we had paired multi-sample exome-sequencing and multi-sample RNA sequencing data, were included in this analysis. d, Prevalence of single haploid copies in WGD tumours. Across-genome plot showing the frequency of loss to a single haploid copy in WGD tumours at the cytoband level. Clonal loss to a single haploid copy is shown in grey. Subclonal loss to a single haploid copy is shown in orange. The solid black line indicates the total frequency, including both clonal and subclonal events, of loss to a single haploid copy. HLA LOH is not shown as only the whole-exome sequencing subset of our cohort could be analysed using the LOHHLA bioinformatics tool (see Methods, ‘HLA LOH detection’). e, Prevalence of LOH in WGD tumours. This across-genome plot at the cytoband level shows the proportion of tumours with LOH. The solid black line indicates the total proportion of tumours with either subclonal or clonal LOH; the yellow shading indicates the proportion of tumours with WGD in the cohort that had subclonal LOH at these cytobands. The dashed grey lines demarcate the borders between separate chromosomes. f, Prevalence of HLA LOH across tumour types. We indicate for each tumour type the count and proportion of tumours in which HLA LOH was observed. Dark grey and orange bars show tumours for which HLA LOH was observed clonally or subclonally, respectively; light grey bars show tumours for which no HLA LOH was observed.
Extended Data Fig. 10
Extended Data Fig. 10. SCNAs in metastatic samples.
a, Beeswarm plot indicating the total proportion of the genome affected by either clonal or subclonal SCNAs in primary tumour samples (red dots) or metastatic samples (blue dots). The black bars indicate the median of the distribution. A two-sided unpaired Student’s t-test was used in this comparison; the P value and effect size(es) are shown. b, Difference in the percentage of the genome affected by SCNAs between paired metastatic and primary tumour samples (n = 152). The waterfall plot shows whether a greater or lesser proportion of the genome was affected by total SCNAs in the primary or metastatic sample(s) of tumours with at least one primary tumour sample and at least one metastatic sample. Purple bars indicate that a greater proportion of the genome was affected by total SCNAs in the metastatic sample and pink bars indicate a greater proportion was affected in the primary tumour sample. A two-sided paired Student’s t-test was used for this comparison. c, Beeswarm plots indicating, for each primary tumour and metastatic sample, the proportion of the genome impacted by SCNAs. These are the same samples included in the analysis of a. The black bars indicate the median of the distribution. Two-sided unpaired Student’s t-tests were used for each comparison; P values are indicated at the top of each plot. d, Beeswarm plots indicating for each primary tumour and metastatic sample the proportion of SCNAs that is subclonal. These are the same samples included in the analysis of a. The black bars show the median of the distribution. Two-sided unpaired Student’s t-tests were used for each comparison; P values are indicated at the top of each plot. e, Shared and private primary tumour and metastatic LOH. Bar plots separated by tumour type with each stacked bar representing the LOH identified in a single tumour sample with both primary tumour and metastatic samples. Each bar is coloured according to the proportion of LOH identified in that tumour that is shared between the primary tumour and metastatic samples (blue), the proportion of LOH present only in primary tumour samples (green) or the proportion of LOH present only in metastatic samples (red). The grey horizontal lines show the median value of the proportion of LOH shared between primary tumour and metastatic samples for each tumour type. fi, Chromosomal arm-level events enriched in metastatic samples. We included only the four tumour types with >10 tumours with paired primary tumour–metastatic samples: LUAD (f), ER+ breast cancer (g), HER2+ breast cancer (h) and KIRC (i). In each panel, all chromosome arms are featured. The bar plots show the number of tumours with arm-level SCNAs in each tumour type. The colour of the bars indicates whether that arm-level event was enriched, depleted or maintained in the metastatic sample when compared with the corresponding primary tumour sample from the disease of the same patient. Bars facing right represent gain SCNAs; bars facing left represent loss SCNAs. The rectangular blocks between the bar plots indicate whether the arm-level events were recurrent events. Orange blocks represent recurrent subclonal events; grey blocks represent recurrent clonal events; blocks that are partially grey and partially orange represent events that are clonally and subclonally recurrent. The asterisks indicate whether the arm-level event is significantly enriched in metastatic samples in the combined paired (two-sided binomial test) and unpaired (test of equal or given proportions) primary tumour–metastatic analysis.
Fig. 1
Fig. 1. Overview of somatic copy number heterogeneity across tumour types.
a, For each tumour, the proportion of the genome that is affected by SCNAs (both clonal and subclonal) is indicated. Tumour types with tumour samples from at least 10 patients were included: colorectal adenocarcinoma (COAD, n = 13), HER2+ breast cancer (HER2+ BRCA, n = 18), oesophageal adenocarcinoma (ESCA, n = 22), lung squamous cell carcinoma (LUSC,n = 31), triple-negative breast cancer (TN BRCA, n = 17), ER+ breast cancer (ER+ BRCA, n = 19), lung adenocarcinoma (LUAD, n = 84), prostate adenocarcinoma (PRAD, n = 10), clear cell renal cell carcinoma (KIRC, n = 54), glioma (n = 12), bladder urothelial carcinoma (BLCA, n = 26), melanoma (SKCM, n = 30) and endometrial carcinoma (UCEC, n = 27). Tumour types and tumours are ordered by the median proportion of the genome that is affected by subclonal SCNA—this order is maintained throughout the figure. Red lines indicate the median of the distribution. b, c, The proportion of the genome affected by subclonal (b) and clonal (c) SCNAs. d, The proportions of SCNAs that are subclonal and clonal are shown. The red line indicates the median proportion of SCNAs that are subclonal. e, The median purity and number of samples for each tumour.
Fig. 2
Fig. 2. Selection shapes the SCNA landscape.
a, There is a positive correlation between the average clonal copy number present in the MRCA and the OG–TSG score. n = 394 tumours. The grey shaded area represents the 95% confidence interval. ρ and P values are from a Spearman correlation test. b, There is a positive correlation between OG–TSG score and average change in SCNA (gain or loss) from the MRCA. n = 394 tumours. The grey shaded area represents the 95% confidence interval. ρ and P values are from a Spearman correlation test. c, The three conditions under which karyotype evolution was modelled: chromosome arms with OG–TSG scores included (weighted model); chromosome arms were treated equally (neutral model); OG–TSG scores were randomly permuted (scrambled model). d, For each context (WGD, n = 194 tumours; non-WGD, n = 171 tumours; and subclonal WGD, n = 29 tumours), the percentage of tumours for which each model condition best recapitulates the empirically observed data is shown.
Fig. 3
Fig. 3. Timing, recurrence and parallel evolution of subclonal SCNAs.
a, The consensus gain-peak (red) and loss-peak (blue) regions identified as subclonal across tumour types with ≥10 tumours. Data are sorted by the median proportion of SCNAs that is subclonal. Vertical lines indicate pan-cancer categories of early, intermediate and late events determined by median subclonal tumour type occurrence. b, For each consensus peak the proportion of SCNAs found to be subclonal within each tumour type. Orange, higher subclonality; grey, higher clonality. The border of each cell is classified according to early (grey border), intermediate (no border) or late (orange border) events. The numerator within each cell indicates the number of subclonal events; the denominator indicates the total number of clonal and subclonal events. Detection of HLA LOH was performed only in tumours with whole-exome sequencing. c, Consensus peak regions that show instances of parallel evolution of loss/LOH (purple) and gain/amplification (red). For full lists of cancer-associated genes within consensus peak regions see Supplementary Table 3.
Fig. 4
Fig. 4. Analysis of consensus peak regions in metastatic LUAD, ER+ and HER2+ breast cancers, and KIRC
a, Schematics show the paired (left), unpaired (right) and combined (bottom) analyses of consensus peak regions. The schematic bar graph summarises the left graph for each event and indicates the proportion of paired primary tumour–metastasis samples in which a SCNA overlapping the event was enriched (pink), depleted (green) or maintained (purple) in metastatic samples. b–d, We restricted our analysis to tumour types with >10 paired primary tumour–metastatic samples: LUAD, paired n = 30, unpaired n = 844 TCGA and unpaired n = 315 HMF lung cancers (b); ER+ breast cancer, paired n = 14, unpaired n = 1,015 TCGA and unpaired n = 620 HMF breast cancers (c); HER2+ breast cancer, paired n = 17, unpaired n = 1,015 TCGA and unpaired n = 620 HMF breast cancers (d); and KIRC, paired n = 13, unpaired n = 772 TCGA and unpaired n = 89 HMF kidney cancers (e). These data were assessed using a two-sided binomial test. The grey circle in the schematic bar graph indicates the difference between the proportions of metastatic (HMF) and primary (TCGA) samples that contain the event in the unpaired primary tumour–metastasis analysis (two-sided test of equal or given proportions). A positive number indicates that the event was more prevalent in the metastatic (HMF) samples; a negative number indicates that the event was more prevalent in the primary tumour (TCGA) samples. The asterisks indicate whether an event was significantly enriched in metastatic samples as determined by a combined analysis of paired (multi-sample) and unpaired (HMF and TCGA) data using Fisher’s method after correction for multiple testing using the Benjamini–Hochberg method. The event timing classifications (early, intermediate or late) were determined based on the proportion of subclonal occurrence (Methods). Only losses (blue text) or gains (red text) that were either significant (q < 0.05) or exhibited ≥40% enrichment are shown. For full lists of cancer-associated genes within consensus peak regions, see Supplementary Table 3.

References

    1. Zack TI, et al. Pan-cancer patterns of somatic copy number alteration. Nat Genet. 2013;45:1134–1140. - PMC - PubMed
    1. Bolhaqueiro ACF, et al. Ongoing chromosomal instability and karyotype evolution in human colorectal cancer organoids. Nat Genet. 2019;51:824–834. - PubMed
    1. Davoli T, et al. Cumulative haploinsufficiency and triplosensitivity drive aneuploidy patterns and shape the cancer genome. Cell. 2013;155:948–962. - PMC - PubMed
    1. Turajlic S, et al. Deterministic evolutionary trajectories influence primary tumor growth: TRACERx Renal. Cell. 2018;173:595–610. - PMC - PubMed
    1. McGranahan N, et al. Cancer chromosomal instability: therapeutic and diagnostic challenges. ‘Exploring aneuploidy: the significance of chromosomal imbalance’ review series. EMBO Rep. 2012;13:528–538. - PMC - PubMed

Publication types