. 2020 Aug 20;9(9):29.
doi: 10.1167/tvst.9.9.29. eCollection 2020 Aug.

Stereotest Comparison: Efficacy, Reliability, and Variability of a New Glasses-Free Stereotest

Affiliations

Stereotest Comparison: Efficacy, Reliability, and Variability of a New Glasses-Free Stereotest

Alice Grasso McCaslin et al. Transl Vis Sci Technol. .

Abstract

Purpose: To test the validity of the ASTEROID stereotest as a clinical test of depth perception by comparing it to clinical and research standard tests.

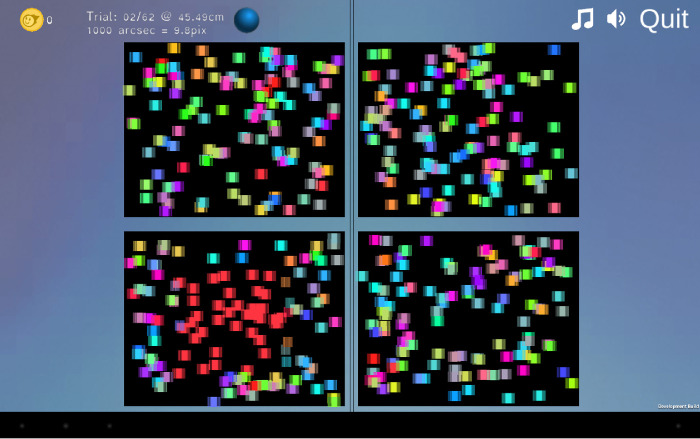
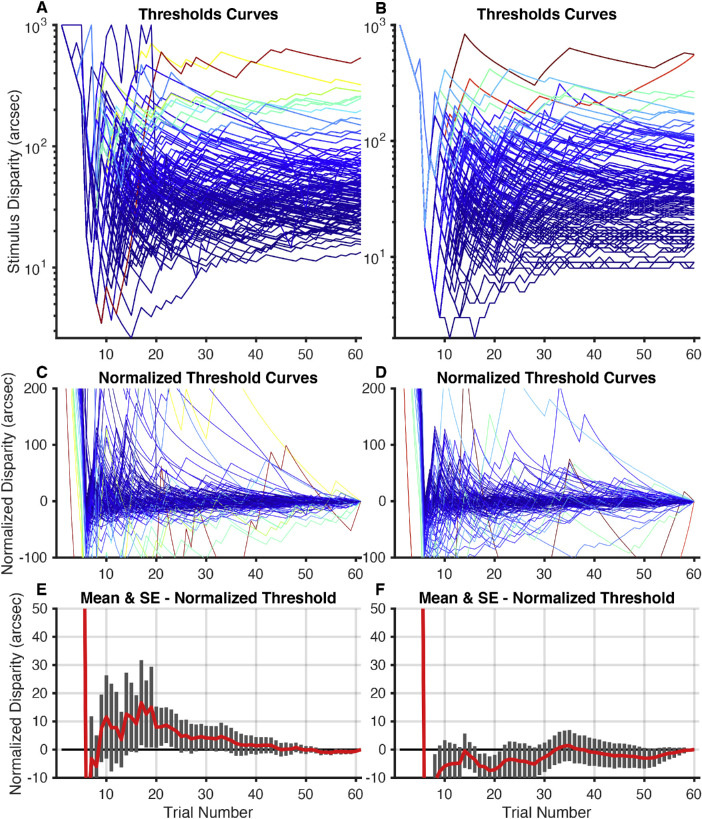
Methods: Thirty-nine subjects completed four stereotests twice: the ASTEROID test on an autostereo 3D tablet, a research standard on a VPixx PROPixx 3D projector, Randot Circles, and Randot Preschool. Within 14 days, subjects completed each test for a third time.

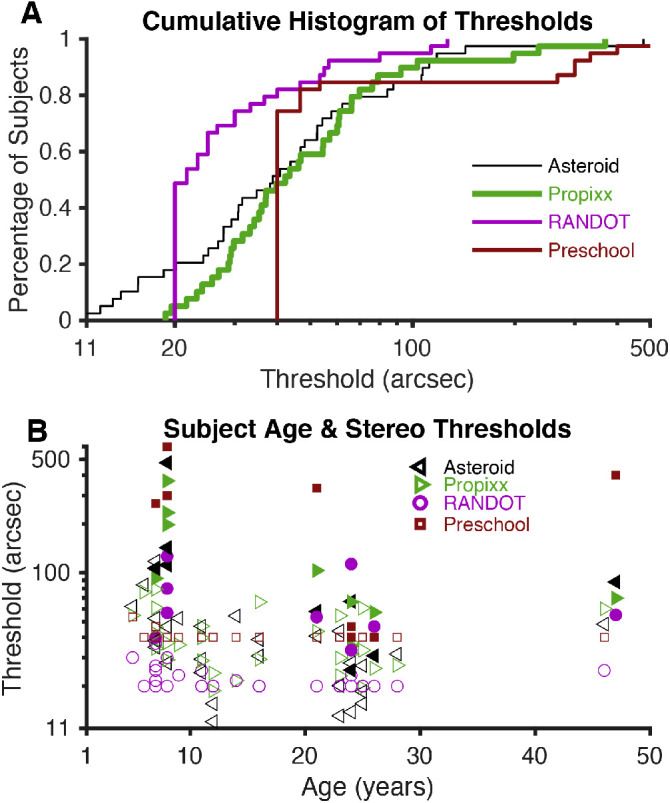
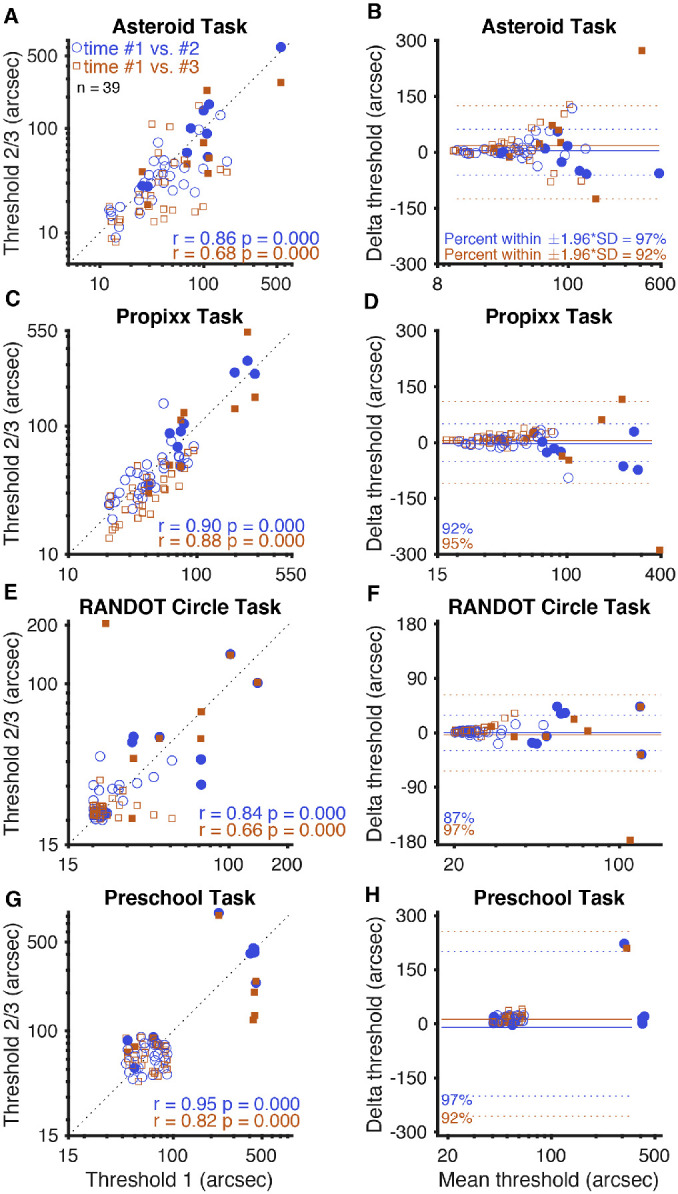
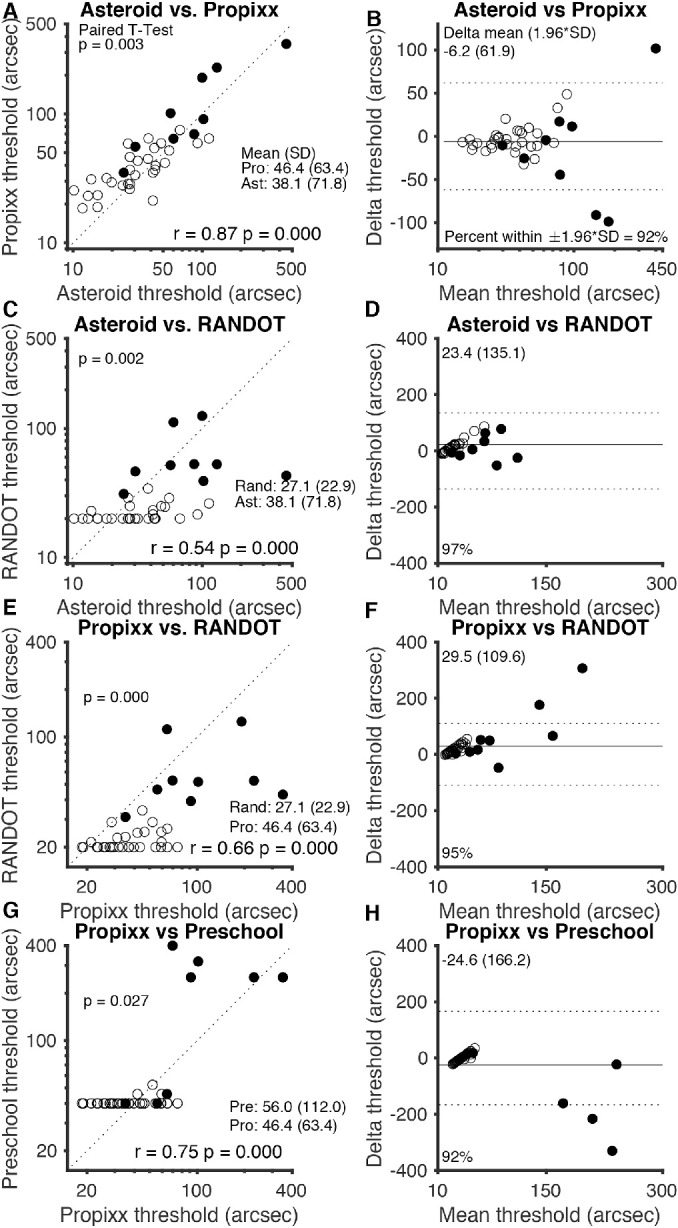
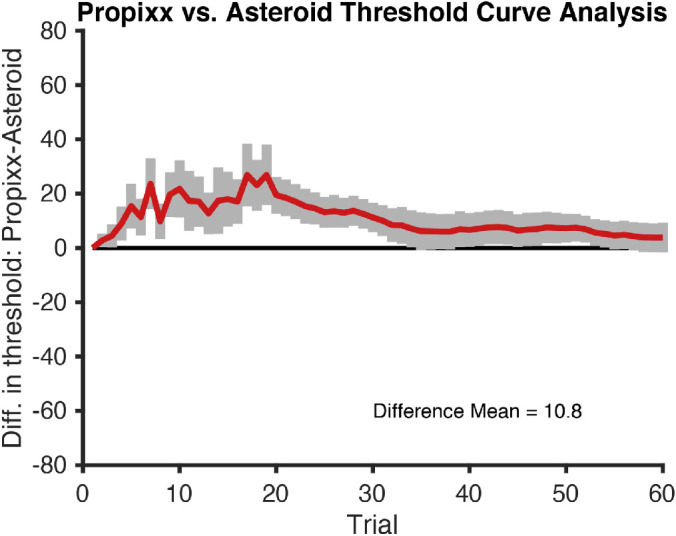
Results: ASTEROID stereo thresholds correlated well with research standard thresholds (r = 0.87, P < 0.001), although ASTEROID underestimated standard threshold (mean difference = 11 arcsec). ASTEROID results correlated less strongly with Randot Circles (r = 0.54, P < 0.001) and Randot Preschool (r = 0.64, P < 0.001), due to the greater measurement range of ASTEROID (1-1000 arcsec) compared to Randot Circles or Randot Preschool. Stereo threshold variability was low for all three clinical stereotests (Bland-Altman 95% limits of agreement between test and retest: ASTEROID, ±0.37; Randot Circles, ±0.24; Randot Preschool, ±0.23). ASTEROID captured the largest range of stereo in a normal population with test-retest reliability comparable to research standards (immediate r = 0.86 for ASTEROID vs. 0.90 for PROPixx; follow-up r = 0.68 for ASTEROID vs. 0.88 for PROPixx).

Conclusions: Compared to clinical and research standards for assessing depth perception, ASTEROID is highly accurate, has good test-retest reliability, and measures a wider range of stereo threshold.

Translational relevance: The ASTEROID stereotest is a better clinical tool for determining baseline stereopsis and tracking changes during treatment for amblyopia and strabismus compared to current clinical tests.

Keywords: binocular vision; depth perception; stereoacuity; stereopsis; vision tests.


Conflict of interest statement

Disclosure: A.G. McCaslin, None; K. Vancleef, None; L. Hubert, None; J.C.A. Read, Magic Leap (C), Huawei (F), Philosophical Transactions of Royal Society B (S); N. Port, None

Figures

Image 1.
Image 1.
ASTEROID tablet screen. Screenshot from ASTEROID version 0.931 during the second (1000 arcsec) trial with a monocular cue. The bottom left panel shows a red colored square, which would appear as if it were coming out toward the observer if viewed on a Commander 3D tablet.
Figure 1.
Figure 1.
Stereo thresholds. (A) Plots of the stereo thresholds for all 39 subjects, as determined by each test (geometric mean of three thresholds for each subject), as cumulative histograms. The two subjects who did not return for follow-up visits are included, but the data were averaged over two measurements instead of three. (B) Plots of the stereo thresholds for each subject as a function of his or her age. Filled shapes represent stereo-abnormal subjects; non-filled shapes represent stereo-normal subjects.
Figure 2.
Figure 2.
Test–retest reliability. (A, C, E, G) Graphs on the left side of the figure represent threshold values determined by each test for each subject, plotted with a line representing perfect 1:1 correlation. (B, D, F, H) Bland–Altman plots for each test on the right side of the figure show mean delta (solid line) and 95% limits of agreement, or ±1.96 × SD (dotted lines). Blue circles and lines represent each subject's second attempt at the test plotted against their first attempt. Orange squares and lines represent each subject's third attempt at the test plotted against their first attempt (approximately 14 days later). The two subjects who did not return for follow-up visits are included but do not contribute to the orange squares. Randot Circles and Randot Preschool points are jittered, but all statistics are computed from the raw data (log10 transformed). Filled shapes represent stereo-abnormal subjects; non-filled shapes represent stereo-normal subjects.
Figure 3.
Figure 3.
Comparison of stereo tests. (A, E, G) Graphs on the left side of the figure plot thresholds of each clinical test (ASTEROID, Randot Circles, and Randot Preschool) against thresholds for the research standard (PROPixx) test. (C) Plot of ASTEROID against the commonly used Randot Circles stereotest thresholds; a dotted line representing perfect agreement is plotted on each graph. (B, D, F, H) Bland–Altman plots on the right side of the figure show mean delta (solid line) and 95% limits of agreement (dotted lines) for each comparison. The geometric means of the three time points of data collection for each subject were used for this analysis; the geometric means and traditional standard deviations are listed for each stereotest. The two subjects who did not return for follow-up visits are included but data were averaged over two measurements instead of three. Filled shapes represent stereo-abnormal subjects; non-filled shapes represent stereo-normal subjects.
Figure 4.
Figure 4.
PROPixx and ASTEROID threshold curves. (A) PROPixx and (B) ASTEROID threshold curves (115), defined as current estimated threshold at each trial, one for each time each subject completed each test. Each colored line represents one test completion. (C) PROPixx and (D) ASTEROID normalized threshold curves (115), normalized to the threshold value determined by the 60th and final trial. (E) PROPixx and (F) ASTEROID means and standard errors of normalized threshold values for each subject at each trial. The five practice trials with monocular cues are not included in these curves.
Figure 5.
Figure 5.
Difference in thresholds, PROPixx versus ASTEROID. Mean difference in thresholds (PROPixx – Asteroid) and standard error bars are plotted for each trial. The five practice trials with monocular cues are not included in this curve.

References

    1. Sheedy JE, Bailey IL, Buri M, Bass E. Binocular vs. monocular task performance. Optom Vis Sci. 1986; 63: 839–846. - PubMed
    1. O'Connor AR, Birch EE, Anderson S, Draper H, FSOS Research Group. The functional significance of stereopsis. Invest Ophthalmol Vis Sci. 2010; 51: 2019–2023. - PubMed
    1. Read JCA, Begum SF, McDonald A, Trowbridge J. The binocular advantage in visuomotor tasks involving tools. Iperception. 2013; 4: 101–110. - PMC - PubMed
    1. Fielder AR, Moseley MJ. Does stereopsis matter in humans? Eye. 1996; 10: 233–238. - PubMed
    1. Poggio G. The analysis of stereopsis. Annu Rev Neurosci. 1984; 7: 379–412. - PubMed

Publication types