. 2021 Jan;30(1):70-82.
doi: 10.1002/pro.3943. Epub 2020 Oct 22.

UCSF ChimeraX: Structure visualization for researchers, educators, and developers

Affiliations

UCSF ChimeraX: Structure visualization for researchers, educators, and developers

Eric F Pettersen et al. Protein Sci. 2021 Jan.

Abstract

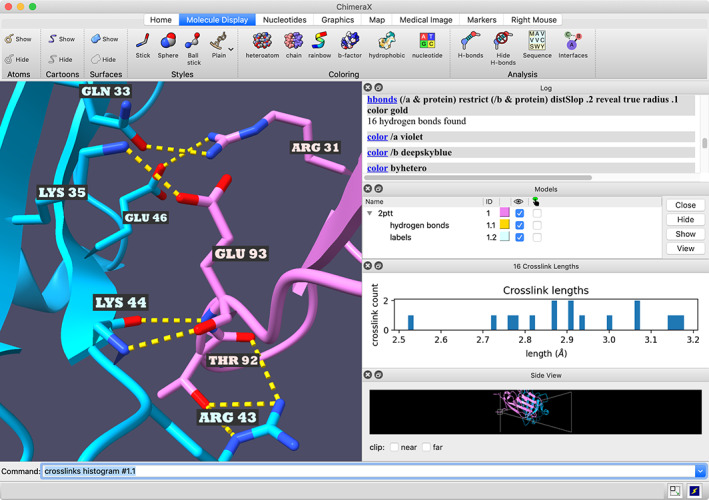
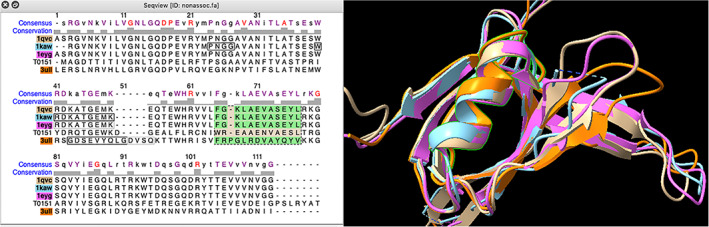
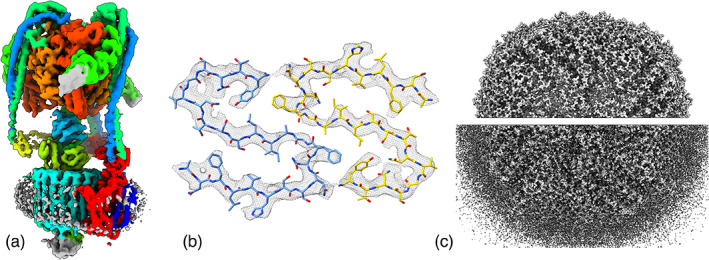
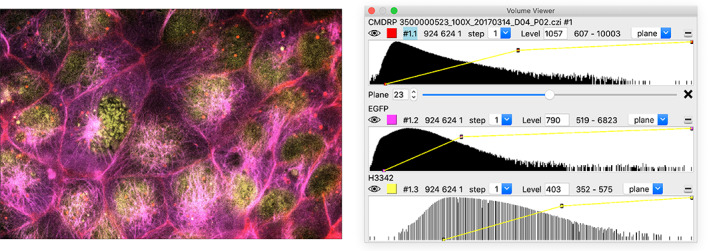
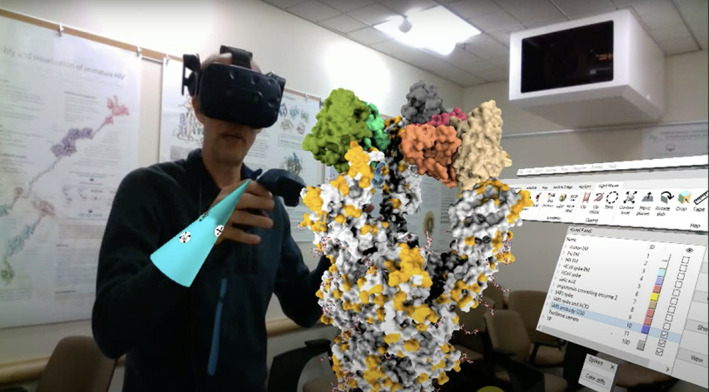
UCSF ChimeraX is the next-generation interactive visualization program from the Resource for Biocomputing, Visualization, and Informatics (RBVI), following UCSF Chimera. ChimeraX brings (a) significant performance and graphics enhancements; (b) new implementations of Chimera's most highly used tools, many with further improvements; (c) several entirely new analysis features; (d) support for new areas such as virtual reality, light-sheet microscopy, and medical imaging data; (e) major ease-of-use advances, including toolbars with icons to perform actions with a single click, basic "undo" capabilities, and more logical and consistent commands; and (f) an app store for researchers to contribute new tools. ChimeraX includes full user documentation and is free for noncommercial use, with downloads available for Windows, Linux, and macOS from https://www.rbvi.ucsf.edu/chimerax.

Keywords: cryoEM; density maps; interactive visualization and analysis; molecular graphics; molecular modeling; structural biology; virtual reality.


Figures

FIGURE 1
FIGURE 1
ChimeraX window showing interchain H‐bonds and length histogram (PDBid: 2ptt). The “crosslinks” command and resulting histogram were originally developed to analyze crosslinks, but may be used on any pseudobonds, including the H‐bonds shown here. For the corresponding ChimeraX command script, see: https://www.rbvi.ucsf.edu/chimerax/features.html#hbond‐histogram
FIGURE 2
FIGURE 2
Superimposed chains of four DNA‐binding proteins (PDBid: 1qvc, 1kaw, 1eyg, and 3ull), with names of associated sequences in the alignment highlighted with matching colors. The foreground helix was selected in the graphics window by dragging out the green/brown box on the sequence alignment. The missing structure is depicted by boxes on the alignment, outlined in black if missing from all chains, and in gray otherwise. The sequence window also shows a consensus sequence and sequence conservation histogram, with several choices for conservation scoring: the one in use in this figure is entropy‐based with independent counts as computed by the AL2CO program 30
FIGURE 3
FIGURE 3
Visualizing electron microscopy maps. (a) Color molecular components from a fit atomic model, command color zone, mammalian V‐ATPase (EMDB 21317). (b) Density near atoms, command volume zone, islet amyloid fibril (EMDB 10669). (c) Hide small density blobs, command surface dust, apoferritin at 1.2 Å resolution 32
FIGURE 4
FIGURE 4
Multichannel 3D light microscopy. Histograms of each channel are shown in the Volume Viewer panel (right) where color, brightness curves, and display style can be adjusted
FIGURE 5
FIGURE 5
Visualizing segmentations. Milled block‐face electron microscopy of mouse barrel cortex showing neurons, dendritic spines, and synapses. 33 (a) Segmentation surfaces of 96 neurons (distinct colors). (b) EM map with colored axons (green), spine heads (blue), dendrites (red). (c) The surface of one neuron (yellow) with dendritic spines (red)
FIGURE 6
FIGURE 6
Placing molecular complexes in EM tomography (EMDB 10780) of the Chlamydomonas thylakoid membrane using virtual reality: 34 photosystem I (green), photosystem II (blue), cytochrome b6f (orange), ATP synthase (magenta), ribosome (yellow)
FIGURE 7
FIGURE 7
Typical scenes from an ISOLDE session, rebuilding a problematic loop in an x‐ray crystallographic model (PDBid: 7bq7). (a) Model as loaded from the wwPDB. Maps are calculated from the experimental structure factors and are updated on the fly in response to coordinate changes. Cyan wireframe/surface: electron density map at two different contours; green/red surface: difference map at +/− 3σ. Cryo‐EM sessions differ only in that the provided map(s) do not change over time. Live markup includes questionable rotamers (inset; marker grows and shades from yellow to red with decreasing probability) and backbone Ramachandran status (colored balls overlaid on alpha carbon atoms, shading from green through yellow to red with decreasing probability). This scene contains two Ramachandran outliers (arrows), two marginal rotamers (arrowheads), and a cysteine sidechain badly out of density as shown by the difference map (*/† show current and expected positions respectively). (b) ISOLDE's interactive Ramachandran plot, showing the glycine outlier selected in (a). This plot updates in real‐time. Hovering over a point identifies it, and clicking displays the corresponding residue in the main view. (c) Corrected model. Interactive distance restraints were applied to maintain the correct zinc‐sulfur distances in the Cys3HisZn coordination site at right (arrows)
FIGURE 8
FIGURE 8
Display styles. SWI/SNF chromatin remodeling complex (PDBid: 6tda) illustrating various structure display styles. Molecular surfaces with ambient shadows for SWI/SNF proteins (gray). DNA nucleotide slabs (blue, gold). Alpha helix tubes for nucleosome histone proteins (tan). Unmodelled DNA interaction module as a sphere (pink). cryoEM density (15 Å resolution) as a transparent surface with silhouette edge
FIGURE 9
FIGURE 9
Augmented‐reality video capture. Computer‐generated structures are blended with live video from a depth‐sensing camera to communicate science results. The presenter sees the structures and live video but not the room. Coronavirus cell entry example (YouTube https://youtu.be/dKNbRRRFhqY)

References

    1. O'Donoghue SI, Goodsell DS, Frangakis AS, et al. Visualization of macromolecular structures. Nat Methods. 2010;7:42. - PMC - PubMed
    1. Baker ML, Hryc CF, Zhang Q, et al. Validated near‐atomic resolution structure of bacteriophage epsilon15 derived from cryo‐EM and modeling. Proc Natl Acad Sci USA. 2013;110:12301–12306. - PMC - PubMed
    1. Baker ML, Zhang J, Ludtke SJ, Chiu W. Cryo‐EM of macromolecular assemblies at near‐atomic resolution. Nat Protoc. 2010;5:1697–1708. - PMC - PubMed
    1. Sali A, Berman HM, Schwede T, et al. Outcome of the first wwPDB hybrid/integrative methods task force workshop. Structure. 2015;23:1156–1167. - PMC - PubMed
    1. Mcwilliam H, Valentin F, Goujon M, et al. Web services at the European Bioinformatics Institute‐2009. Nucleic Acids Res. 2009;37(Web Server):W6–W10. 10.1093/nar/gkp302. - DOI - PMC - PubMed

Publication types