. 2020 Nov;31(11):1125-1137.
doi: 10.1111/clr.13659. Epub 2020 Sep 14.

Bone formation around unstable implants is enhanced by a WNT protein therapeutic in a preclinical in vivo model

Affiliations

Bone formation around unstable implants is enhanced by a WNT protein therapeutic in a preclinical in vivo model

Benjamin R Coyac et al. Clin Oral Implants Res. 2020 Nov.

Abstract

Objectives: Our objective was to test the hypothesis that local delivery of a WNT protein therapeutic would support osseointegration of an unstable implant placed into an oversized osteotomy and subjected to functional loading.

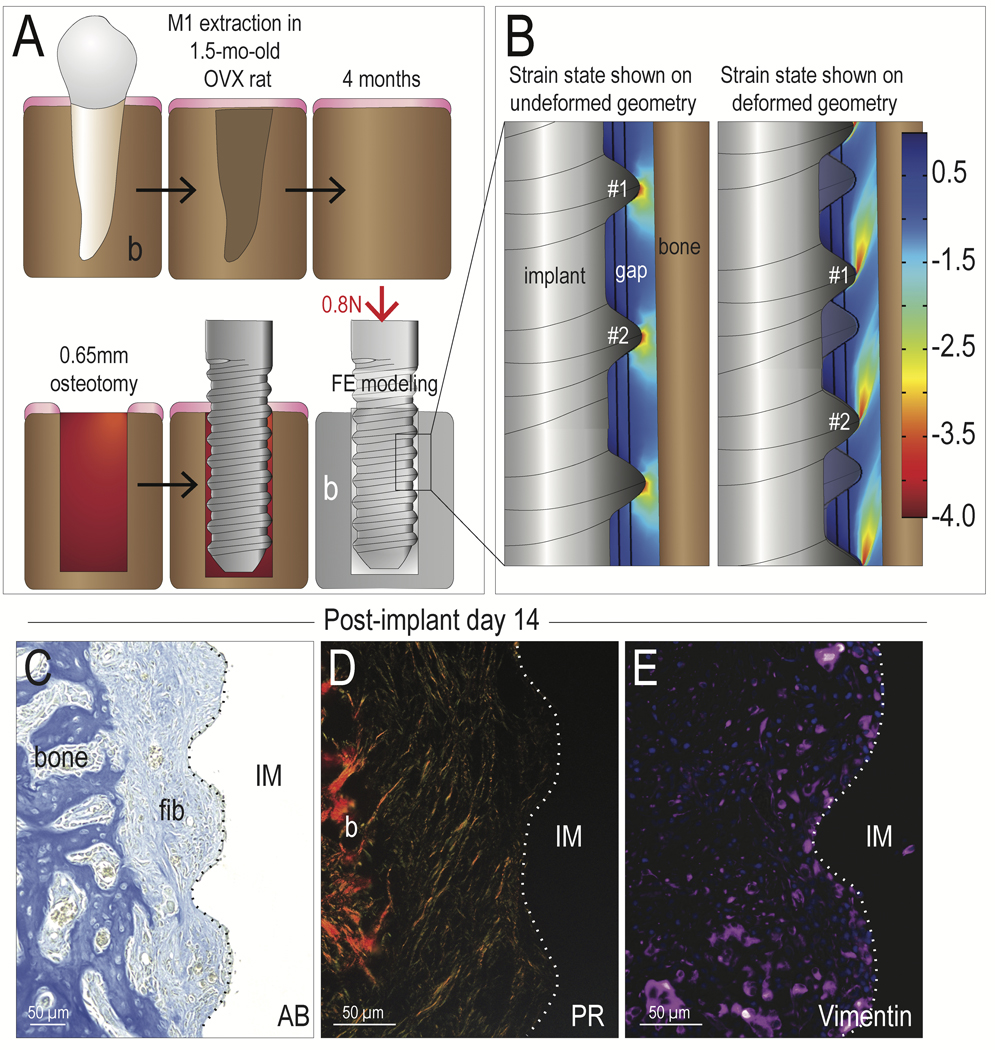
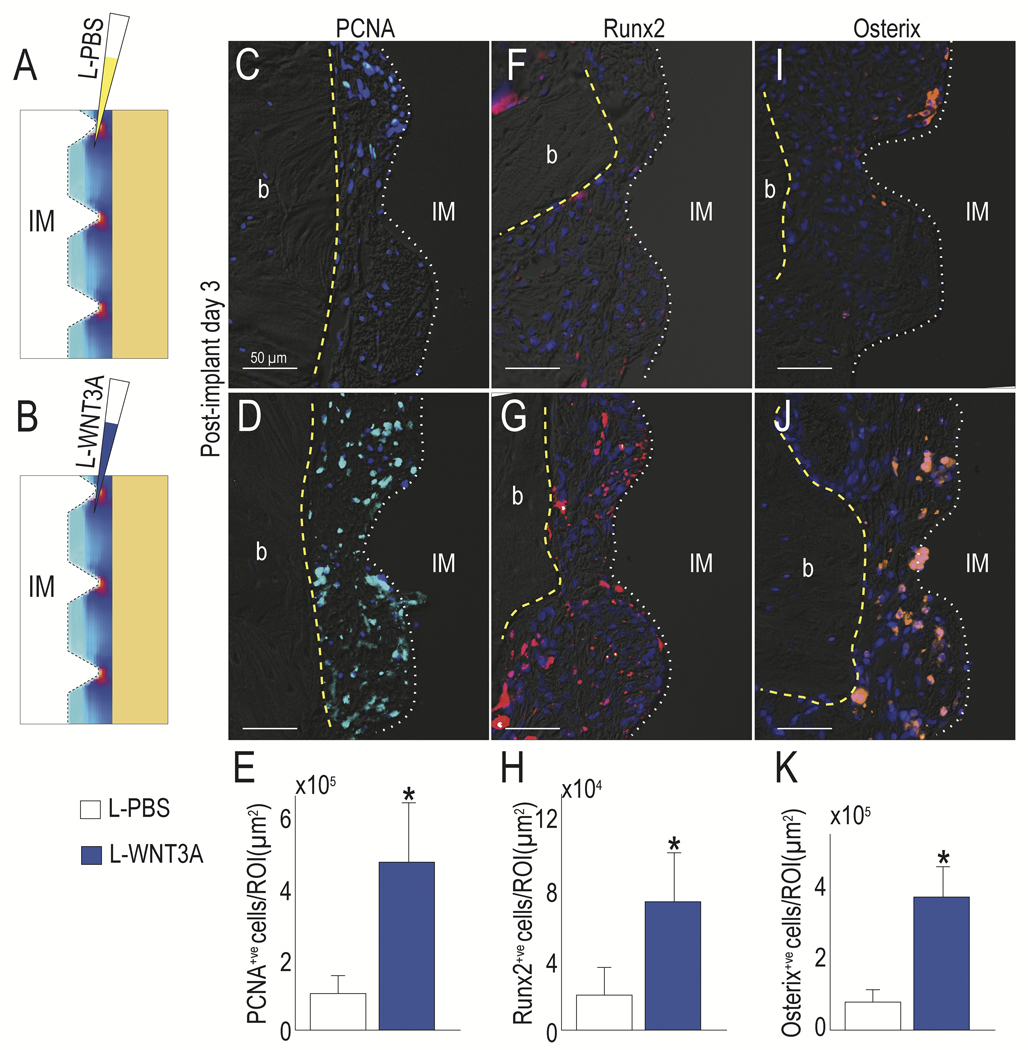
Materials and methods: Using a split-mouth design in an ovariectomized (OVX) rat model, 50 titanium implants were placed in oversized osteotomies. Implants were subjected to functional loading. One-half of the implants were treated with a liposomal formulation of WNT3A protein (L-WNT3A); the other half received an identical liposomal formulation containing phosphate-buffered saline (PBS). Finite element modeling estimated peri-implant strains caused by functional loading. Histological, molecular, cellular, and quantitative micro-computed tomographic (µCT) imaging analyses were performed on samples from post-implant days (PID) 3, 7, and 14. Lateral implant stability was quantified at PID 7 and 14.

Results: Finite element analyses predicted levels of peri-implant strains incompatible with new bone formation. Micro-CT imaging, histological, and quantitative immunohistochemical (IHC) analyses confirmed that PBS-treated implants underwent fibrous encapsulation. In those cases where the peri-implant environment was treated with L-WNT3A, µCT imaging, histological, and quantitative IHC analyses demonstrated a significant increase in expression of proliferative (PCNA) and osteogenic (Runx2, Osterix) markers. One week after L-WNT3A treatment, new bone formation was evident, and two weeks later, L-WNT3A-treated gaps had a stiffer interface compared to PBS-treated gaps.

Conclusion: In a rat model, unstable implants undergo fibrous encapsulation. If the same unstable implants are treated with L-WNT3A at the time of placement, then it results in significantly more peri-implant bone and greater interfacial stiffness.

Keywords: dental; implant failure; oral; osseointegration; stability.


Conflict of interest statement

Conflict of Interest Statement

All authors declare that no conflict of interest exists.

Figures

Fig. 1.
Fig. 1.. Peri-implant cells become fibroblasts in regions with high tensile and compressive strains.
(A) Schematic of the experimental design, where an OVX surgery was performed and maxillary first molars were extracted within a single surgical procedure. After a 6-week healing period, an osteotomy was prepared in the healed M1 site, followed by placement of an implant. The osteotomy was oversized relative to the diameter of the implant (see Table 1). The implant was positioned at the level of the occlusal plane, resulting in immediate loading. FE modeling of this situation was performed, where (B) a compressive strain maps was generated, which illustrated that principal strain magnitudes around the implant thread tips were ~350% and <50% between the thread tips. The left panel illustrated the strain distribution super-imposed on the implant in the undeformed geometry, where the right panel illustrated the same strains in the deformed geometry. On PID14, fibrous tissue encapsulation was visualized by (C) aniline blue histology, (D) picrosirius red staining, viewed under polarized light; and (E) immunostaining for the fibrotic tissue marker Vimentin. Abbreviations: AB, Aniline blue; PR, Picrosirius red; b, bone; fib, fibrous tissue; M1, maxillary first molar; IM, implant; OVX, ovariectomy. Scale bars = 50μm.
Fig. 2.
Fig. 2.. L-WNT3A alters the fate of peri-implant cells towards an osteogenic lineage despite a high strain environment.
(A) Schematic of the experimental treatment, where L-PBS or (B) L-WNT3A were injected into the peri-implant environment, whose strain distribution is illustrated by a schematized heat map. PCNA expression in (C) control L-PBS vs (D) L-WNT3A treated groups was evaluated to detect proliferative cells (quantified in E), Runx2 expression in (F) control L-PBS vs (G) L-WNT3A treated groups (quantified in H) and Osterix expression in (I) control L-PBS vs (J) L-WNT3A treated groups (quantified in K) were evaluated to detect osteogenic differentiation. Abbreviations: b, bone; IM, implant. Scale bars = 50μm. Asterisk indicates p<.05.
Fig. 3.
Fig. 3.. L-WNT3A-induced peri-implant bone forms in regions of lower strains.
Representative 3D μCT imaging to assess peri-implant bone formation in cases treated with (A) L-PBS or (B) L-WNT3A. Sirius red staining observed with polarized light of representative sections from (C) L-PBS and (D) L-WNT3A. (E) Quantification of Bone Volume over Total Volume in the gap region. (F) Lateral stability testing of implants treated with L-PBS or L-WNT3A on PID7 (N=8, p=0.34). Collagen Type I expression observed in representative sections from (G) L-PBS and (H) L-WNT3A. Vimentin expression in representative sections from (I) L-PBS and (J) L-WNT3A. On PID7, Pentachrome staining of representative sagittal sections of (K) L-PBS and (L) L-WNT3A treated sites. Scale bars = 200μm (A, B), 50μm (G-L). Abbreviations: b, bone; IM, implant. Asterisk indicates p<.05.
Fig. 4.
Fig. 4.. Temporal and spatial progression of peri-implant osteogenesis triggered by L-WNT3A
(A,A’) Strain map obtained from FE analyses, displaying a continuum of increasing strains, from Zone 1 (light blue, at the implant surface, between the threads) to Zone 3 (bright red, at the thread tips). (B) Illustration of L-WNT3A treatment at time of surgery where liposomes are evenly dispersed throughout the peri-implant blood clot. (C) GFP immunostaining for WNT responsive cells in Axin2CreERT2/+;R26RmTmG/+ mice; the majority of Wnt-responding cells are localized in the lower strain, Zone 1 region. These data are summarized in (D) an illustration depicting the distribution of WNT-responsive cells (green) and undifferentiated cells (light blue) 3 days after L-WNT3A treatment. (E) Pentachrome staining at PID7 assessed the state of ossification in Zone 1. (F) Illustration of cell activity at PID7 where osteoblasts (yellow squares) are confined to Zone 1 while the outer gap region remains fibrous (blue cells). (G) ALP activity in the peri-implant gap at PID14. (H) Illustration of tissue layers comprising the gap region at PID14. (I) Osterix IHC showing the strong osteogenic activity in the gap region at PID14. (J) Lateral stiffness testing of L-PBS and L-WNT3A treated groups at PID14. Scale bars = 50μm (B, H). Abbreviations: b, bone; IM, implant. Asterisk indicates p<.05.

References

    1. Albrektsson T, Branemark PI, Hansson HA, & Lindstrom J. (1981). Osseointegrated titanium implants. Requirements for ensuring a long-lasting, direct bone-to-implant anchorage in man. Acta Orthop Scand, 52(2), 155–170. - PubMed
    1. Baron R, & Kneissel M. (2013). WNT signaling in bone homeostasis and disease: from human mutations to treatments. Nat Med, 19(2), 179–192. doi: 10.1038/nm.3074 - DOI - PubMed
    1. Bouxsein ML, Boyd SK, Christiansen BA, Guldberg RE, Jepsen KJ, & Muller R. (2010). Guidelines for assessment of bone microstructure in rodents using micro-computed tomography. J Bone Miner Res, 25(7), 1468–1486. doi: 10.1002/jbmr.141 - DOI - PubMed
    1. Buser D, Chappuis V, Belser UC, & Chen S. (2017). Implant placement post extraction in esthetic single tooth sites: when immediate, when early, when late? Periodontol 2000, 73(1), 84–102. doi: 10.1111/prd.12170 - DOI - PubMed
    1. Carter DR (1987). Mechanical loading history and skeletal biology. J Biomech, 20(11–12), 1095–1109. - PubMed