. 2020 Sep 3;15(9):e0236874.
doi: 10.1371/journal.pone.0236874. eCollection 2020.

What's all that racket! Soundscapes, phenology, and biodiversity in estuaries

Affiliations

What's all that racket! Soundscapes, phenology, and biodiversity in estuaries

Agnieszka Monczak et al. PLoS One. .

Abstract

There is now clear evidence that climate change affects terrestrial and marine ecosystems and can cause phenological shifts in behavior. Utilizing sound to demonstrate phenology is gaining popularity in terrestrial environments. In marine ecosystems, this technique is yet to be used due to a lack of multiyear datasets. Our study demonstrates soundscape phenology in an estuary using a six-year dataset. In this study, we showed that an increase in acoustic activity of snapping shrimp and certain fish species occurred earlier in years with warmer springs. In addition, we combined passive acoustics and traditional sampling methods (seines) and detected positive relationships between temporal patterns of the soundscape and biodiversity. This study shows that passive acoustics can provide information on the ecological response of estuaries to climate variability.


Conflict of interest statement

The authors have declared that no competing interests exist.

Figures

Fig 1
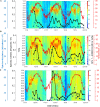
Fig 1. Time series of high frequency Sound Pressure Levels (SPL) from 2013 to 2018.
Heat maps represent temporal and spatial patterns of high (i.e. 7000–40,000 Hz) frequency SPLs reflecting snapping shrimp acoustic activity at stations (A) 9M, (B) 14M, and (C) 37M in the May River, SC. Time is shown between noon and noon of the next day. Gaps in data = white, temperature = black line, and daylight hours = dotted line. Green dots indicate first posterior probability (PP) of change ⩾ 0.5 detected during springtime. At station (C) 37M first PP was not calculated for spring 2017 due to missing acoustic data. This dataset contained files with physical sounds and anthropogenic noise.
Fig 2
Fig 2. Time series of low frequency Sound Pressure Levels (SPLs) from 2013 until 2018.
Heat maps represent temporal and spatial patterns of low (i.e. 50–1200 Hz) frequency SPLs reflecting fish and lower frequency range of snapping shrimp acoustic activity at stations (A) 9M, (B) 14M, and (C) 37M in the May River, SC. Time is shown between noon and noon of the next day. Gaps in data = white, temperature = black line, and daylight hours = dotted line. Green dots indicate first posterior probability (PP) of change ⩾ 0.5 detected during springtime. At station (C) 37M first PP was not calculated for spring 2017 due to missing acoustic data. This dataset contained files with physical sounds and anthropogenic noise.
Fig 3
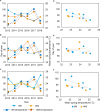
Fig 3. Relationship between mean spring water temperature and day of year of first Posterior Probability (PP) of change ⩾ 0.5.
Left panels: lines with dots represent day of year of first PP ⩾ 0.5 of sound pressure level in (A) high (7000–40,000 Hz), (B) low (50–1200 Hz), and (C) broadband (1–40,000 Hz) frequency range, while lines with squares represent mean spring water temperature at stations 9M and 14M. Right panels: relationship between mean spring water temperature and day of year of first PP ⩾ 0.5 of sound pressure level in (D) high (7000–40,000 Hz), (E) low (50–1200 Hz), and (F) broadband (1–40,000 Hz) frequency range with corresponding mean spring water temperature at stations 9M and 14M. This dataset did not contain files with physical sounds and anthropogenic noise.
Fig 4
Fig 4. Time series of broadband frequency SPLs, species richness, and species abundance from 2016 until 2018.
Heat maps represent temporal and spatial patterns of broadband (1–40,000 Hz) frequency SPLs reflecting all biological sounds with corresponding species richness (black line), species abundance (blue dash line), and temperature (red line) at stations (A) 9M, (B) 14M, and (C) 37M in the May River. Gaps in data = white. This dataset contained files with physical sounds and anthropogenic noise.
Fig 5
Fig 5. Map of the May River, SC, USA.
Locations of stations 9M, 14M, and 37M that were acoustically monitored from February 2013 to December 2018 (blue) and seining stations monitored from May 2016 to December 2018 (yellow). (Inset) Location of the May River (black) in reference to the USA coast.

References

    1. Brown J. L., Li S. H., Bhagabati N., Long-term trend toward earlier breeding in an American bird: a response to global warming? Proc. Natl. Acad. Sci. U.S.A 96, 5565–5569 (1999). 10.1073/pnas.96.10.5565 - DOI - PMC - PubMed
    1. Root T. L., Price J. T., Hall K. R., Schneider S. H., Fingerprints of global warming on wild animals and plants (tier 2). Nature 421, 57–60 (2002). - PubMed
    1. Walther G., Post E., Convey P., Menzel A., Parmesan C., Beebee T. J., et al., Ecological responses to recent climate change. Nature 416, 389–395 (2002). 10.1038/416389a - DOI - PubMed
    1. Edwards M., Richardson A. J., Impact of climate change on marine phenology and tropic mismatch. Nature 430, 881–884 (2004). 10.1038/nature02808 - DOI - PubMed
    1. Carter S. K., Saenz D., Rudolf V. H. W., Shifts in phenological distributions reshape interaction potential in natural communities. Ecol. Lett. 21, 1143–1151 (2018). 10.1111/ele.13081 - DOI - PubMed

Publication types