. 2021 Jan 28;137(4):471-484.
doi: 10.1182/blood.2020006287.

Tumor-intrinsic and -extrinsic determinants of response to blinatumomab in adults with B-ALL

Affiliations

Tumor-intrinsic and -extrinsic determinants of response to blinatumomab in adults with B-ALL

Yaqi Zhao et al. Blood. .

Abstract

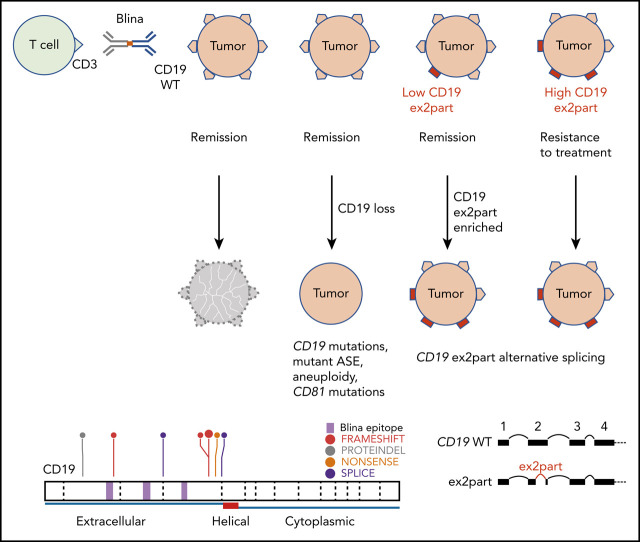
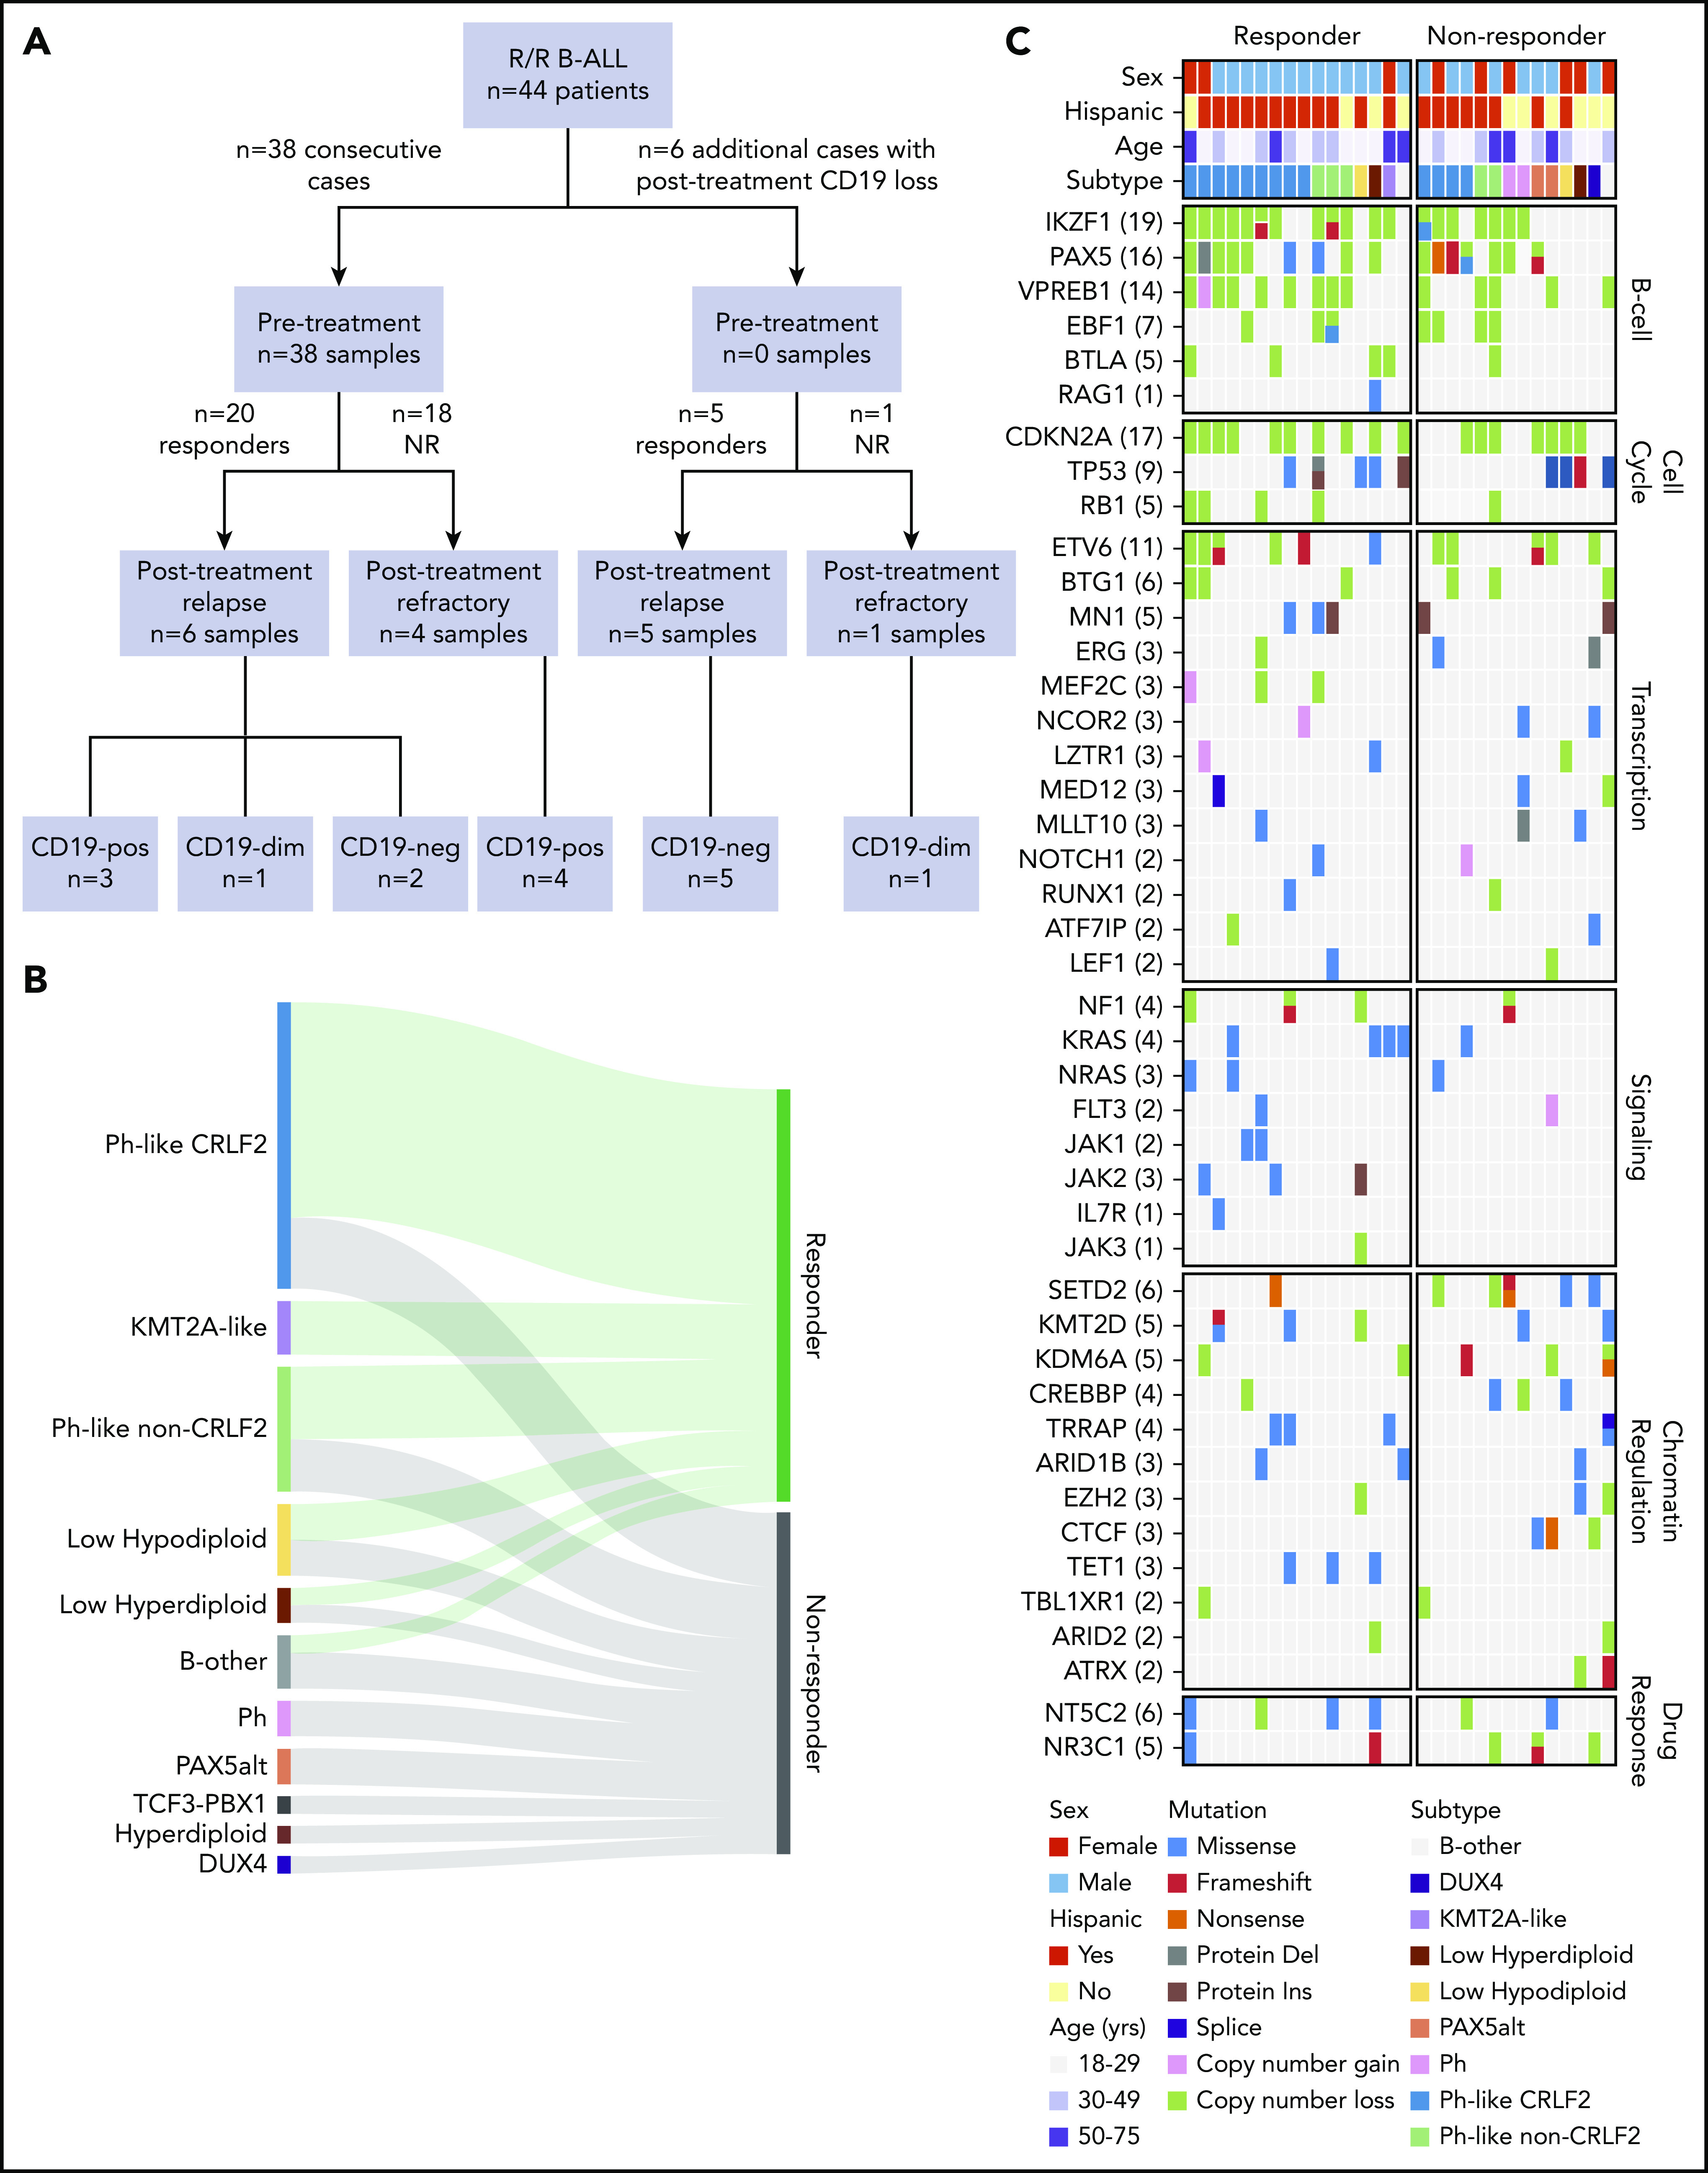
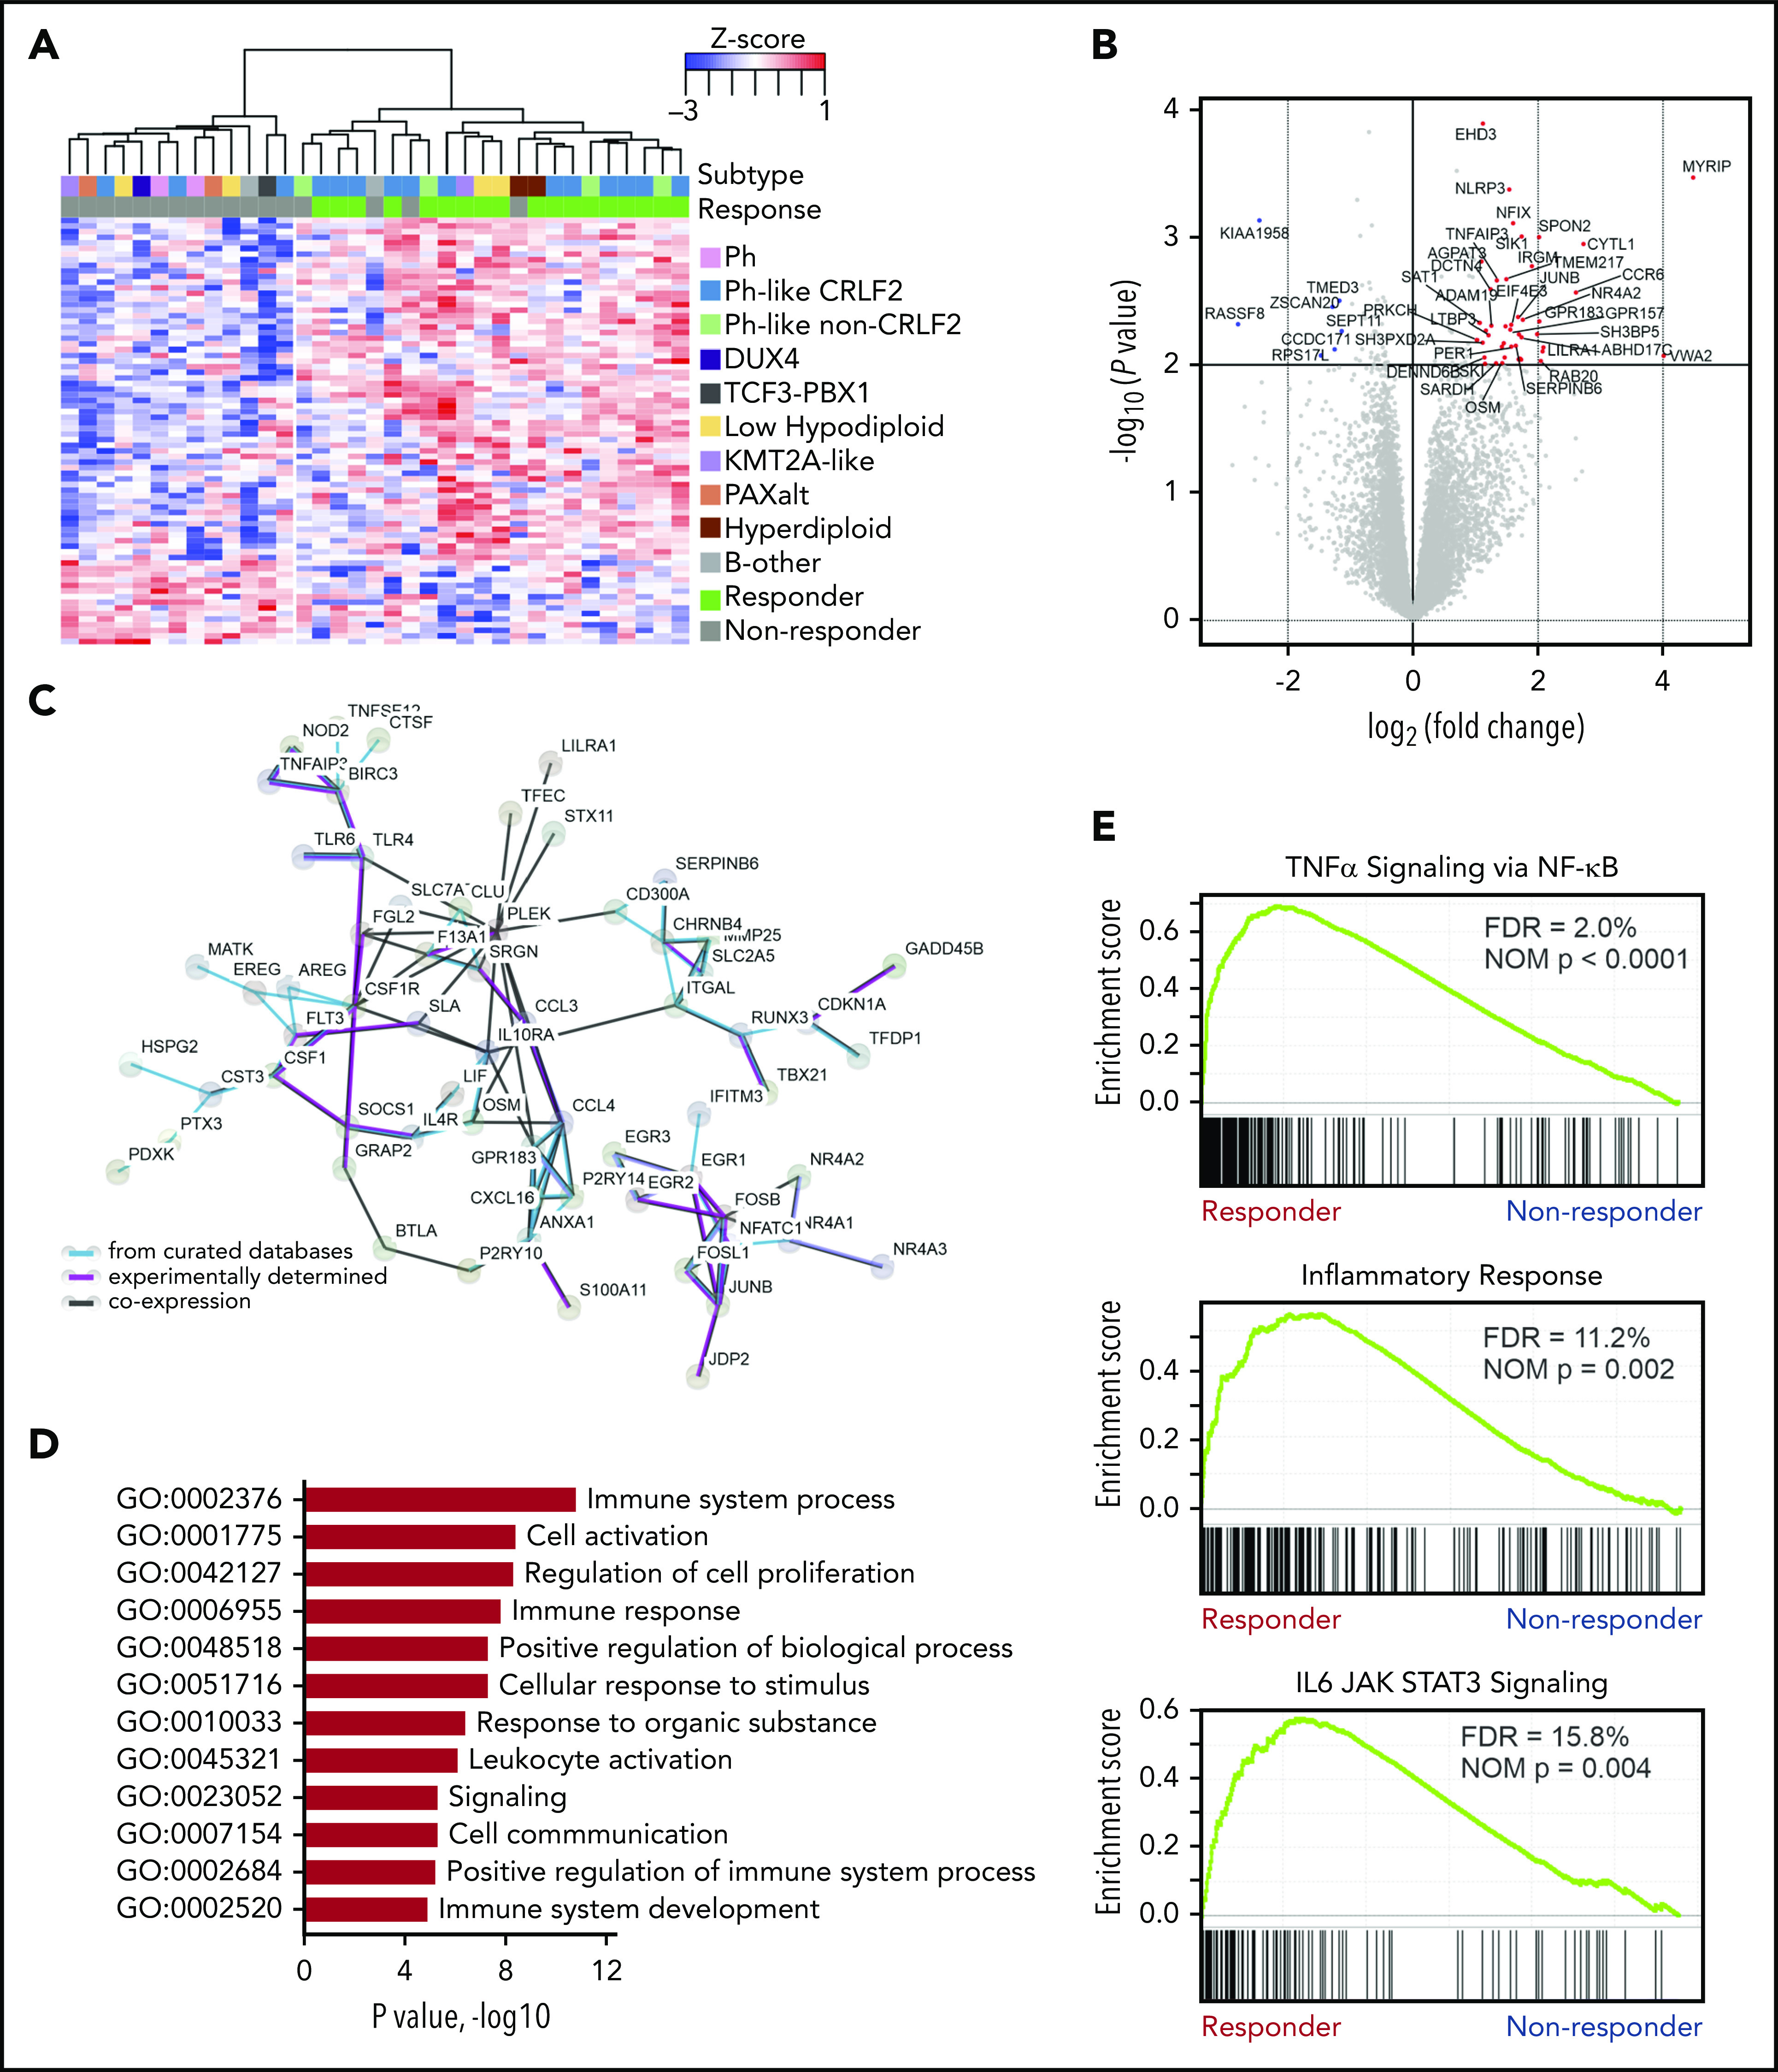
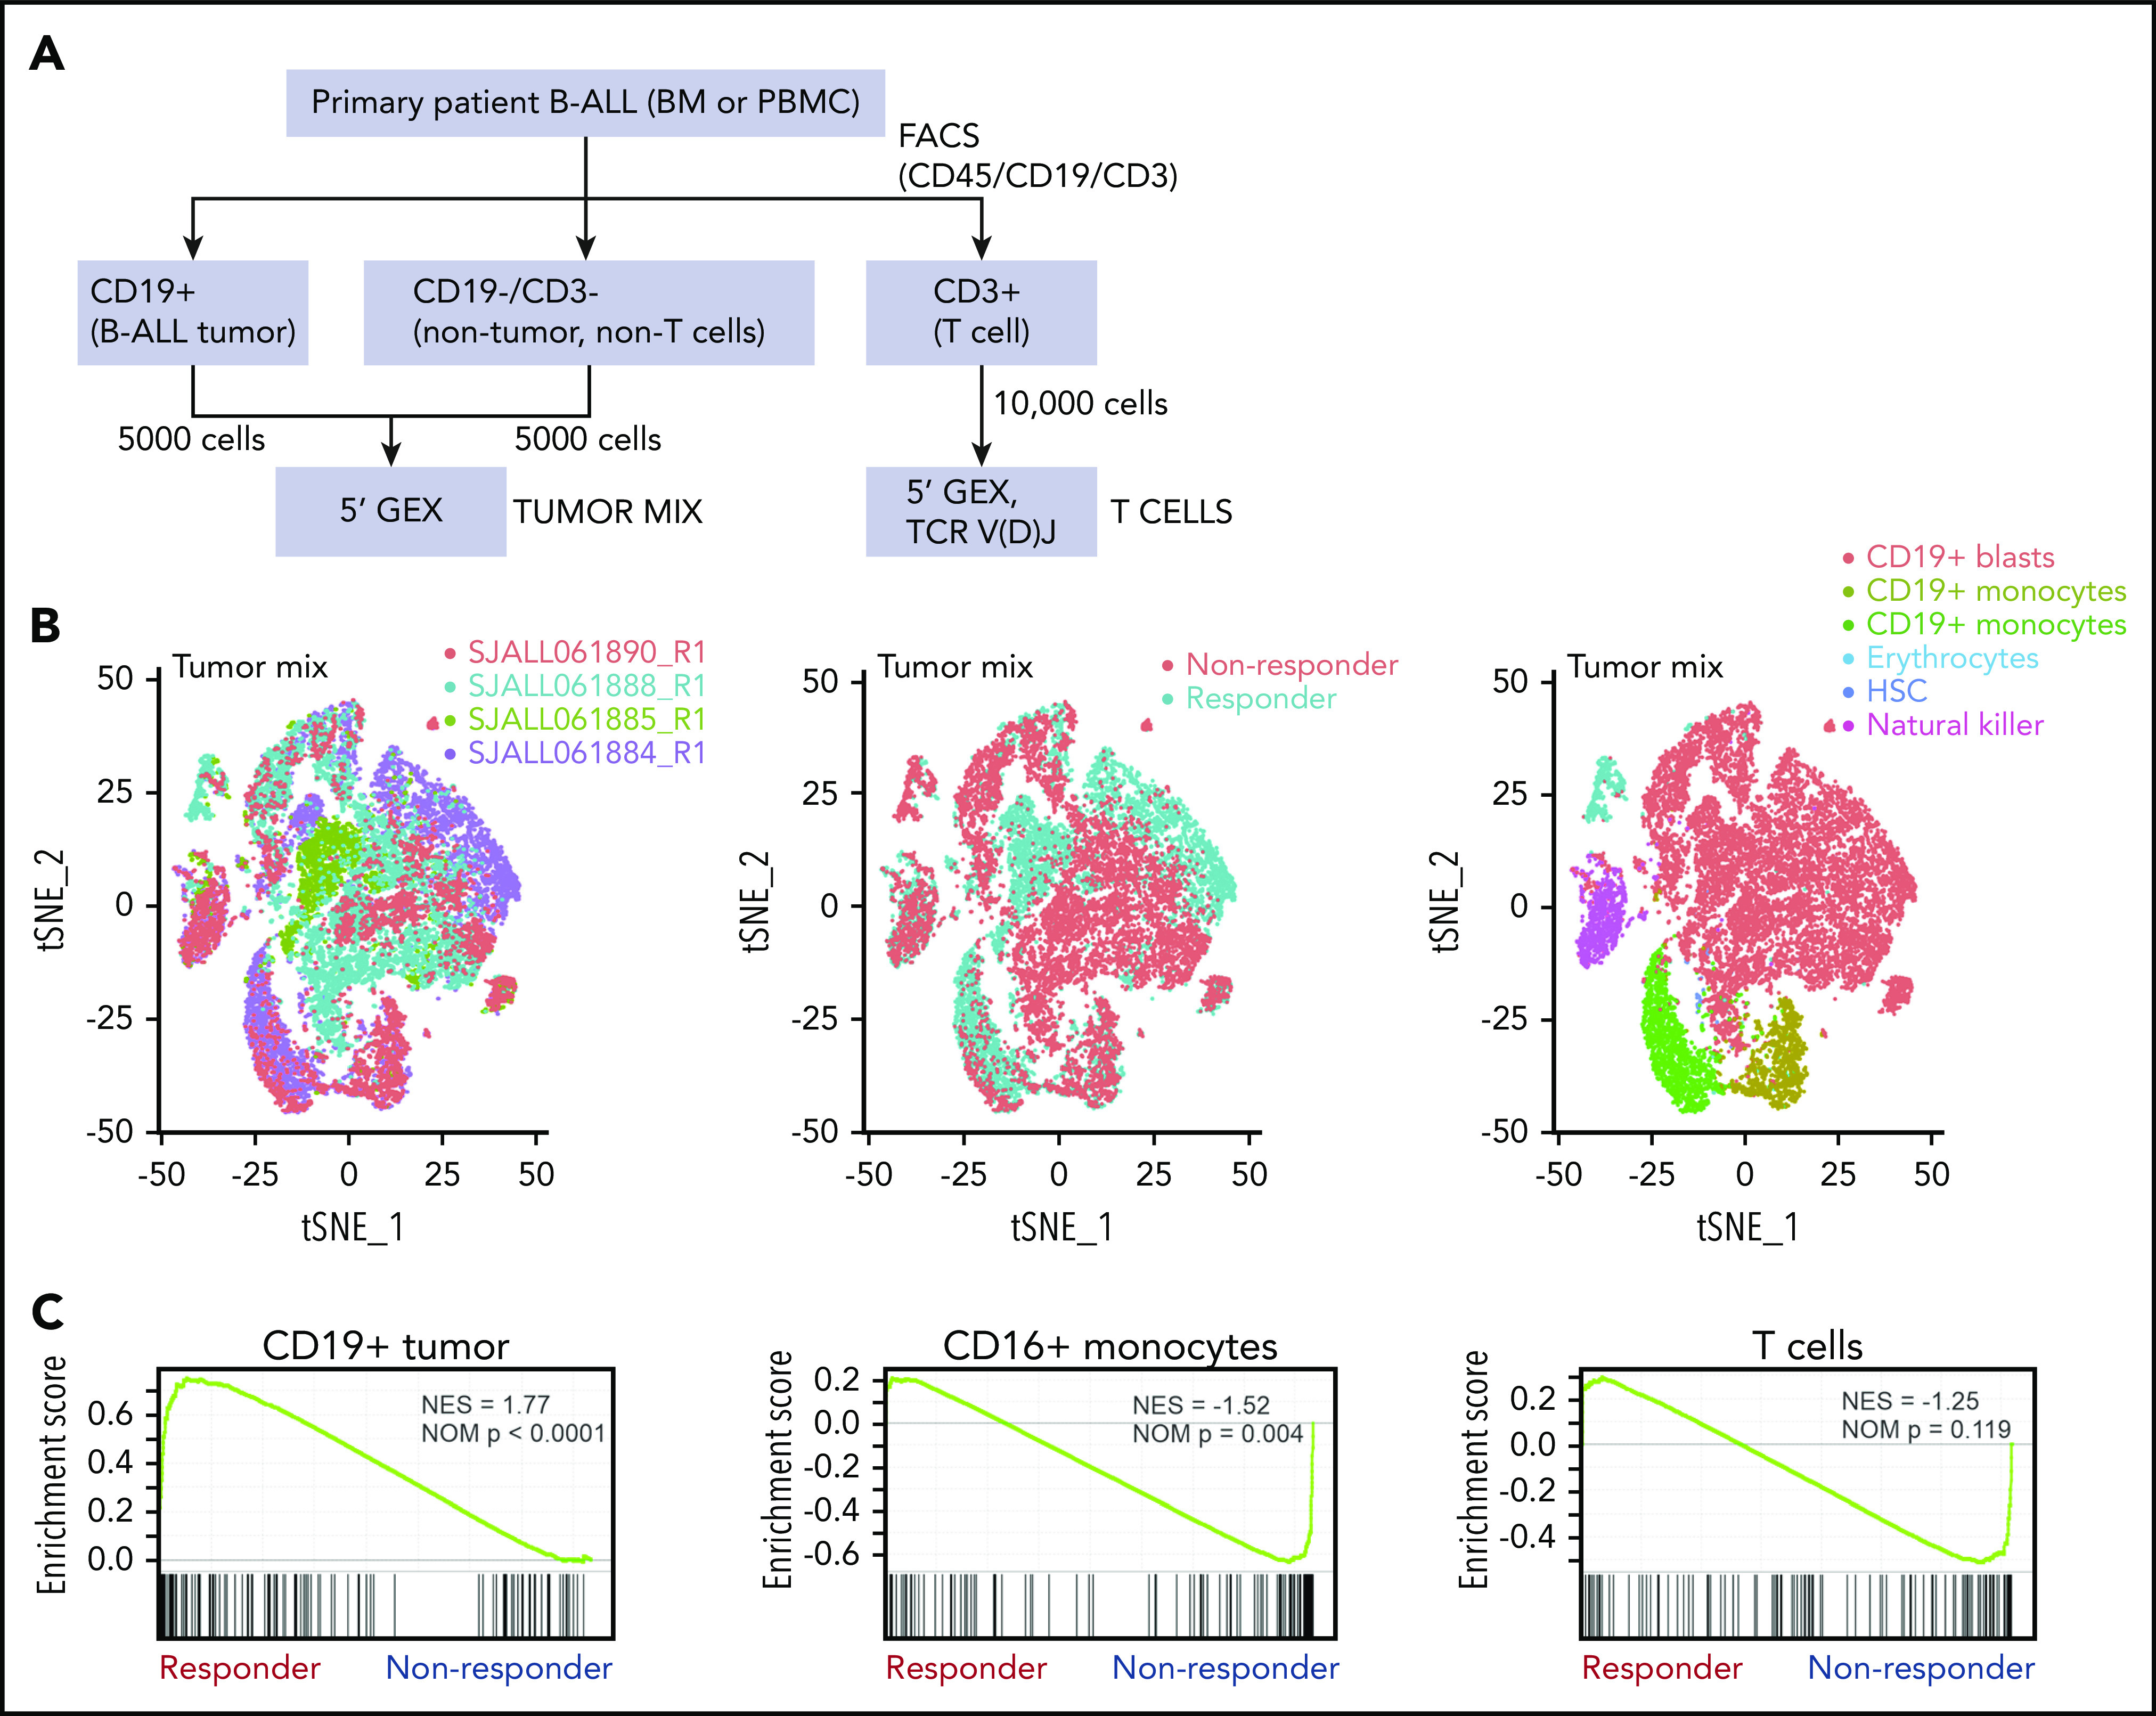
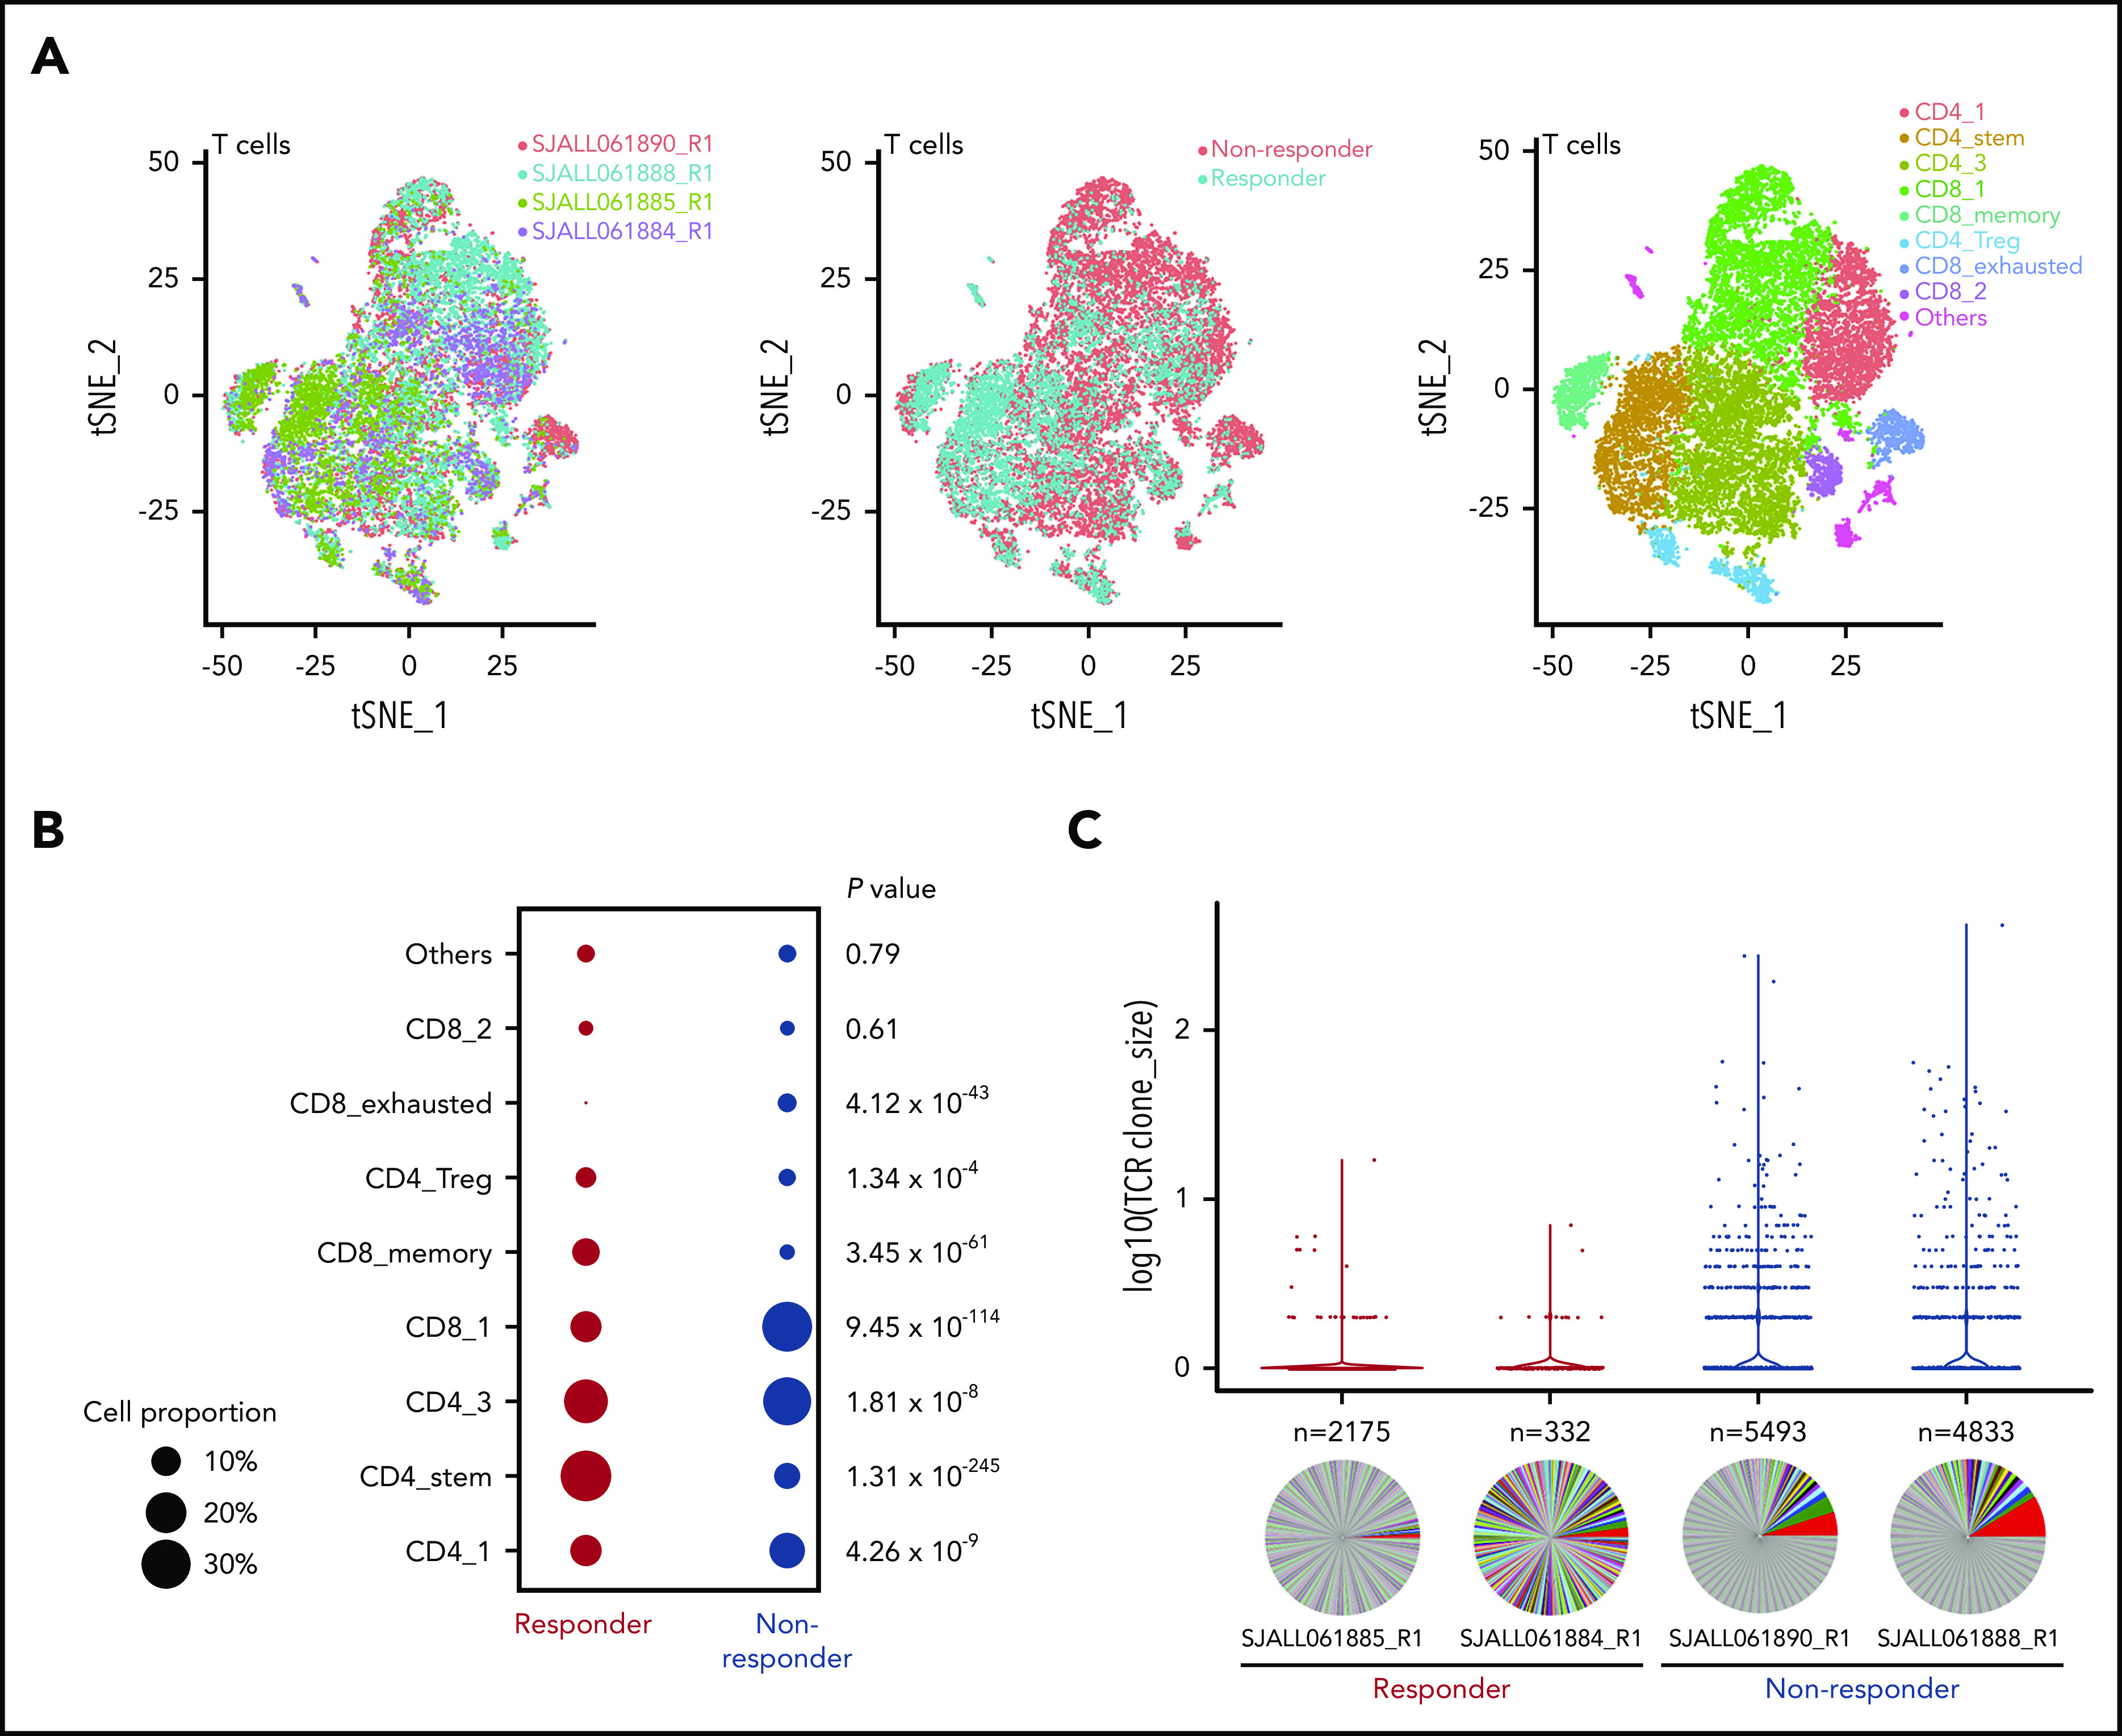
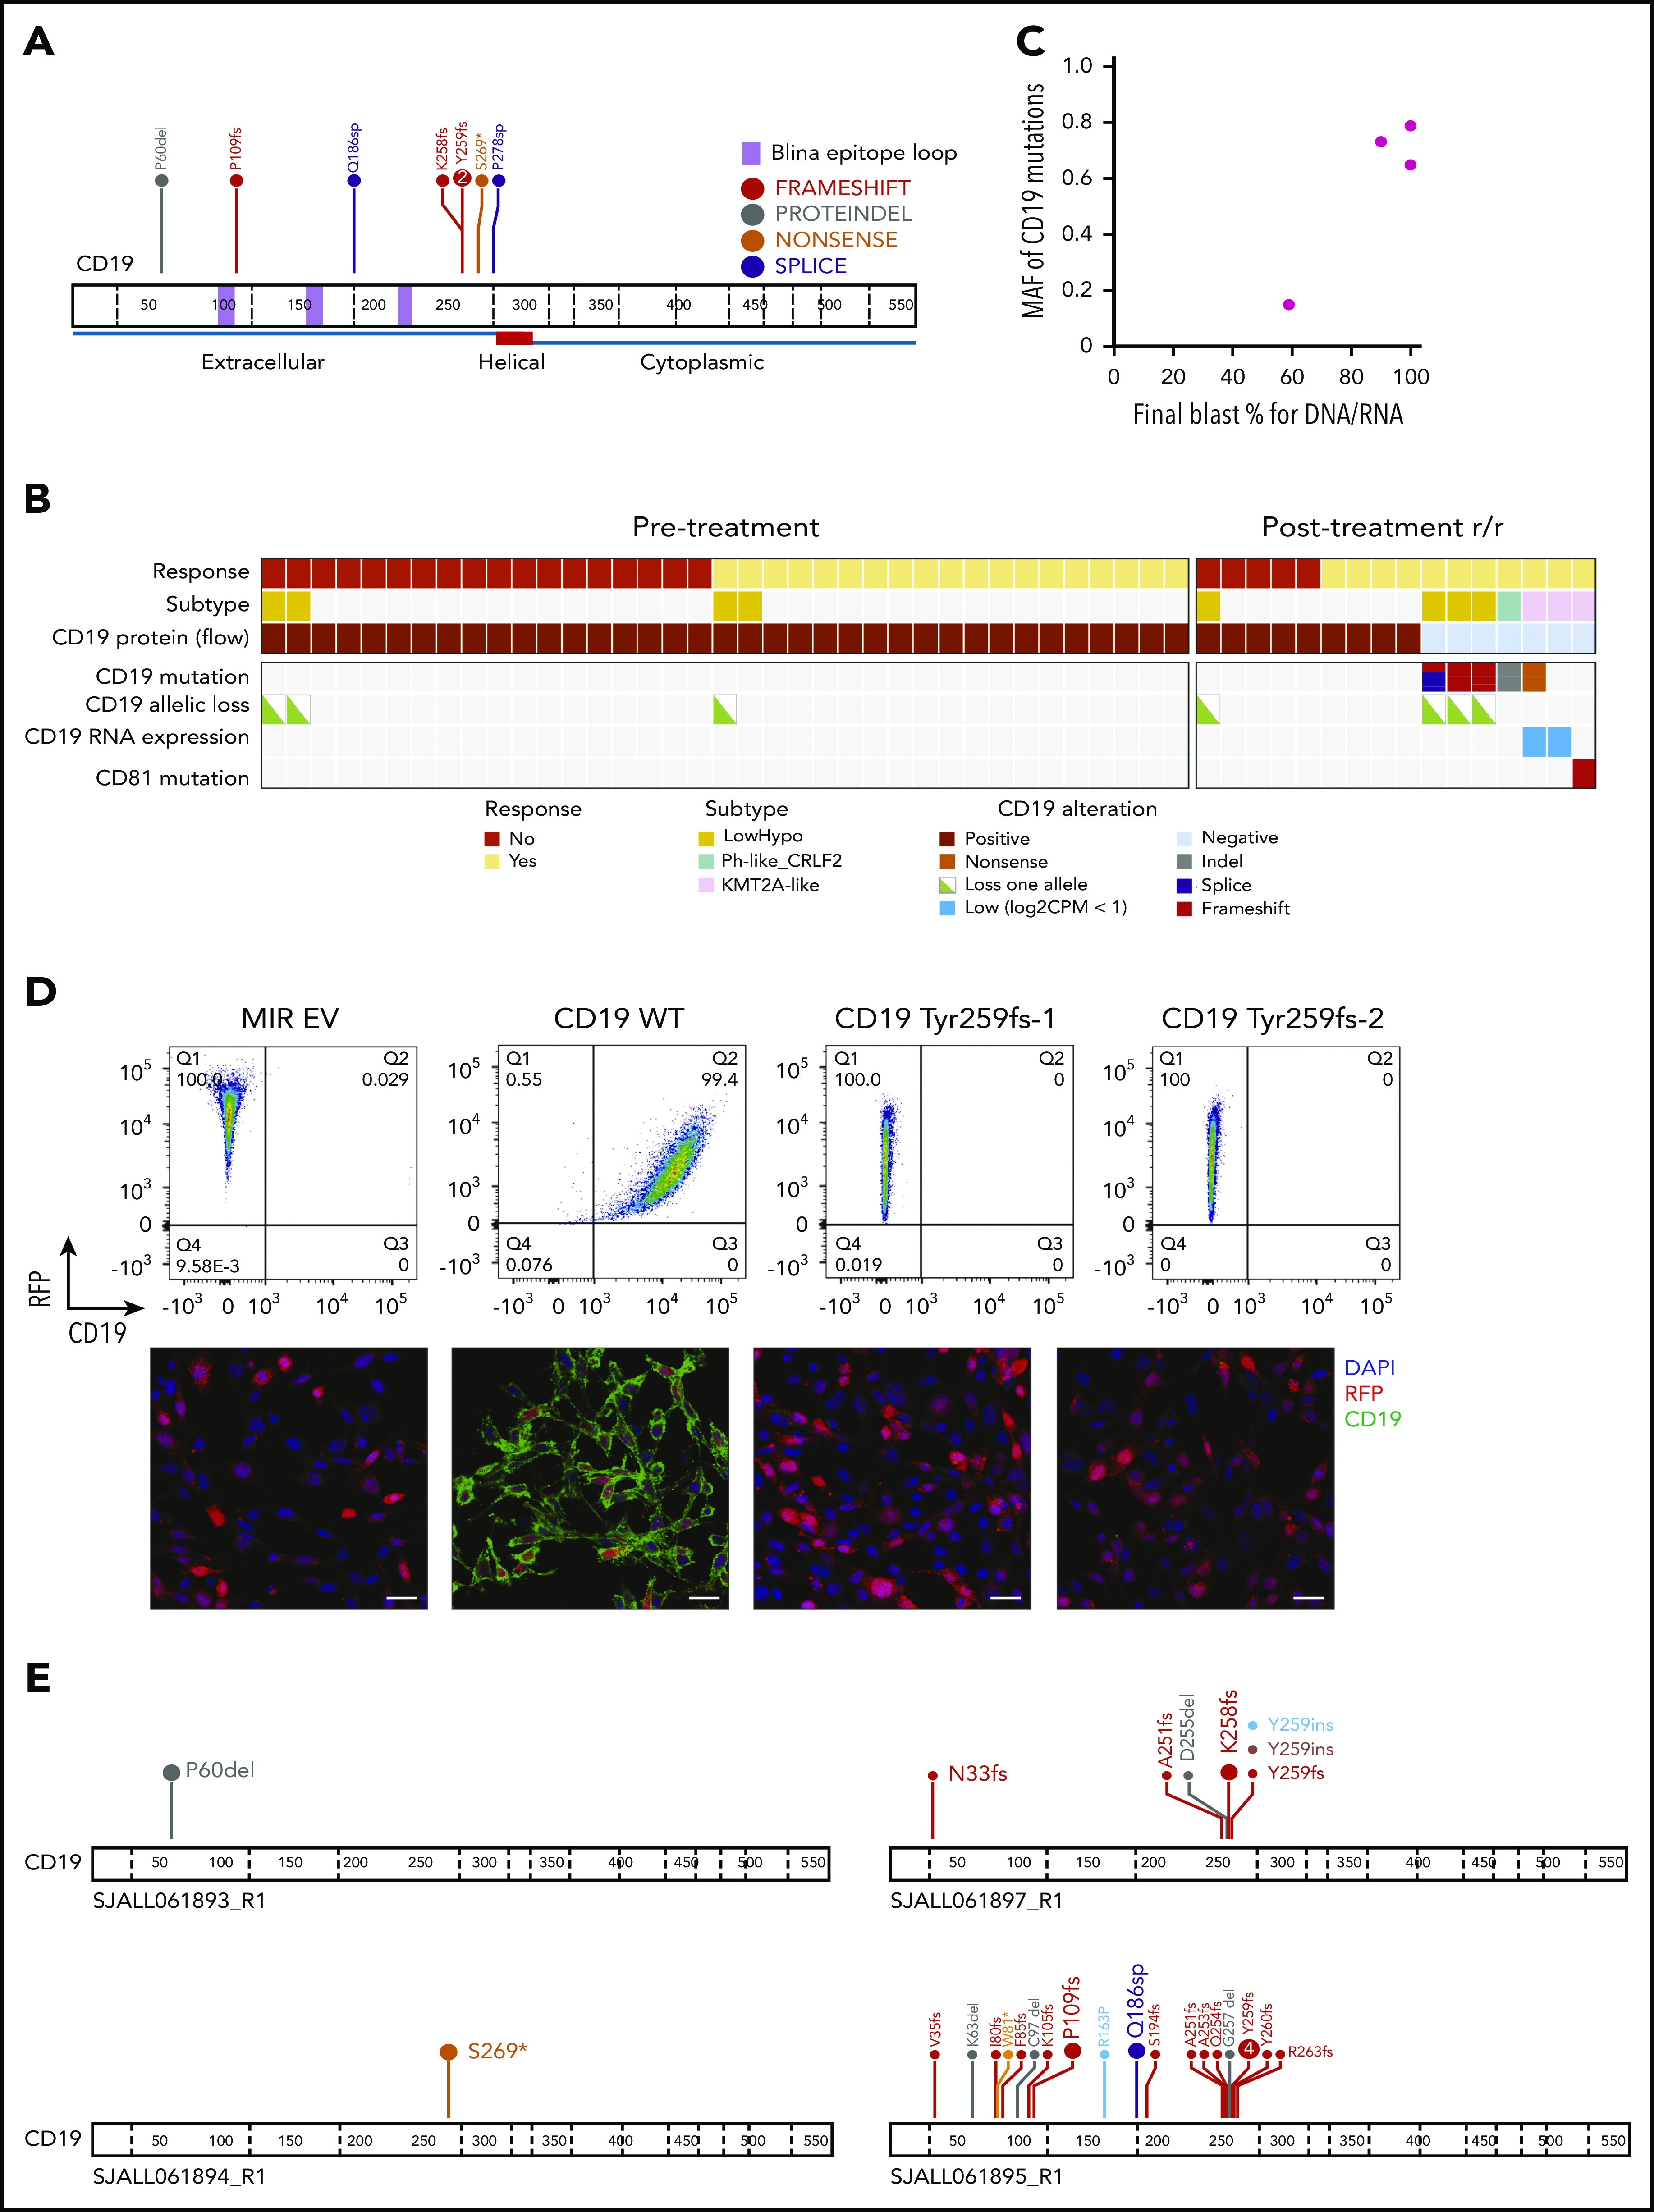
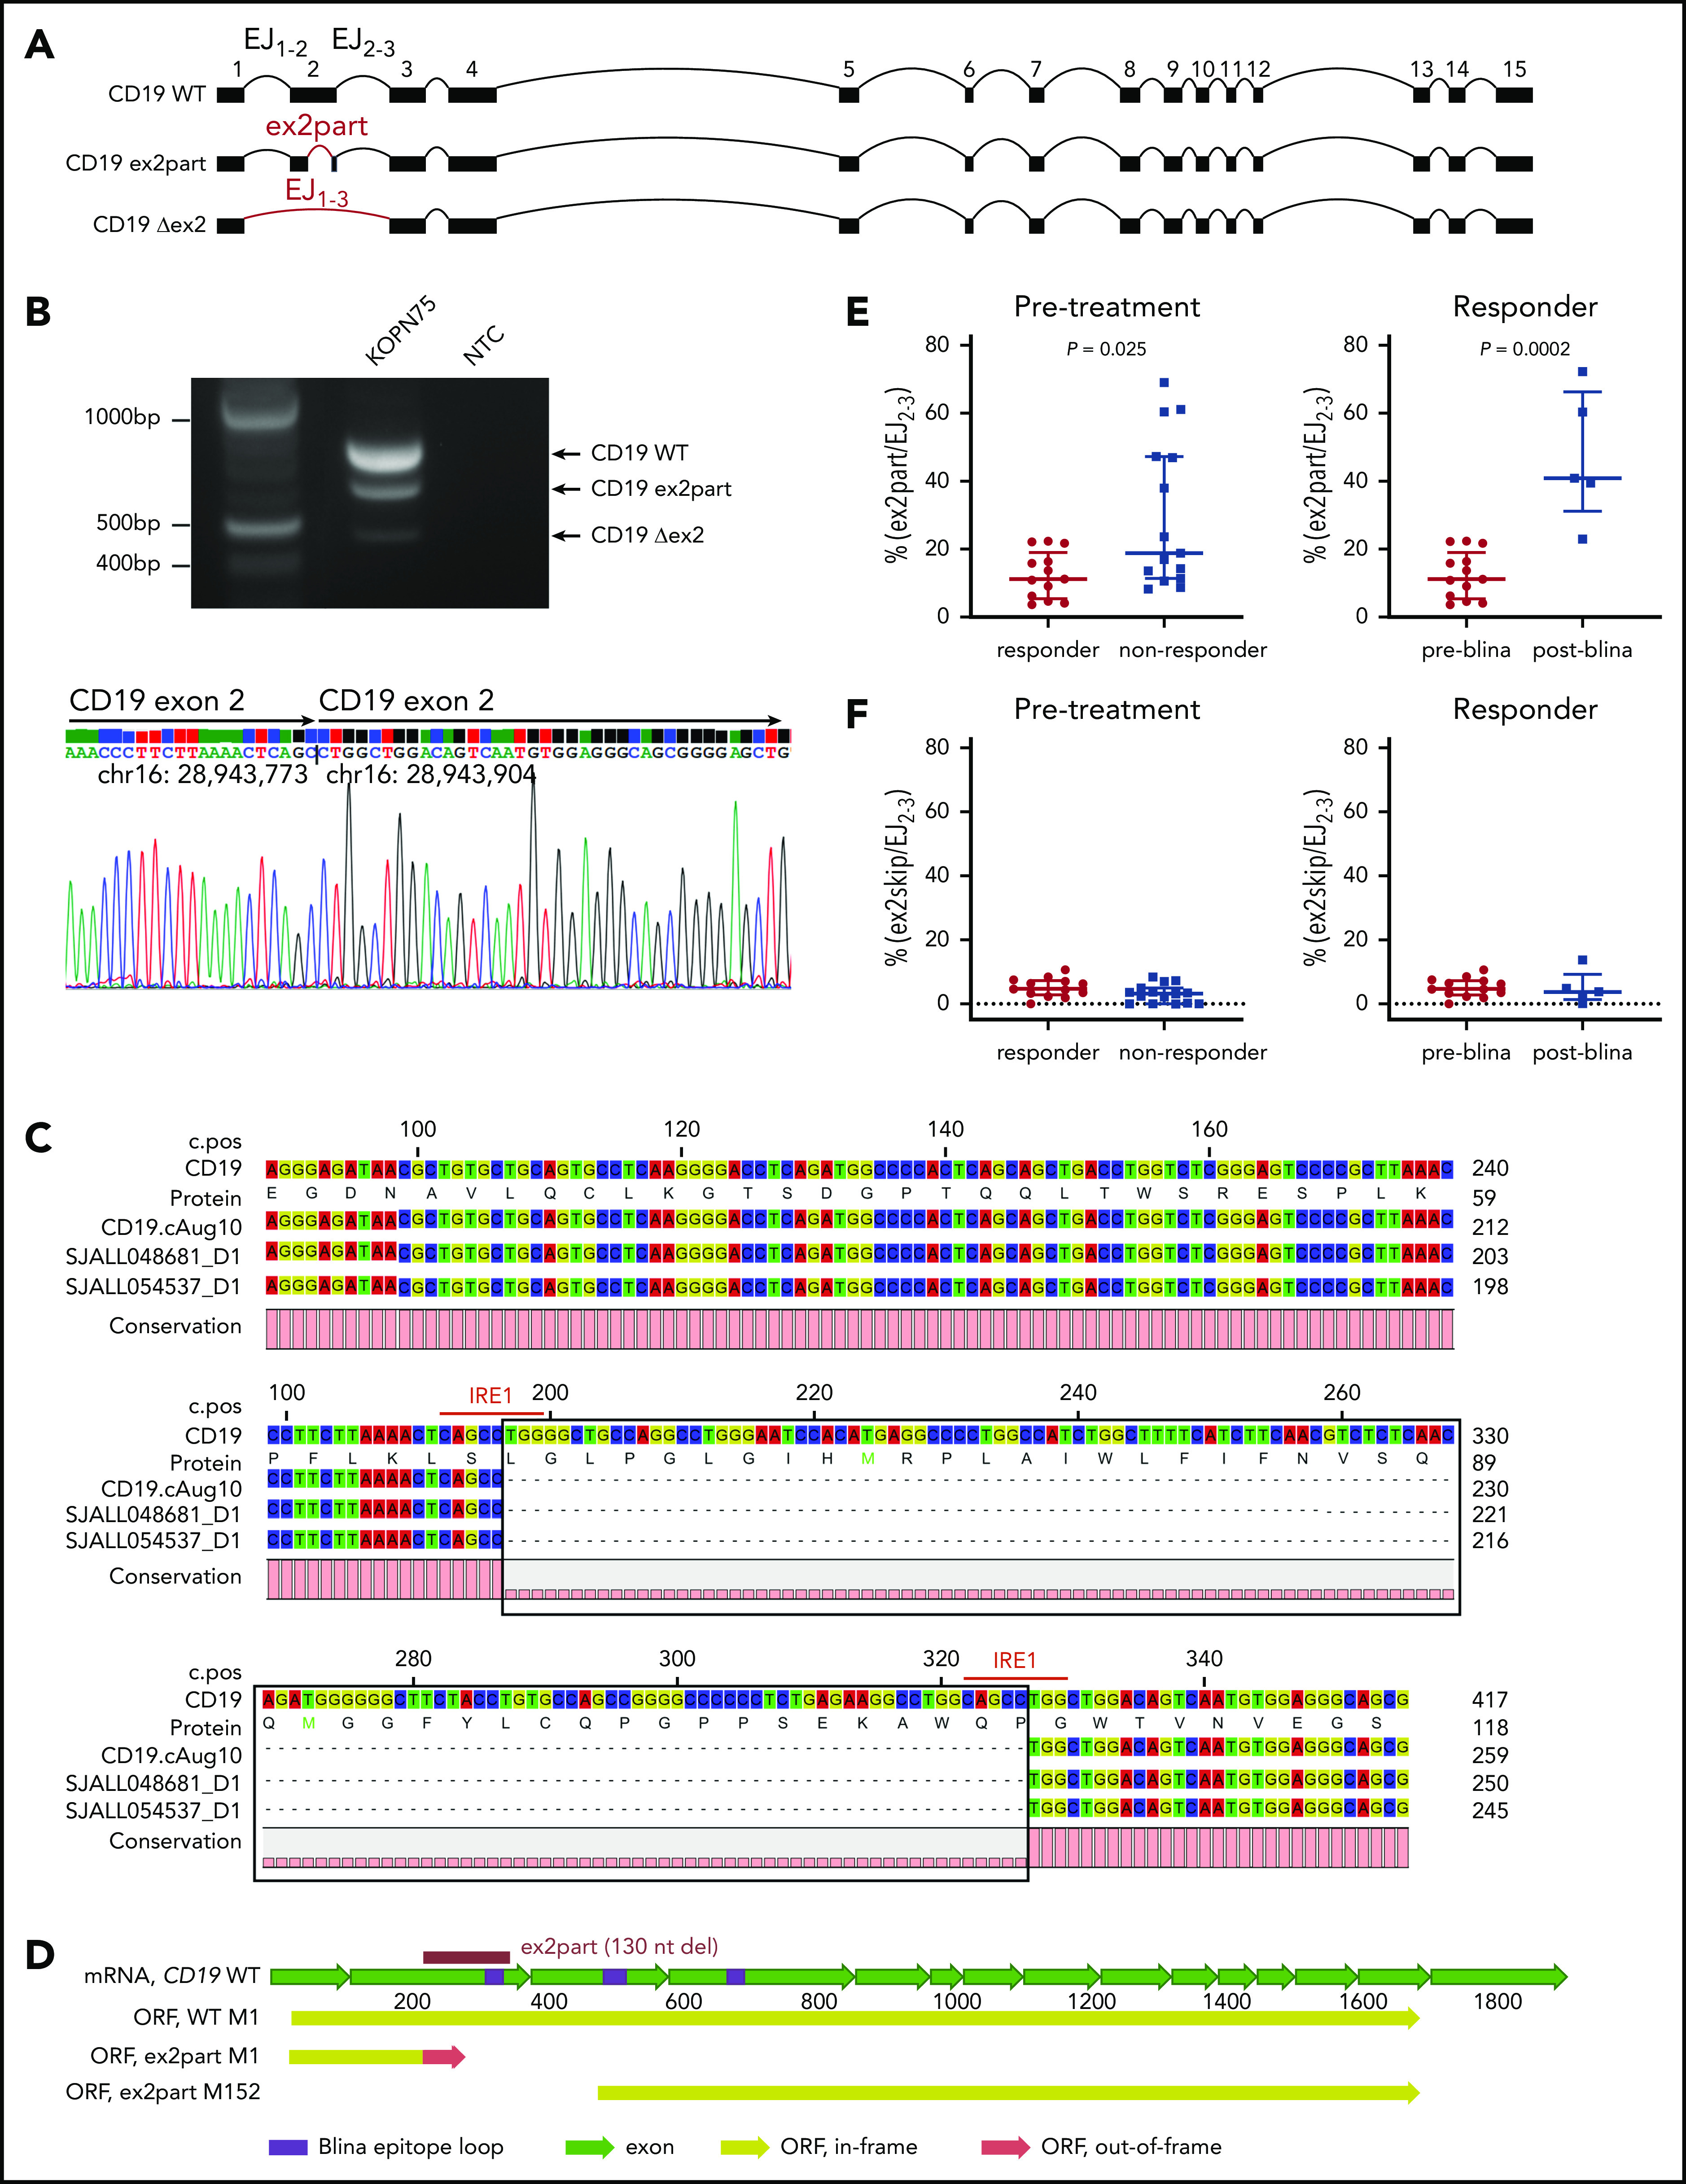
Blinatumomab, a bispecific antibody that directs CD3+ T cells to CD19+ tumor cells, shows variable efficacy in B-progenitor acute lymphoblastic leukemia (B-ALL). To determine tumor-intrinsic and -extrinsic determinants of response, we studied 44 adults with relapsed or refractory B-ALL (including 2 minimal residual disease positive) treated with blinatumomab using bulk tumor and single-cell sequencing. The overall response rate in patients with hematological disease was 55%, with a high response rate in those with CRLF2-rearranged Philadelphia chromosome-like ALL (12 [75%] of 16). Pretreatment samples of responders exhibited a tumor-intrinsic transcriptomic signature of heightened immune response. Multiple mechanisms resulted in loss of CD19 expression, including CD19 mutations, CD19-mutant allele-specific expression, low CD19 RNA expression, and mutations in CD19 signaling complex member CD81. Patients with low hypodiploid ALL were prone to CD19- relapse resulting from aneuploidy-mediated loss of the nonmutated CD19 allele. Increased expression of a CD19 isoform with intraexonic splicing of exon 2, CD19 ex2part, at baseline or during therapy was associated with treatment failure. These analyses demonstrate both tumor-intrinsic and -extrinsic factors influence blinatumomab response. We show that CD19 mutations are commonly detected in CD19- relapse during blinatumomab treatment. Identification of the CD19 ex2part splice variant represents a new biomarker predictive of blinatumomab therapy failure.


Conflict of interest statement

Conflict-of-interest disclosure: C.G.M. has received consulting and speaking fees from Illumina and Amgen and research support from Loxo Oncology, Pfizer, and Abbvie and holds stock in Amgen. P.G.T. has received consulting and/or speaking fees from 10X, Illumina, PACT Pharma, and Aduro Bioetch. The remaining authors declare no competing financial interests.

Figures

None
Graphical abstract
Figure 1.
Figure 1.
Cohort characteristics and blinatumomab response. (A) CONSORT diagram of B-ALL patients included in the study. (B) Ribbon plot showing response to blinatumomab in each genomic subtype. Patients with full hematological disease (≥5% blasts; 42 of 44 patients) were included for response analysis. (C) Genomic alterations identified by whole-genome sequencing and whole-exome sequencing (WES) in blinatumomab responders compared with nonresponders (NRs). del, deletion; dim, diminished; ins, insertion; neg, negative; Ph, Philadelphia chromosome; pos, positive.
Figure 2.
Figure 2.
Heightened immune response signature in blinatumomab responders. (A) Supervised hierarchical clustering of differential gene expressions showing upregulated genes in responders (n = 227 genes) and nonresponders (n = 118 genes). (B) Differential gene expression in responders. Protein coding genes with log counts per million (CPMs) >0 displayed. P < .01 and log2 fold-change >1 (red dots); P < .01 and log2 fold-change <1 (blue dots). (C) STRING (Search Tool for Retrieval of Interacting Genes/Proteins) protein-protein interaction network of upregulated genes (n = 227) in responders. The minimum required interaction score was set to 0.4, and the disconnected nodes were removed. (D) Enrichment of Gene Ontology (GO) pathways in responders. (E) Significantly enriched gene set enrichment analysis (GSEA) gene sets in responders. FDR, false discovery rate; NOM, nominal; TNFα, tumor necrosis factor α.
Figure 3.
Figure 3.
Single-cell analysis of tumor mix cells. (A) Workflow for identifying tumor cells, T cells, and nontumor non–T cells for single-cell analysis by 10× Genomics in 2 responders, 2 nonresponders, and 1 postblinatumomab relapse sample. (B) tSNE plots of tumor mix cells showing 2 responders and 2 nonresponders visualized by sample, responder/nonresponder, and cell type. SJALL061890_R1 (n = 4512 cells), SJALL061888_R1 (n = 10 129 cells), SJALL061885_R1 (n = 4470 cells), and SJALL061884_R1 (n = 6275 cells). (C) GSEA of 10× Genomics 5′ gene expression of tumor mix cells showing enrichment of blinatumomab responder signature identified in bulk RNA-seq in CD19+ tumor cells from responders. BM, bone marrow; FACS, fluorescence-activated cell sorting; HSC, hematopoietic stem cell; NES, normalized enrichment score; NOM, nominal; PBMC, peripheral blood mononuclear cell; tSNE, t-distributed stochastic neighbor embedding.
Figure 4.
Figure 4.
Single-cell analysis of T cells. (A) t-distributed stochastic neighbor embedding (tSNE) plots of CD3+ T cells showing 2 responders and 2 nonresponders visualized by sample, responder/nonresponder, and T-cell type. SJALL061890_R1 (n = 7814 cells), SJALL061888_R1 (n = 10 807 cells), SJALL061885_R1 (n = 3557 cells), and SJALL061884_R1 (n = 1979 cells). (B) Proportion of different T-cell subsets present in responders compared with nonresponders. P value determined using Fisher’s exact test. (C) T-cell receptor (TCR) clonal expansion in responders and nonresponders. Clone size is shown on the y-axis. The number of different clones identified in each case is indicated above the pie chart. Pie charts demonstrate clonal diversity. Responders had restricted clonal expansion and increased diversity. Treg, regulatory T cell.
Figure 5.
Figure 5.
Mechanisms of CD19 loss during blinatumomab treatment. (A) Protein domain plot of CD19 mutations identified in posttreatment CD19 relapse samples. (B) Analysis of CD19 locus and CD81 mutations in pre- and posttreatment samples. (C) MAF of CD19 mutations by blast percentage in CD19 relapse samples. (D) Cell surface expression of CD19 (x-axis) in NIH-3T3 cells with MSCV-IRES-RFP (MIR) empty vector (EV), wild-type (WT) CD19, Tyr259fs-1 (c.775 T→TGT), and Tyr259fs-2 CD19 mutations (c.776 A→ATTGGAGATCCC) by flow cytometry (top) and immunofluorescence (bottom). Images were taken at 40× magnification using Nikon C2 confocal on TE2000 ET microscope. Scale bars, 25 μm. CD19, green; RFP, red; DAPI, blue. (E) Protein domain plots for 4 CD19 relapse samples subject to targeted sequencing. Enlarged font represents mutations identified by WES (100× coverage); smaller font represents mutations identified by targeted sequencing of CD19 (20 000× coverage). CPM, count per million; DAPI, 4′,6-diamidino-2-phenylindole; hypo, hypodiploid; RFP, red fluorescent protein.
Figure 6.
Figure 6.
Identification of an alternative CD19 splicing isoform (ex2part) associated with blinatumomab response. (A) Visualization of 3 CD19 isoforms: wild type (WT), ex2part, and ex2skip (Δex2). (B) Reverse transcription polymerase chain reaction of CD19 in KOPN75 cells showing 3 bands corresponding to CD19 WT, ex2part, and ex2skip (top). Sanger sequencing of CD19 ex2part in KOPN75 cells, confirming deletion of 130 nucleotides in exon 2 (bottom). (C) Consensus sequence assembled from Nanopore long-read RNA-seq identified the AceView isoform CD19 cAug10 with ex2part in 2 B-ALL patients. Numbers on top indicate coding sequence position; numbers on the right indicate RNA/protein position. IRE1-mediated splicing sequence CAGCCTGG indicated in red. (D) Full-length structure of CD19 WT and ex2part. Frame-shift partial deletion of exon 2 coding for amino acids Leu66 to Pro109 (ex2part) leads to a new start codon at Met152 of the canonical CD19. Translation of ex2part from the canonical start M1 results in a premature stop codon. (E) Levels of ex2part (E) and ex2skip (F) in pretreatment samples comparing responders (n = 13) and nonresponders (n = 15; left) and preblinatumomab (n = 13) compared with postblinatumomab relapse (n = 5; right). Median and interquartile range are displayed. P value determined using Mann-Whitney test. mRNA, messenger RNA; ORF, open reading frame.

Comment in

  • ALL in escape room.
    Boissel N. Boissel N. Blood. 2021 Jan 28;137(4):432-434. doi: 10.1182/blood.2020008850. Blood. 2021. PMID: 33507297 No abstract available.

References

    1. Kantarjian H, Stein A, Gökbuget N, et al. Blinatumomab versus chemotherapy for advanced acute lymphoblastic leukemia. N Engl J Med. 2017;376(9):836-847. - PMC - PubMed
    1. Topp MS, Kufer P, Gökbuget N, et al. Targeted therapy with the T-cell-engaging antibody blinatumomab of chemotherapy-refractory minimal residual disease in B-lineage acute lymphoblastic leukemia patients results in high response rate and prolonged leukemia-free survival. J Clin Oncol. 2011;29(18):2493-2498. - PubMed
    1. Gökbuget N, Dombret H, Bonifacio M, et al. Blinatumomab for minimal residual disease in adults with B-cell precursor acute lymphoblastic leukemia [published correction appears in Blood. 2019;133(24):2625]. Blood. 2018;131(14):1522-1531. - PMC - PubMed
    1. Duell J, Dittrich M, Bedke T, et al. Frequency of regulatory T cells determines the outcome of the T-cell-engaging antibody blinatumomab in patients with B-precursor ALL. Leukemia. 2017;31(10):2181-2190. - PMC - PubMed
    1. Feucht J, Kayser S, Gorodezki D, et al. T-cell responses against CD19+ pediatric acute lymphoblastic leukemia mediated by bispecific T-cell engager (BiTE) are regulated contrarily by PD-L1 and CD80/CD86 on leukemic blasts. Oncotarget. 2016;7(47):76902-76919. - PMC - PubMed

Publication types

MeSH terms