

Integrin VLA-4 as a PET imaging biomarker of hyper-adhesion in transgenic sickle mice
- PMID: 32882004
- PMCID: PMC7479956
- DOI: 10.1182/bloodadvances.2020002642
Integrin VLA-4 as a PET imaging biomarker of hyper-adhesion in transgenic sickle mice
Abstract
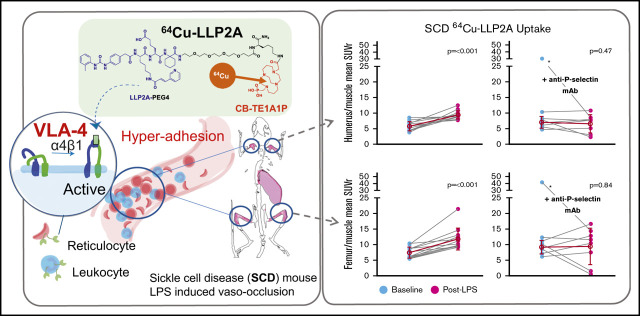
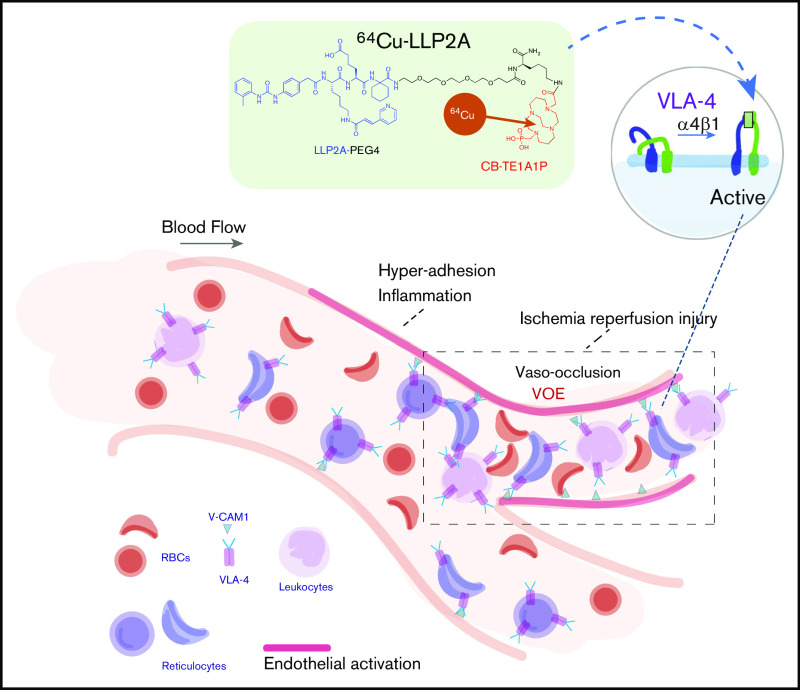
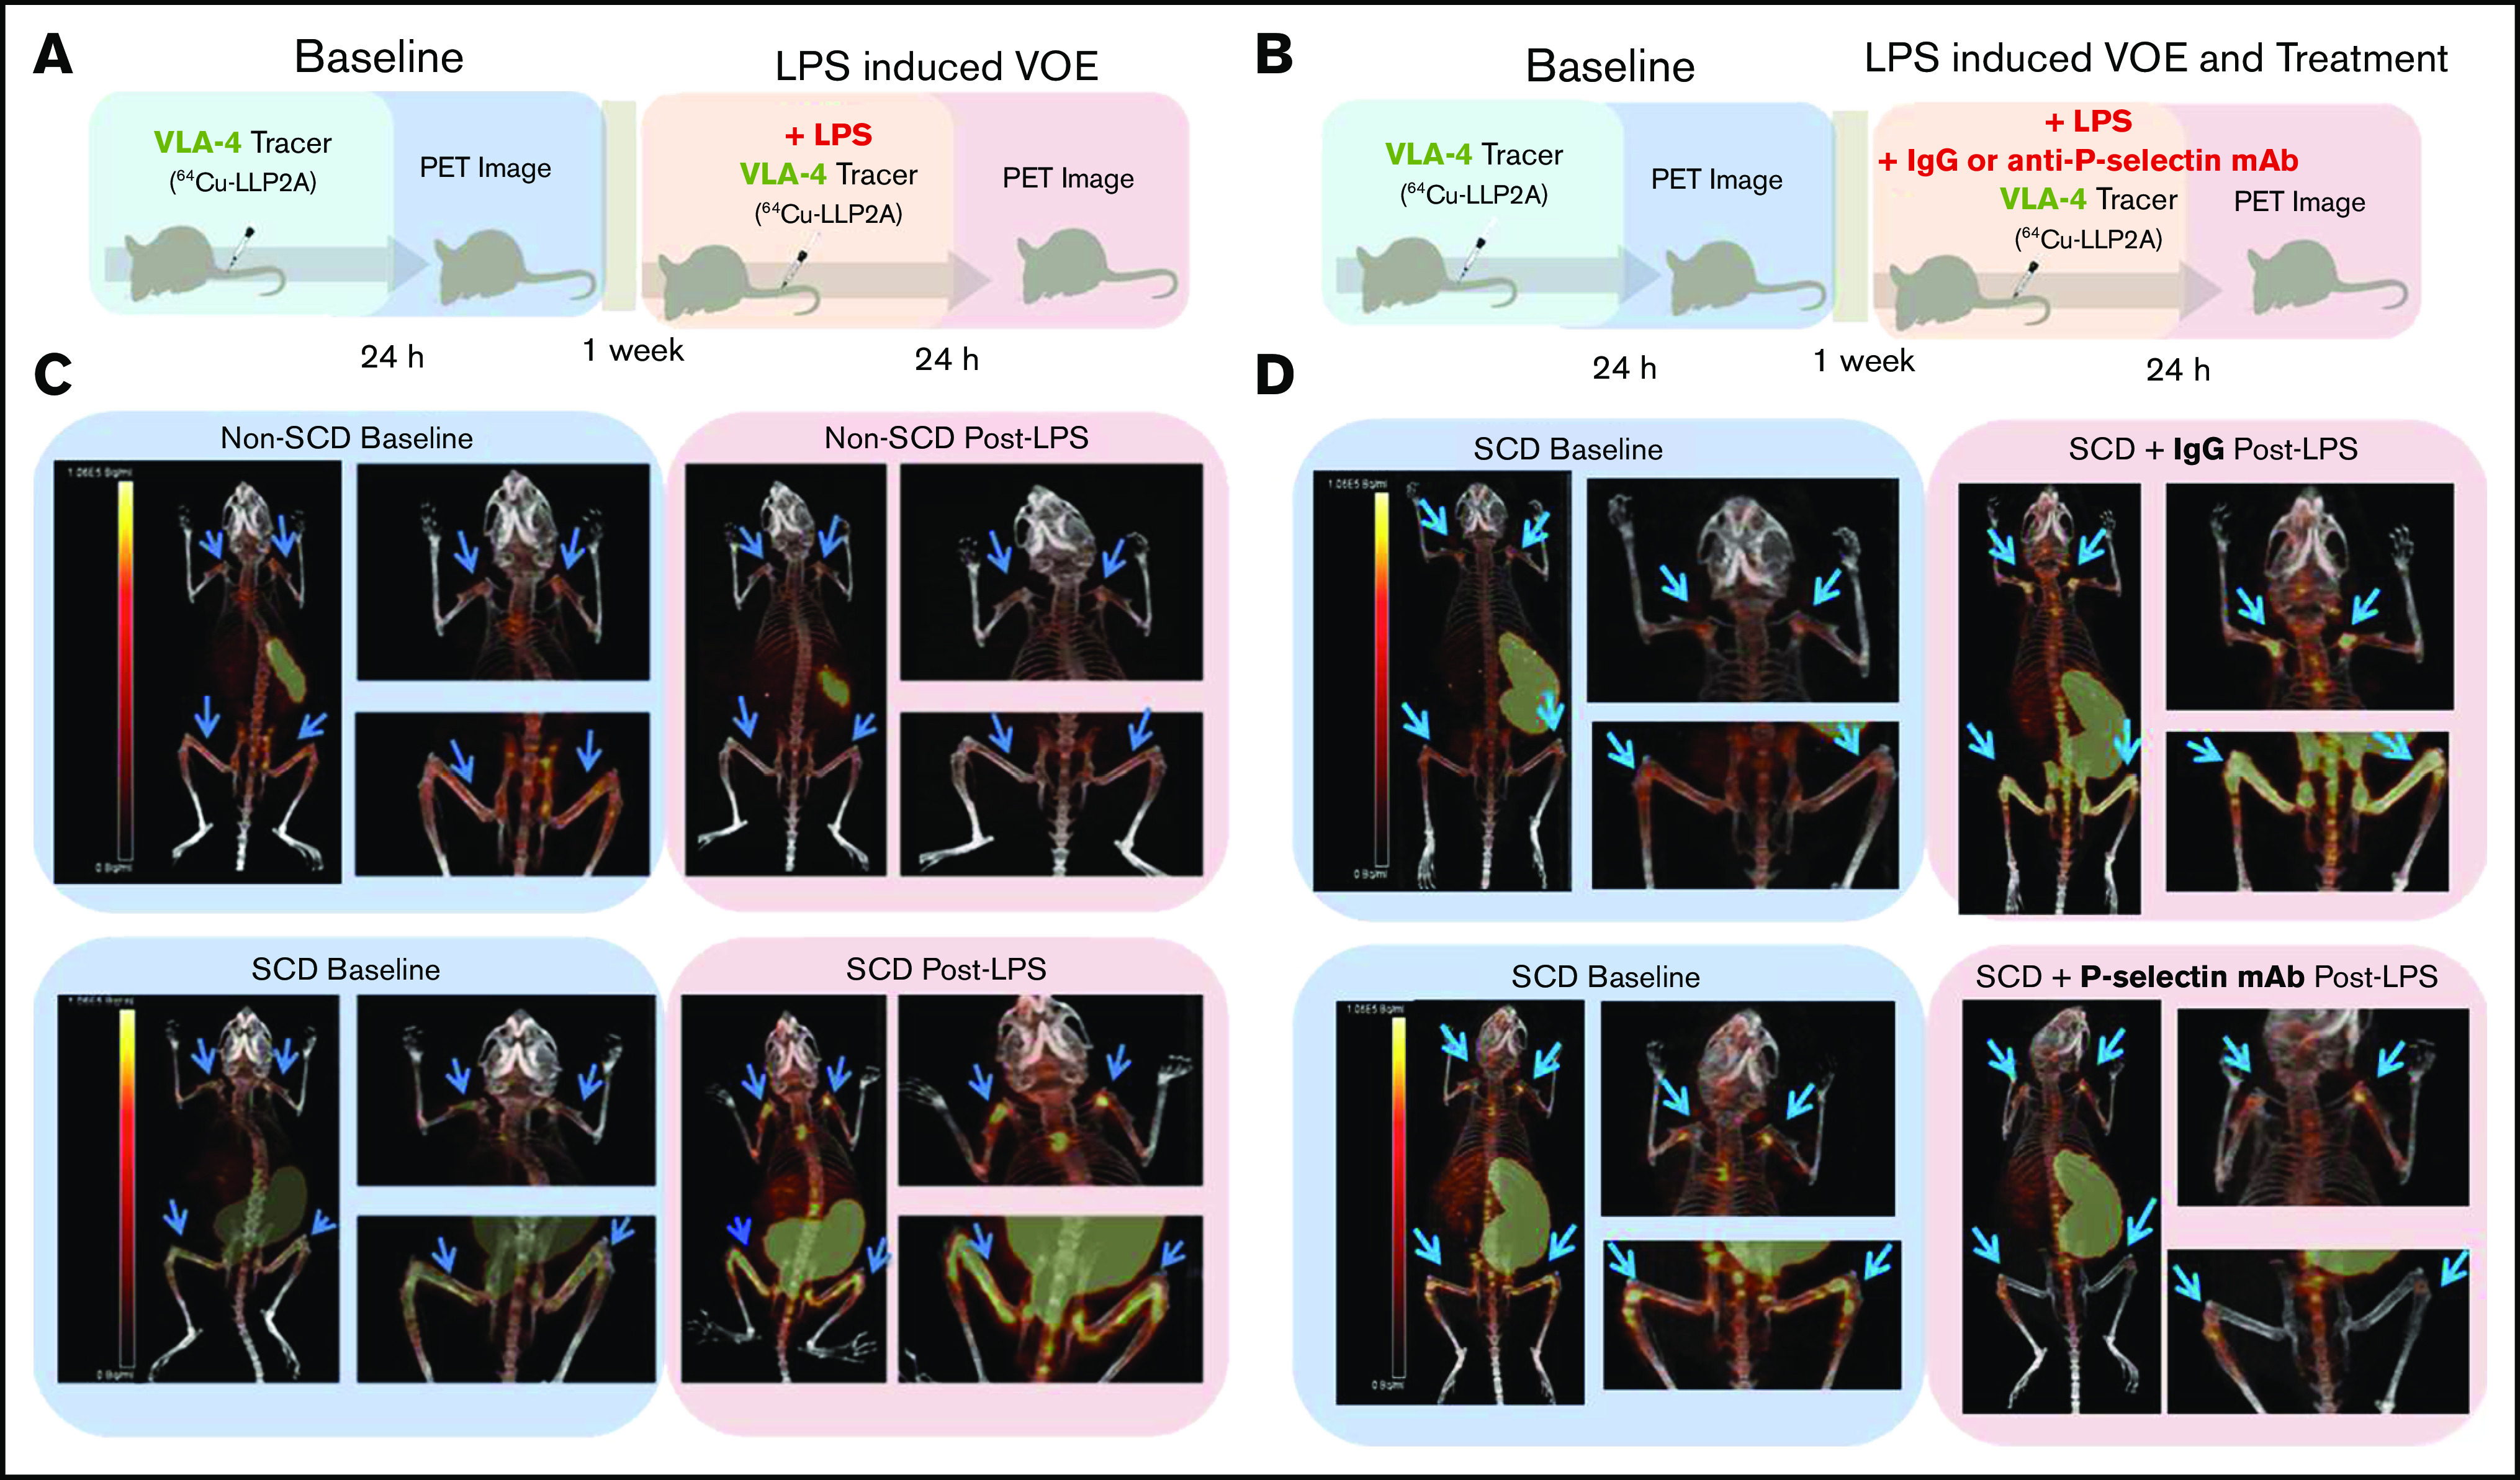
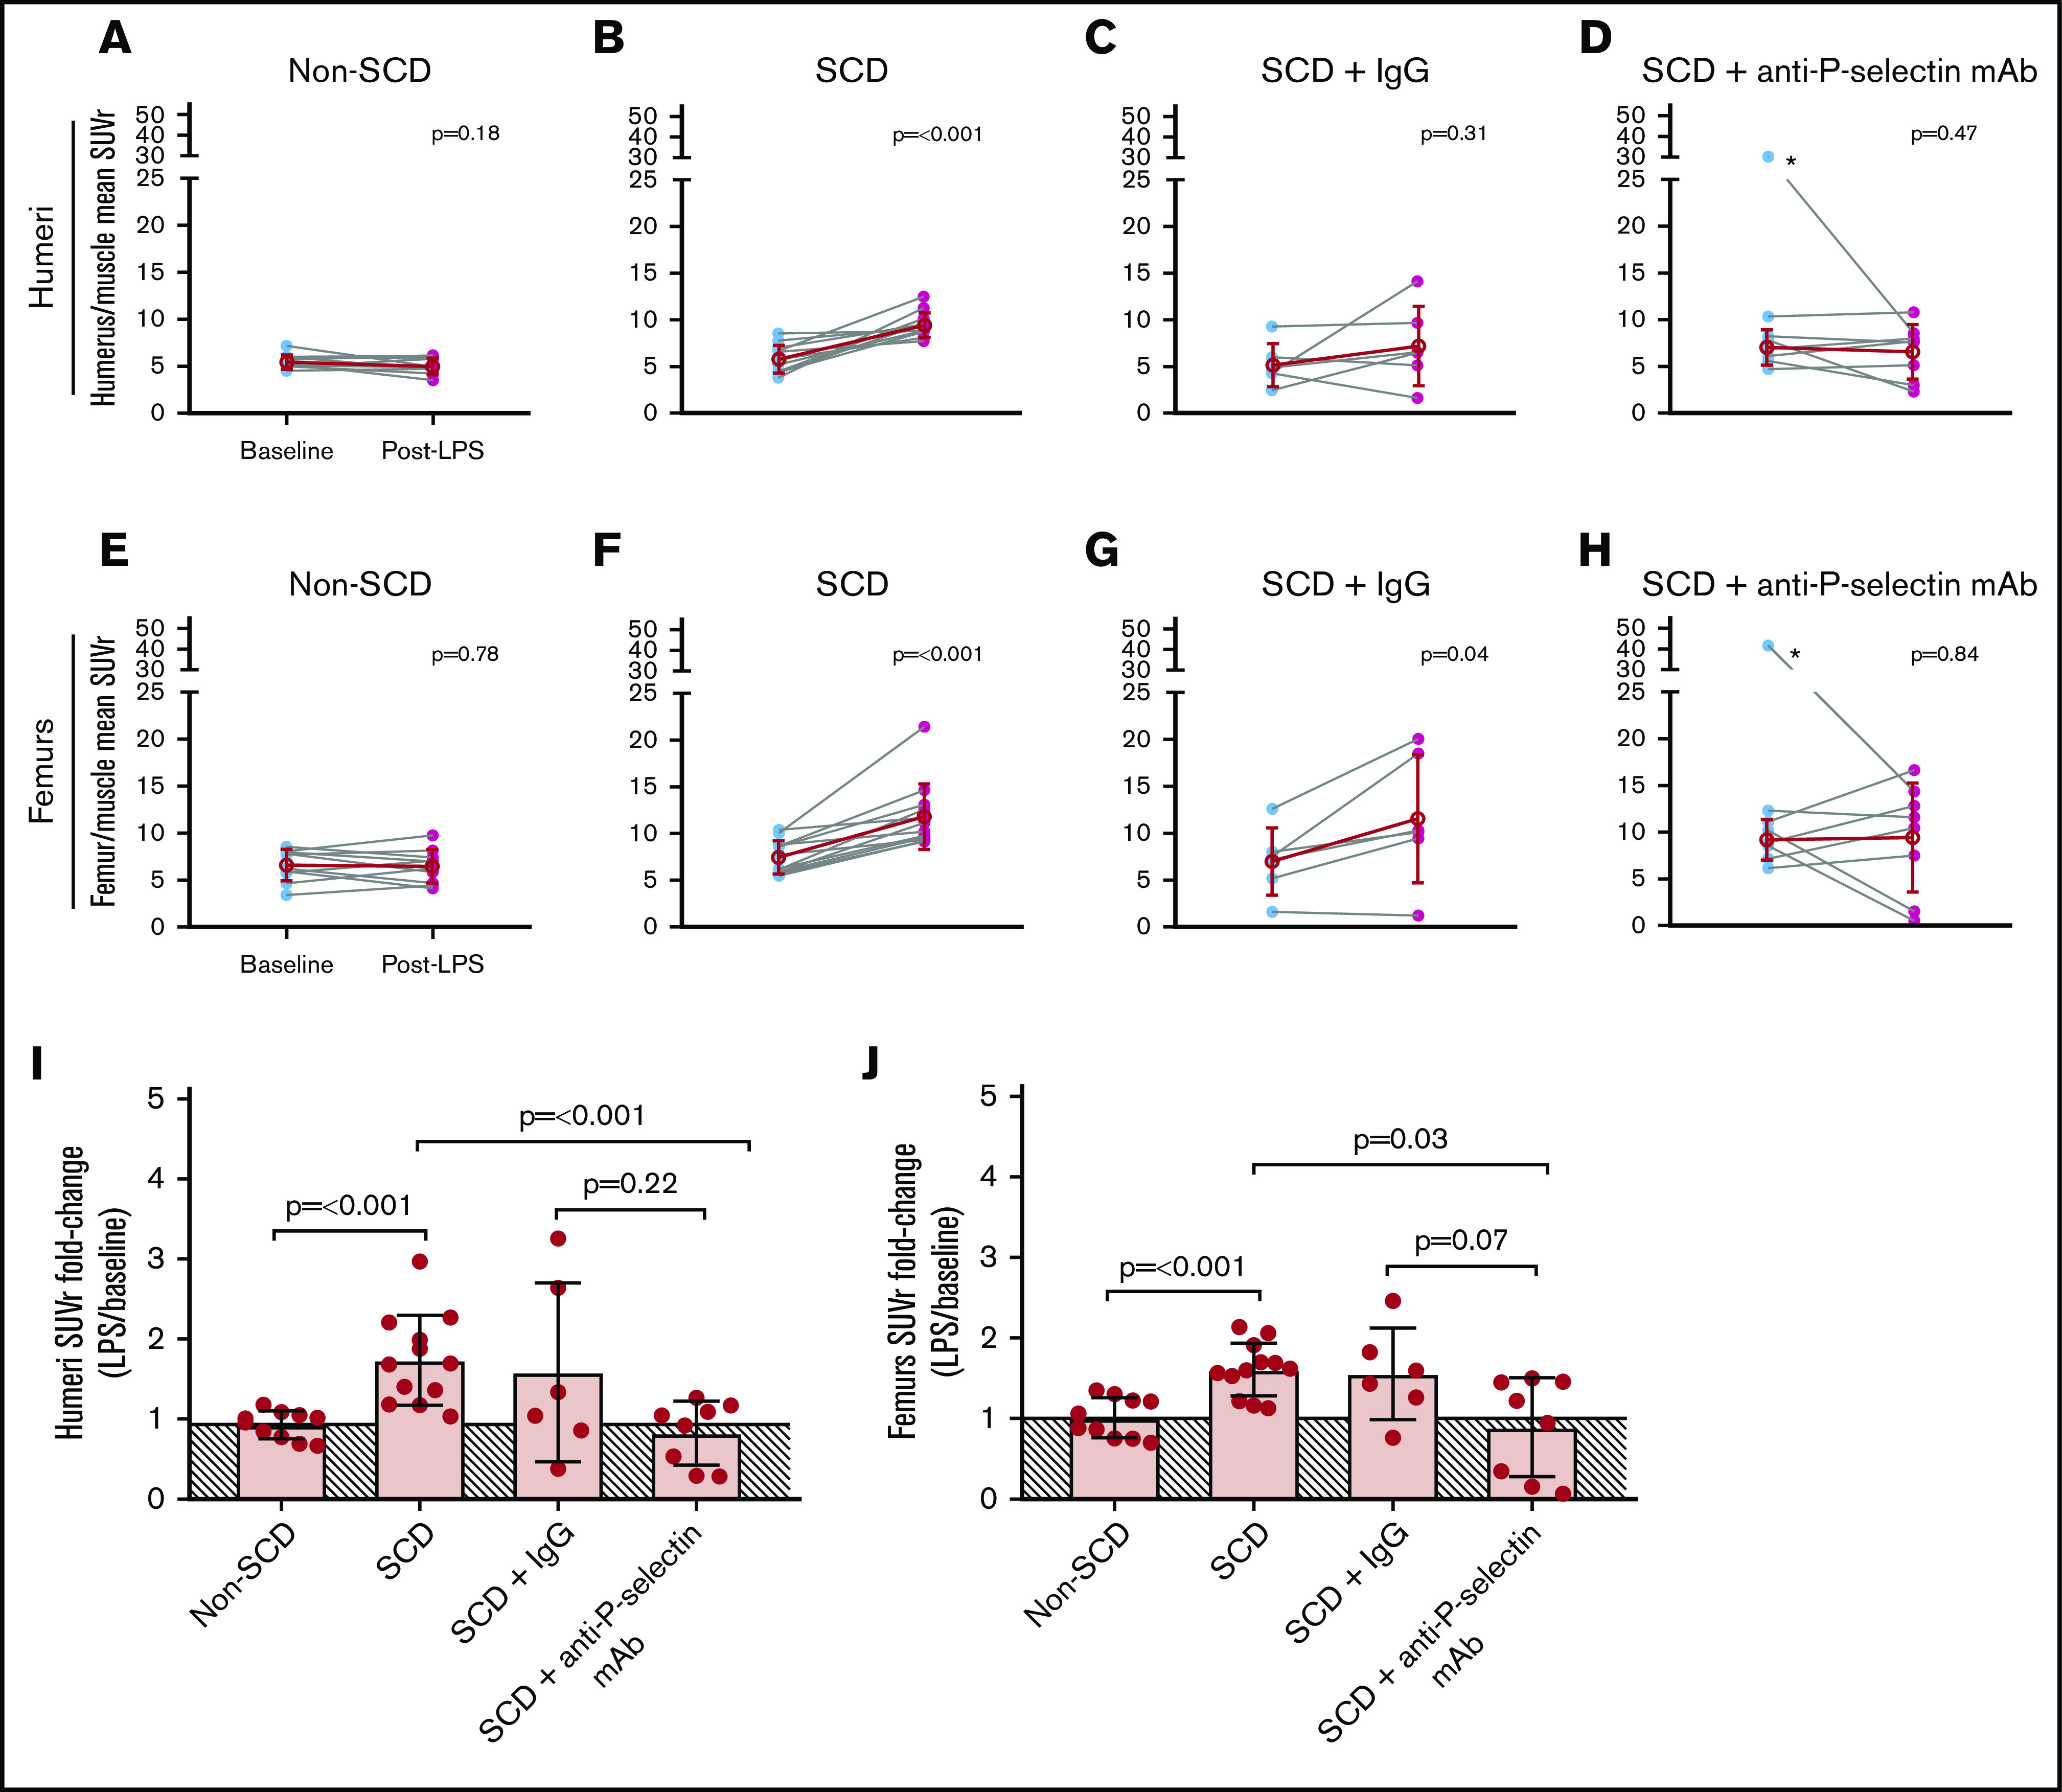
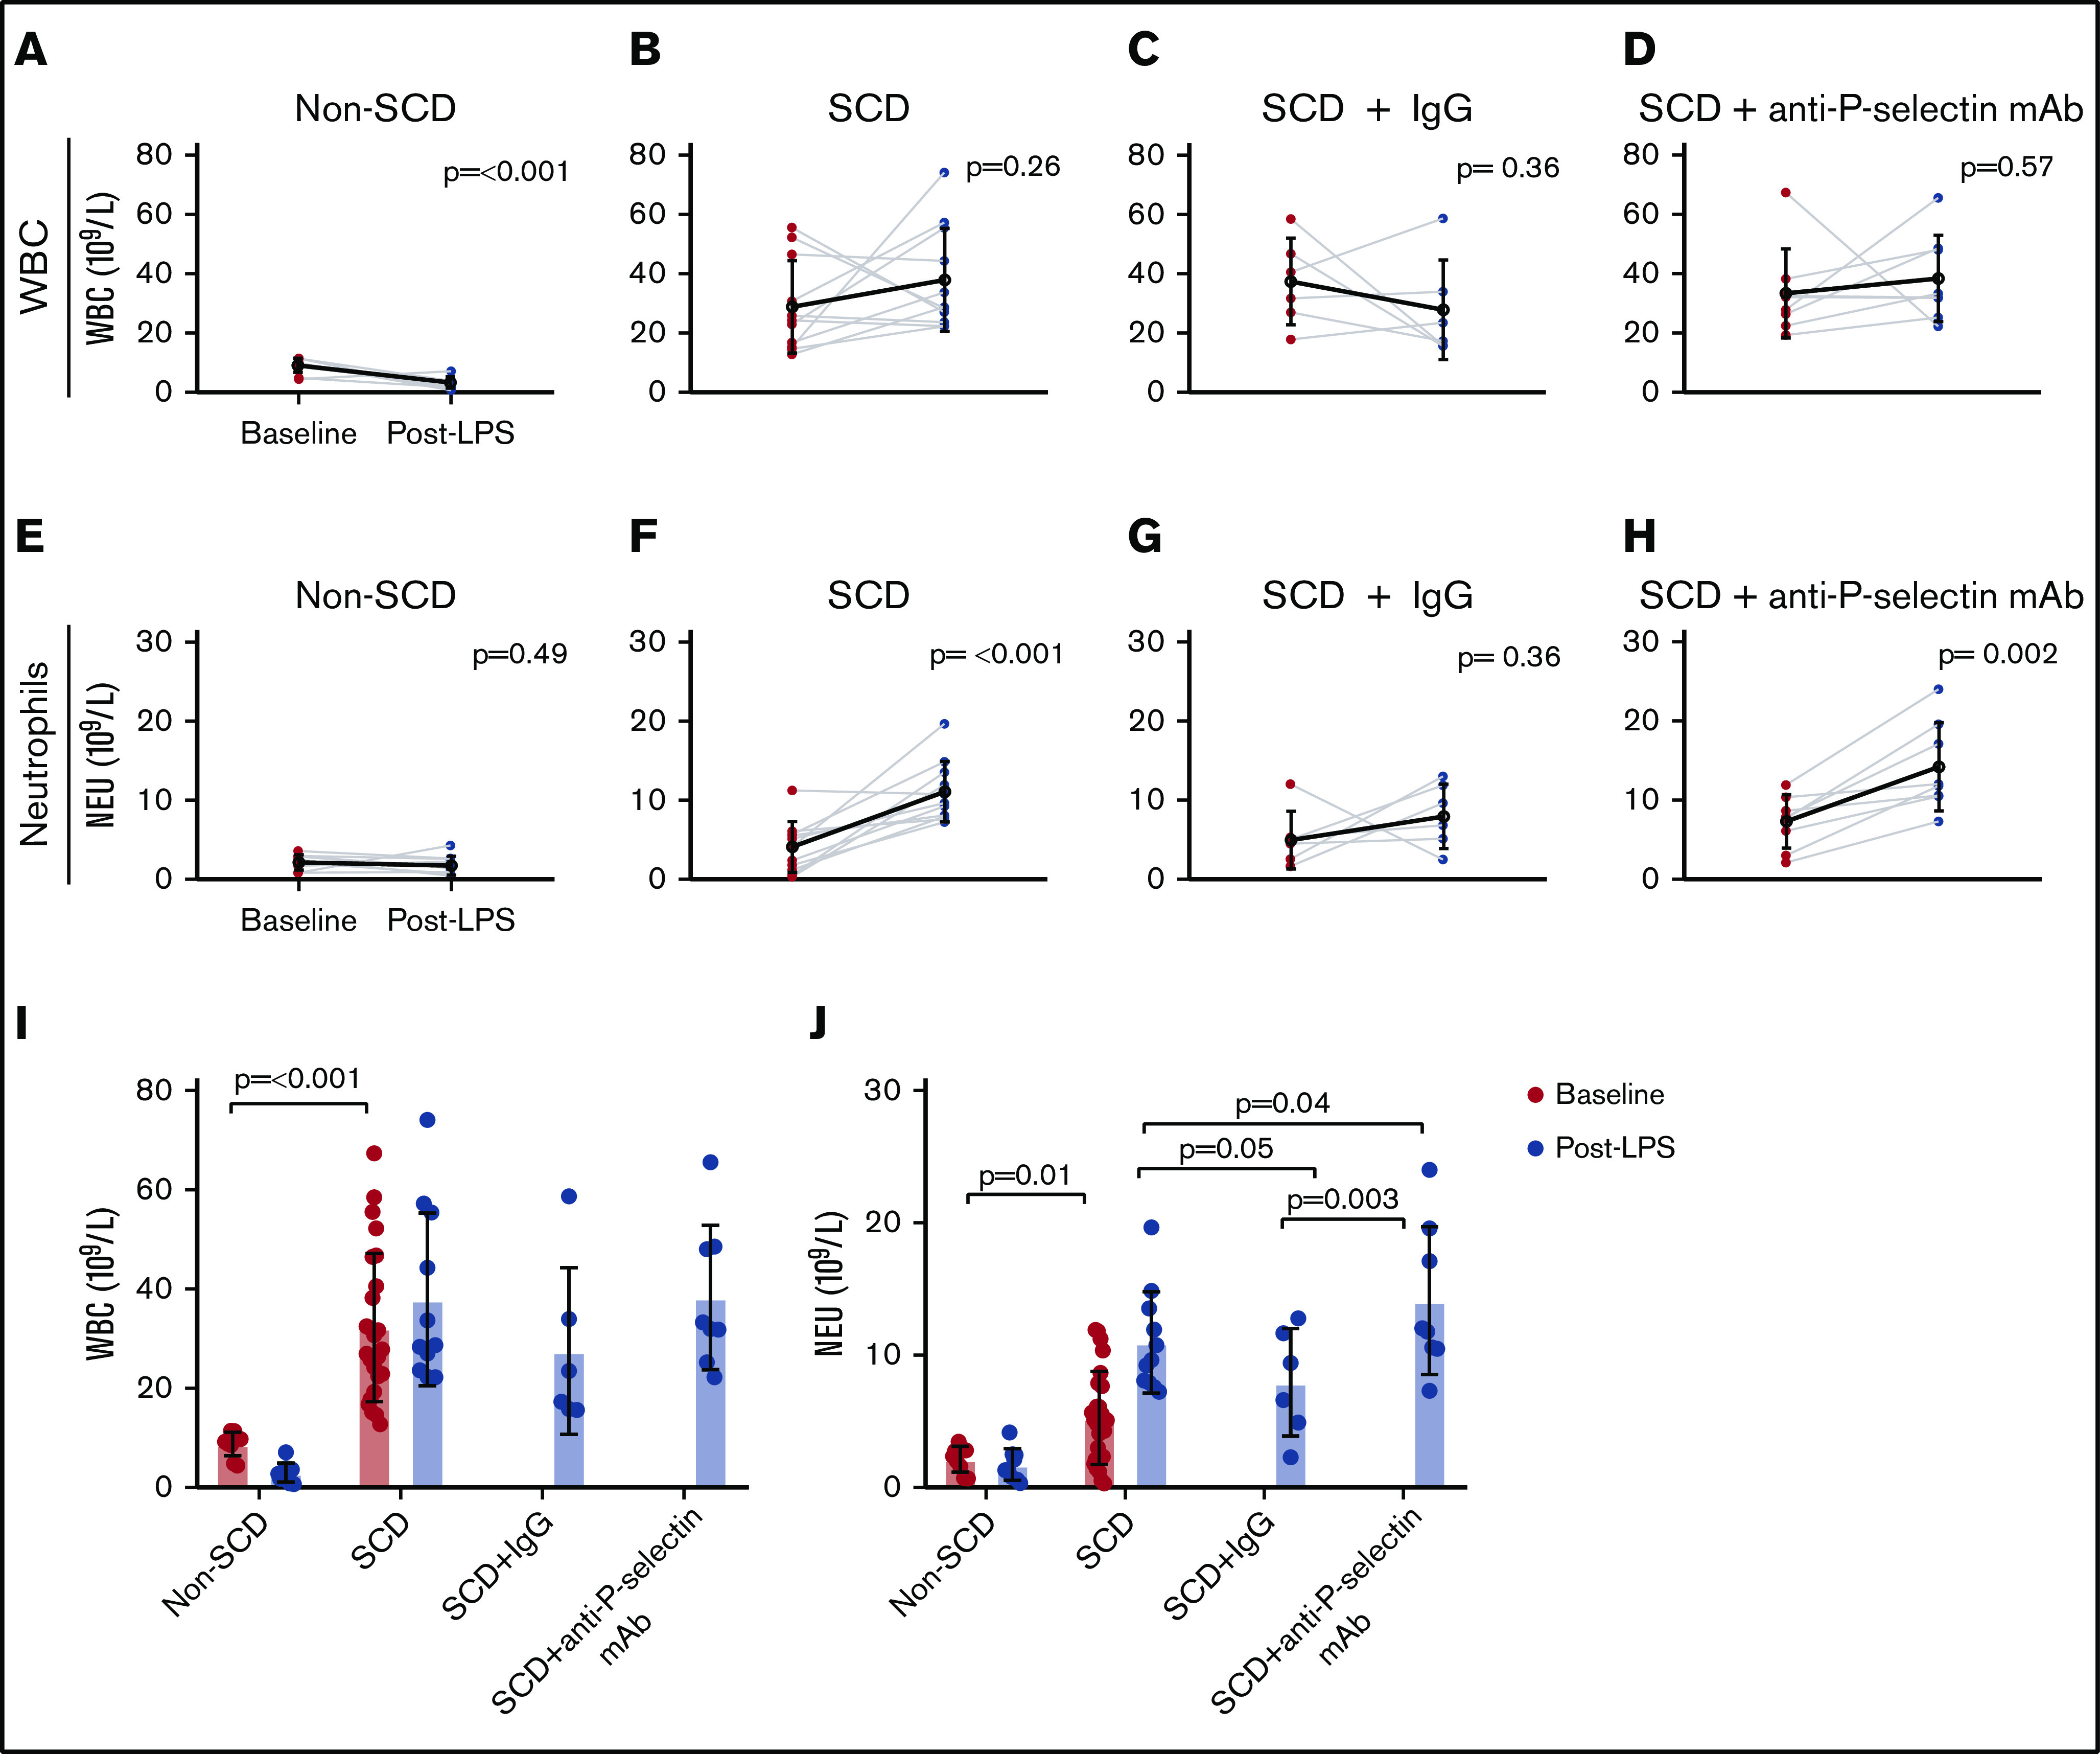
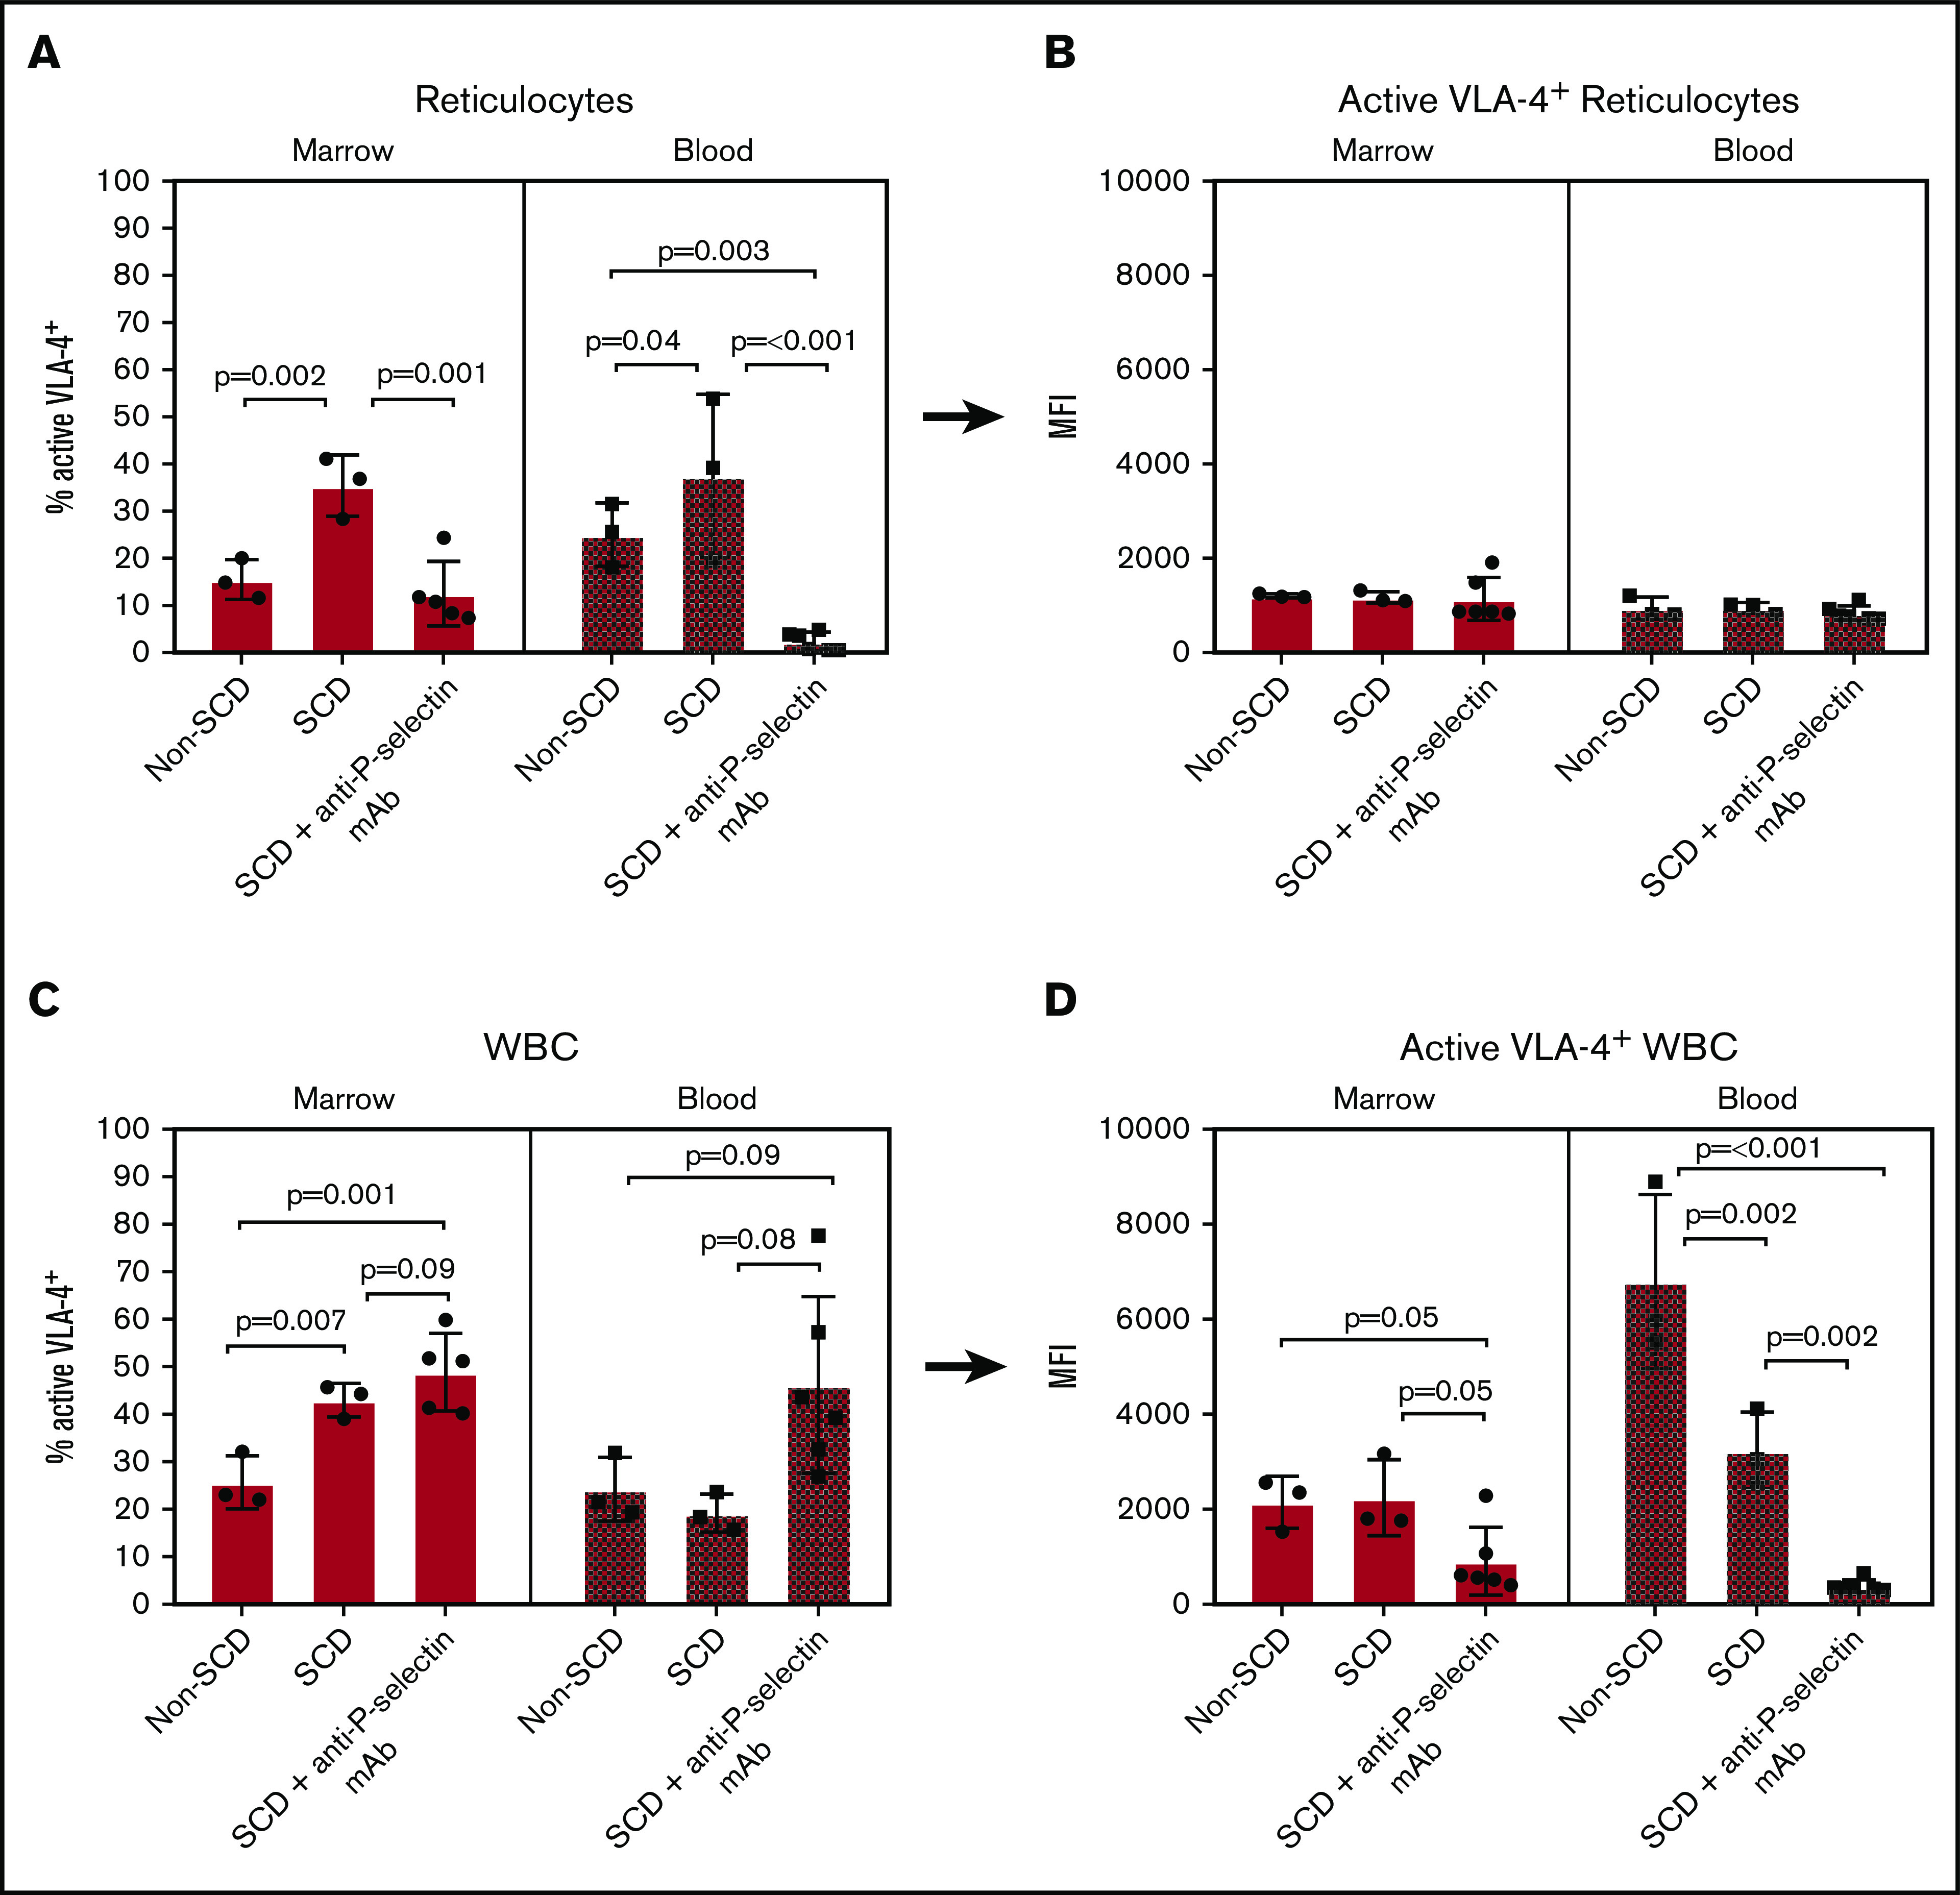
In sickle cell disease (SCD), very late antigen-4 (VLA-4 or integrin α4β1) mediates the adhesion of reticulocytes to inflamed, proinflammatory endothelium, a key process in promoting vaso-occlusive episodes (VOEs). We hypothesized that a radionuclide tracer targeting VLA-4 could be harnessed as a positron emission tomography (PET) imaging biomarker of VOEs. We tested the VLA-4 peptidomimetic PET tracer 64Cu-CB-TE1A1P-PEG4-LLP2A (64Cu-LLP2A) for imaging hyper-adhesion-associated VOEs in the SCD Townes mouse model. With lipopolysaccharide (LPS)-induced VOEs, 64Cu-LLP2A uptake was increased in the bone marrow of the humeri and femurs, common sites of VOEs in SCD mice compared with non-SCD mice. Treatment with a proven inhibitor of VOEs (the anti-mouse anti-P-selectin monoclonal antibody [mAb] RB40.34) during LPS stimulation led to a reduction in the uptake of 64Cu-LLP2A in the humeri and femurs to baseline levels, implying blockade of VOE hyper-adhesion. Flow cytometry with Cy3-LLP2A demonstrated an increased percentage of VLA-4-positive reticulocytes in SCD vs non-SCD mice in the bone and peripheral blood after treatment with LPS, which was abrogated by anti-P-selectin mAb treatment. These data, for the first time, show in vivo imaging of VLA-4-mediated hyper-adhesion, primarily of SCD reticulocytes, during VOEs. PET imaging with 64Cu-LLP2A may serve as a valuable, noninvasive method for identifying sites of vaso-occlusion and may provide an objective biomarker of disease severity and anti-P-selectin treatment efficacy in patients with SCD.
© 2020 by The American Society of Hematology.
Conflict of interest statement
Conflict-of-interest disclosure: The authors declare no competing financial interests.
Figures
Similar articles
-
PET imaging of very late antigen-4 in melanoma: comparison of 68Ga- and 64Cu-labeled NODAGA and CB-TE1A1P-LLP2A conjugates.J Nucl Med. 2014 Nov;55(11):1856-63. doi: 10.2967/jnumed.114.144881. Epub 2014 Sep 25. J Nucl Med. 2014. PMID: 25256059 Free PMC article.
-
Ex Vivo and In Vivo Evaluation of Overexpressed VLA-4 in Multiple Myeloma Using LLP2A Imaging Agents.J Nucl Med. 2016 Apr;57(4):640-5. doi: 10.2967/jnumed.115.164624. Epub 2016 Jan 7. J Nucl Med. 2016. PMID: 26742713 Free PMC article.
-
PET Imaging of VLA-4 in a New BRAFV600E Mouse Model of Melanoma.Mol Imaging Biol. 2022 Jun;24(3):425-433. doi: 10.1007/s11307-021-01666-1. Epub 2021 Oct 25. Mol Imaging Biol. 2022. PMID: 34694528 Free PMC article.
-
The alpha4beta1 integrin in sickle cell disease.Transfus Clin Biol. 2008 Feb-Mar;15(1-2):19-22. doi: 10.1016/j.tracli.2008.03.013. Epub 2008 May 23. Transfus Clin Biol. 2008. PMID: 18501656 Review.
-
Emerging pharmacotherapeutic approaches for the management of sickle cell disease.Expert Opin Pharmacother. 2019 Feb;20(2):173-186. doi: 10.1080/14656566.2018.1548610. Epub 2018 Nov 30. Expert Opin Pharmacother. 2019. PMID: 30499731 Review.
Cited by
-
Reduced Monocyte and Neutrophil Infiltration and Activation by P-Selectin/CD62P Inhibition Enhances Thrombus Resolution in Mice.Arterioscler Thromb Vasc Biol. 2024 Apr;44(4):954-968. doi: 10.1161/ATVBAHA.123.320016. Epub 2024 Feb 22. Arterioscler Thromb Vasc Biol. 2024. PMID: 38385292 Free PMC article.
-
Targeted imaging of very late antigen-4 for noninvasive assessment of lung inflammation-fibrosis axis.EJNMMI Res. 2023 Jun 5;13(1):55. doi: 10.1186/s13550-023-01006-0. EJNMMI Res. 2023. PMID: 37273103 Free PMC article.
-
Flow adhesion of whole blood to P-selectin: a prognostic biomarker for vaso-occlusive crisis in sickle cell disease.Br J Haematol. 2021 Sep;194(6):1074-1082. doi: 10.1111/bjh.17643. Epub 2021 Sep 1. Br J Haematol. 2021. PMID: 34472086 Free PMC article.
-
In vivo quantitative assessment of therapeutic response to bortezomib therapy in disseminated animal models of multiple myeloma with [18F]FDG and [64Cu]Cu-LLP2A PET.EJNMMI Res. 2021 Sep 29;11(1):97. doi: 10.1186/s13550-021-00840-4. EJNMMI Res. 2021. PMID: 34586539 Free PMC article.
-
Conjecturing about Small-Molecule Agonists and Antagonists of α4β1 Integrin: From Mechanistic Insight to Potential Therapeutic Applications.Biomedicines. 2024 Jan 30;12(2):316. doi: 10.3390/biomedicines12020316. Biomedicines. 2024. PMID: 38397918 Free PMC article. Review.
References
-
- Hassell KL. Population estimates of sickle cell disease in the U.S. Am J Prev Med. 2010;38(4suppl):S512-S521. - PubMed
-
- Bender MA. Sickle cell disease. 15 September 2003. (Updated 17 August 2017). In: Adam MP, Ardinger HH, Pagon RA, et al, eds. GeneReviews. Seattle, WA: University of Washington, Seattle; 1993-2020. https://www.ncbi.nlm.nih.gov/books/NBK1377/. Accessed 15 November 2019.
-
- Brousseau DC, Owens PL, Mosso AL, Panepinto JA, Steiner CA. Acute care utilization and rehospitalizations for sickle cell disease. JAMA. 2010;303(13):1288-1294. - PubMed
Publication types
MeSH terms
Substances
Grants and funding
LinkOut - more resources
Full Text Sources
Medical
Molecular Biology Databases
