. 2021 Mar;21(3):1238-1254.
doi: 10.1111/ajt.16283. Epub 2020 Sep 25.

Rejection of intestinal allotransplants is driven by memory T helper type 17 immunity and responds to infliximab

Affiliations

Rejection of intestinal allotransplants is driven by memory T helper type 17 immunity and responds to infliximab

Alexander Kroemer et al. Am J Transplant. 2021 Mar.

Abstract

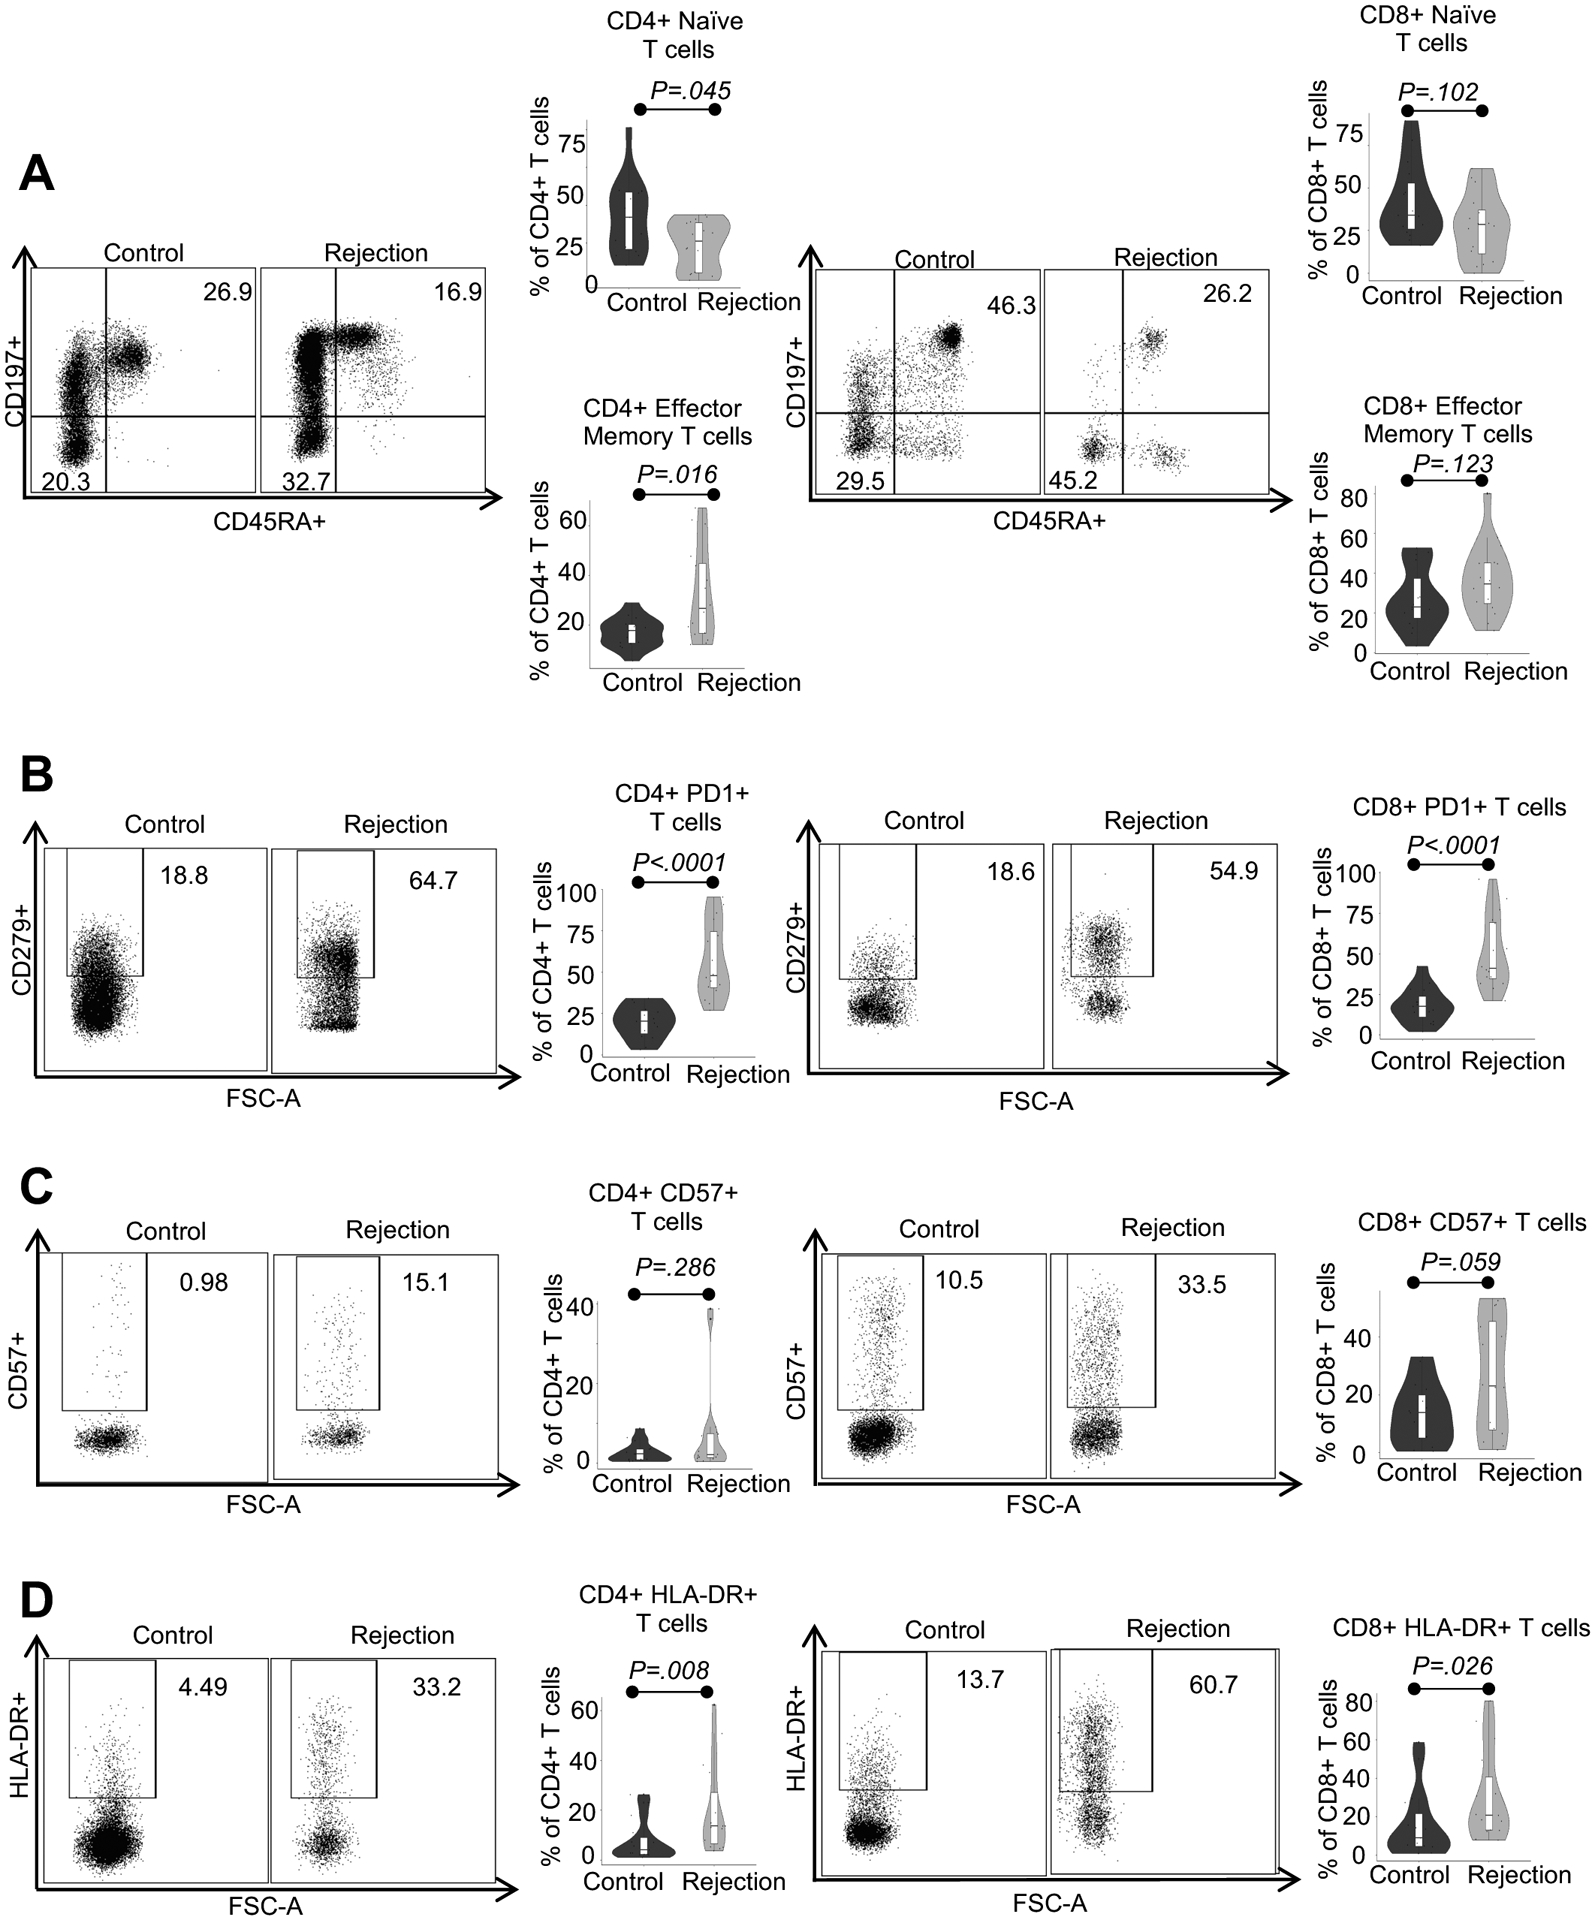
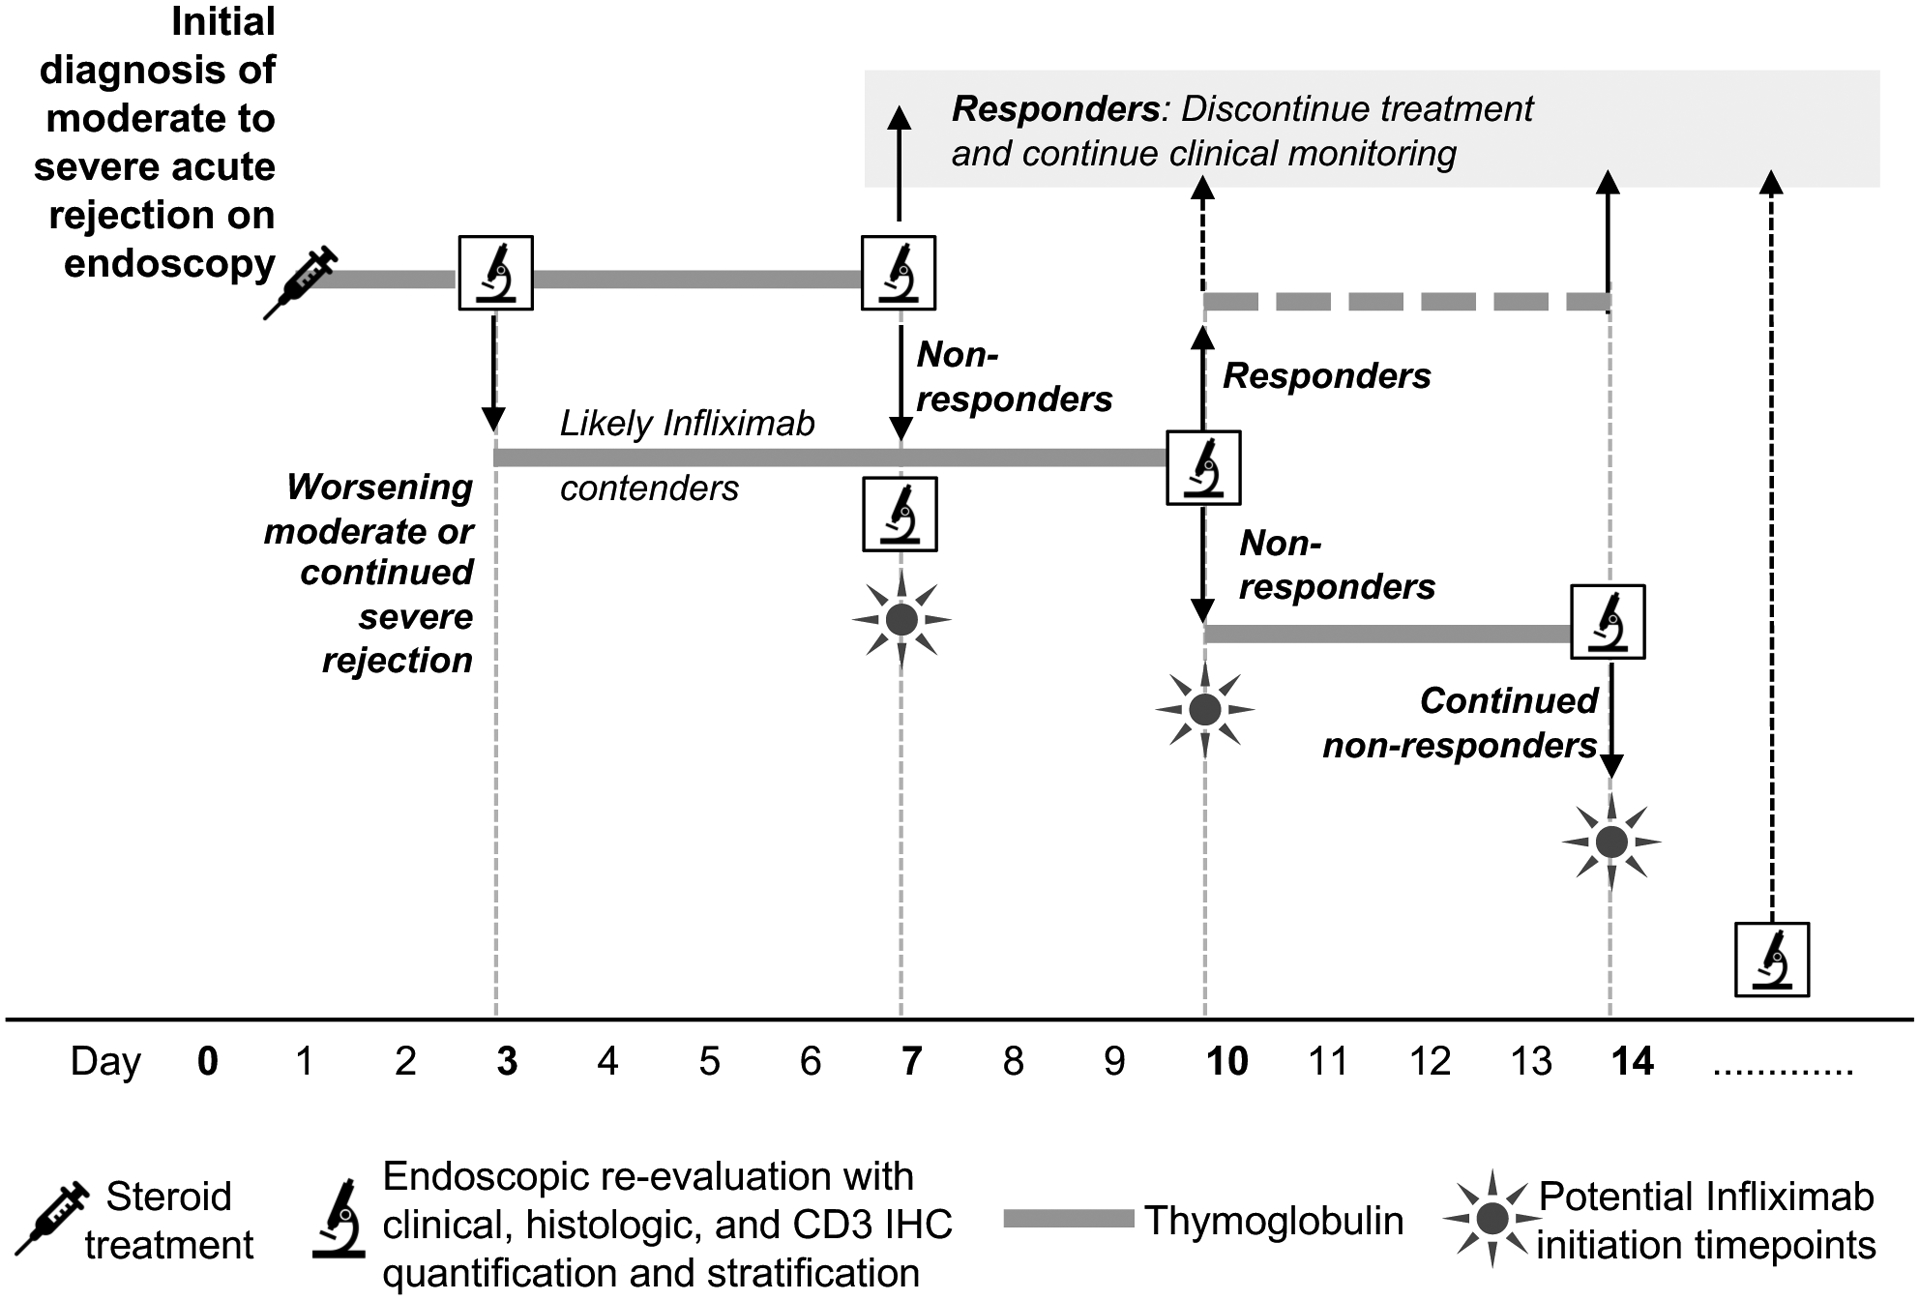
Intestinal transplantation (ITx) can be life-saving for patients with advanced intestinal failure experiencing complications of parenteral nutrition. New surgical techniques and conventional immunosuppression have enabled some success, but outcomes post-ITx remain disappointing. Refractory cellular immune responses, immunosuppression-linked infections, and posttransplant malignancies have precluded widespread ITx application. To shed light on the dynamics of ITx allograft rejection and treatment resistance, peripheral blood samples and intestinal allograft biopsies from 51 ITx patients with severe rejection, alongside 37 stable controls, were analyzed using immunohistochemistry, polychromatic flow cytometry, and reverse transcription-PCR. Our findings inform both immunomonitoring and treatment. In terms of immunomonitoring, we found that while ITx rejection is associated with proinflammatory and activated effector memory T cells in the blood, evidence of treatment efficacy can only be found in the allograft itself, meaning that blood-based monitoring may be insufficient. In terms of treatment, we found that the prominence of intra-graft memory TNF-α and IL-17 double-positive T helper type 17 (Th17) cells is a leading feature of refractory rejection. Anti-TNF-α therapies appear to provide novel and safer treatment strategies for refractory ITx rejection; with responses in 14 of 14 patients. Clinical protocols targeting TNF-α, IL-17, and Th17 warrant further testing.

Keywords: T cell biology; clinical research/practice; immunobiology; immunosuppression/immune modulation; immunosuppressive regimens; intestinal (allograft) function/dysfunction; intestine/multivisceral transplantation; mucosal immunity; rejection; translational research/science.


Figures

Figure 1:
Figure 1:
Characterization of peripheral blood T cells from ITx patients with severe rejection (rejector) at the time of rejection diagnosis versus stable controls (non-rejector) via polychromatic flow cytometry. A, B, C, and D) Representative flow plots of alterations in CD4+ (left column) and CD8+ (right column) T cell subpopulations in peripheral blood of non-rejector control versus rejector patients. Violin plots for naive (CD197+CD45RA+), effector memory (CD197-CD45RA), and PD-1, CD57, and HLA-DR expressing subpopulations of CD4+ and CD8+ T cells. Statistics by Wilcoxon rank sum testing. Sample size for all four panel groups is control n=15, rejection n=16.
Figure 2:
Figure 2:
Uniform depletion of circulating CD3+ T cells from the peripheral blood of ITx patients with severe rejection during treatment with thymoglobulin. A) Representative flow plots and violin plots of peripheral blood CD3+ T cells in non-rejector control, rejector at the time of rejection diagnosis, and thymoglobulin-treated rejector patients. Statistics by Kruskal-Wallis rank testing with individual group comparisons by Wilcoxon rank testing. Sample size is Control n=15, Rejection n=16, Rejection on thymo n=9. B) Violin plot of histologic scoring done by a pathologist for biopsies at the time of rejection and 40–90 days post treatment with thymoglobulin in both responders and non-responders. Scoring system defined as 0=no rejection, 1=borderline rejection, 2=grade 1 rejection, 3=grade 2 rejection, 4=grade 3 rejection as per pathology consensus guidelines (41). Statistics by Wilcoxon rank testing. Sample size for responder graph is n=18 for both time points, for non-responder graph n=26 at both time points. C) Violin plot of lowest measured percent peripheral blood CD3+ T cell frequencies demonstrating near complete depletion in both responder and non-responder rejection patients on thymoglobulin. Statistics by Wilcoxon rank testing. Sample size is responder n=17, non-responder n=24.
Figure 3:
Figure 3:
Acute allograft rejection characterized by CD3+ T cell infiltration and poor clinical outcome and associated with a failure to deplete the allograft during thymoglobulin treatment. A) Representative IHC staining for CD3+ T cells in LP of graft biopsies from non-rejector control and rejector patients at the time of rejection diagnosis. Violin plot of CD3+ T cells counted per 5 high-power fields (20x magnification) demonstrating difference in frequencies in non-rejector control and rejector patients at the time of rejection diagnosis. Statistics performed by Wilcoxon rank test. Sample size is control n=34, rejection n=42. B) Representative IHC for CD3+ T cells in LP of graft biopsies from responders versus non-responders treated with thymoglobulin. Violin plot of CD3+ T cell counts in ITx biopsy samples from non-rejector control as well as responder and non-responder rejection ITx samples before (at the time of rejection diagnosis) and after thymoglobulin treatment, respectively. Statistics performed using Kruskal-Wallis rank test with individual group comparisons with Wilcoxon rank tests. Sample size is control n=34, responders pre and post thymo n=18, non-responders pre and post thymo n=24. C) Violin plot of percent CD3+ T cell depletion levels (left) and total thymoglobulin dose (defined as daily thymoglobulin dose divided by weight multiplied by number of days of treatment mg*days/kg) in responders versus non-responders. Statistics with Wilcoxon rank testing. Sample size for CD3+ T cell depletion levels is responder n=18, non-responder n=24. Thymo dose sample size is n=17 for responders, n=24 for non-responders.
Figure 4:
Figure 4:
Predominance of terminally differentiated effector memory T cells and CCR6+CD4+ T cells in severe refractory rejection despite thymoglobulin treatment. A) Representative flow plots of alterations in CD4+ (upper row) and CD8+ (lower row) T cell subpopulations including effector memory (CD45RO+CD62L-) and terminally differentiated effector memory (CD45RO-CD62L-) cells in intestinal graft biopsies from non-rejector controls versus non-responders with active rejection at the time of rejection diagnosis versus non-responders with active rejection on thymoglobulin; followed by violin plots of individual values of CD4+ (upper row) and CD8+ (lower row) subgroups as previously described. Sample size for both CD4+ and CD8+ effector memory and terminally differentiated effector memory is control n=20, rejection n=9, rejection on thymo n=12. B) Representative flow showing enhanced number of CCR6+CD4+ and CD8+ T cells in intestinal biopsies from non-rejector controls versus non-responders with active rejection at the time of rejection diagnosis versus non-responders with active rejection on thymoglobulin; followed by violin plots of individual values representing comparative analysis of CCR6+CD4+ and CCR6+CD8+ T cell subgroups in non-rejector controls versus non-responders with active rejection at the time of rejection diagnosis versus non-responders with active rejection on thymoglobulin, respectively. Statistics performed using Kruskal-Wallis rank testing with individual group comparisons by Wilcoxon rank testing. Sample size for CCR6+ CD4+ and CD8+ is control n=20, rejection n=9, rejection on thymo n=14.
Figure 5:
Figure 5:
Cytokine production by CCR6+CD4+ Th17 cells highlighting their pro-inflammatory phenotype in severe refractory allograft rejection. Transcriptome activation of cytokine, chemokine, and transcription factor Th17 related genes in rejection patients at the time of rejection diagnosis as defined by RT-PCR. A) LP CD4+ T cells isolated from non-rejector control and non-responder rejection graft biopsy samples during active rejection on treatment, stimulated with PMA/ionomycin and subsequently analyzed for intracellular IL-17, TNF-α, and CCR6 expression. Representative flow plots showing CD4+CD3+ gated populations exhibited intracellular cytokines IL-17 and TNF-α predominantly in the CCR6+ T cell populations; followed by violin plots of individual values representing comparative analysis of cytokine-expressing CCR6+CD4+ T cell subpopulations versus total cytokine-expressing CD4+ T cells in non-rejector control versus non-responder rejection patients. Statistics performed using Wilcoxon rank testing. Sample size for IL-17 producing CCR6+CD4+ group is control n=10, rejection n=11; for IL-17 CD4+ group control n=10, rejection n=11; for TNF-α CCR6+CD4+ control n=7, rejection n=11; TNF-α CD4+ control n=7, rejection n=11. B and C) Gene expression analysis on intestinal graft biopsies from non-rejector controls versus pre-rejection controls versus rejection patients at rejection diagnosis. Heat map visualization of pathway-focused panel for Human Th17 Response depicting normalized fold change 2−ΔΔCt of genes exhibiting significant difference in expression on a magnitude of log2 scale. All cycle threshold values normalized to GAPDH values and log transformed. Sample size for heatmap is control n=13, pre-rejection control n=13, rejection n=13.
Figure 6:
Figure 6:
Significant histologic and endoscopic improvement in severe rejection patients recalcitrant to thymoglobulin when treated with infliximab. A) Representative endoscopic images of clinical non-responders at the time of untreated acute cellular rejection, at the time of initiation of infliximab after failure of thymoglobulin depletion therapy, and 6 weeks after first dose of infliximab. Violin plots of standardized clinical endoscopy scores from 14 non-responder ITx recipients who received infliximab for refractory severe rejection after failing thymoglobulin treatment in comparison to 14 non-responder ITx recipients who only received thymoglobulin; scores incorporate features of ulcer size, total ulcerated surface area, affected surface area, and the presence of strictures impeding endoscope passage. Scoring mechanisms described in reference (13). B) Representative images of intestinal biopsy histologic H&E stains at 10x magnification/zoom 60x performed on non-responders at the same three time points as in Figure 6A. Violin plots comparing histologic scoring of the same patient cohorts and time points described in Figure 6A done by transplant pathologist with scoring system described in Figure 2B. Statistics by Kruskal Wallis rank sum testing with Dunn’s post hoc multiple comparisons and Wilcoxon rank test for both A) and B). Sample size for non-responder ITx recipients treated with infliximab is time of rejection n=14, time of thymo failure n=14, 6 weeks after infliximab n=14. Sample size for non-responder ITx recipients who only received thymoglobulin is time of rejection n=14, 6 weeks after thymoglobulin/relapse n=14.
Figure 7:
Figure 7:
Proposed clinical algorithm for treatment of moderate or severe acute rejection. At the time of initial diagnosis of moderate to severe rejection, we recommend not only clinical and gross histologic examination but also CD3 IHC quantification. Once patients are treated with high-dose steroids and / or three days of thymoglobulin, we recommend a reassessment to determine progress. Those with worsening or continued severe rejection are likely contenders for infliximab. Starting at day 7, if endoscopic and histologic assessment show lack of improvement (i.e. no treatment response) infliximab could be given. A similar reassessment is performed at 10 days with responders either finishing out a 14-day course of thymoglobulin or stopping at day 10, and non-responders continuing to receive thymoglobulin up to 14 days. If infliximab was not initiated at day 7, it could be initiated at day 10 or 14. The non-responder group would undergo continuous monitoring and additional doses of infliximab could be administered as clinically indicated.

Similar articles

Cited by

References

    1. Allan P, Lal S. Intestinal failure: a review. F1000Res 2018;7:85. - PMC - PubMed
    1. Buchman AL, Scolapio J, Fryer J. AGA technical review on short bowel syndrome and intestinal transplantation. Gastroenterology 2003;124(4):1111–1134. - PubMed
    1. Beath S, Pironi L, Gabe S, Horslen S, Sudan D, Mazeriegos G et al. Collaborative strategies to reduce mortality and morbidity in patients with chronic intestinal failure including those who are referred for small bowel transplantation. Transplantation 2008;85(10):1378–1384. - PubMed
    1. Fishbein TM, Matsumoto CS. Intestinal replacement therapy: timing and indications for referral of patients to an intestinal rehabilitation and transplant program. Gastroenterology 2006;130(2 Suppl 1):S147–151. - PubMed
    1. Fishbein TM. Intestinal transplantation. N Engl J Med 2009;361(10):998–1008. - PubMed

Publication types

Substances