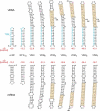
. 2021 Apr;18(4):523-536.
doi: 10.1080/15476286.2020.1818459. Epub 2020 Oct 22.

RNA secondary structure at the transcription start site influences EBOV transcription initiation and replication in a length- and stability-dependent manner

Affiliations

RNA secondary structure at the transcription start site influences EBOV transcription initiation and replication in a length- and stability-dependent manner

Simone Bach et al. RNA Biol. 2021 Apr.

Abstract

Ebola virus (EBOV) RNA has the potential to form hairpin structures at the transcription start sequence (TSS) and reinitiation sites of internal genes, both on the genomic and antigenomic/mRNA level. Hairpin formation involving the TSS and the spacer sequence between promotor elements (PE) 1 and 2 was suggested to regulate viral transcription. Here, we provide evidence that such RNA structures form during RNA synthesis by the viral polymerase and affect its activity. This was analysed using monocistronic minigenomes carrying hairpin structure variants in the TSS-spacer region that differ in length and stability. Transcription and replication were measured via reporter activity and by qRT-PCR quantification of the distinct viral RNA species. We demonstrate that viral RNA synthesis is remarkably tolerant to spacer extensions of up to ~54 nt, but declines beyond this length limit (~25% residual activity for a 66-nt extension). Minor incremental stabilizations of hairpin structures in the TSS-spacer region and on the mRNA/antigenomic level were found to rapidly abolish viral polymerase activity, which may be exploited for antisense strategies to inhibit viral RNA synthesis. Finally, balanced viral transcription and replication can still occur when any RNA structure formation potential at the TSS is eliminated, provided that hexamer phasing in the promoter region is maintained. Altogether, the findings deepen and refine our insight into structure and length constraints within the EBOV transcription and replication promoter and suggest a remarkable flexibility of the viral polymerase in recognition of PE1 and PE2.

Keywords: EBOV 3ʹ-leader promoter; RNA stabilization of hairpin structures at the transcription start site (TSS); Viral transcription and replication; expansion of the spacer between PE1 and PE2.


Conflict of interest statement

No potential conflict of interest was reported by the authors.

Figures
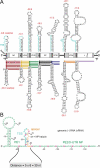
Figure 1.
Figure 1.
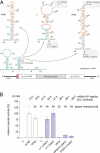
Secondary structure formation potential at (A) transcription start sites (TSS) of EBOV genes at the genomic (top) and antigenomic (bottom) RNA level and (B) sequence and features of the EBOV 3ʹ-leader promoter. (A) Genomic sequence elements required for transcription (re)initiation are shown in cyan at the top; transcription is initiated opposite to the 3ʹ-terminal C residue in the transcription start signal (TSS). Schematic white boxes in the centre mark the open reading frames for proteins NP, VP35, VP40, GP, VP30, VP24 and L; light grey boxes indicate 5ʹ- and 3ʹ-UTRs, with dark grey areas depicting the position of the predicted secondary structures on the genomic (top) or antigenomic/mRNA level (bottom); p, leader and trailer promoters [42]; mRNAs of the 7 EBOV genes are shown as horizontal coloured lines with terminal dots indicating their 5ʹ-caps. Secondary structures are the minimum free energy (MFE) structures (predicted by RNAfold using the default parameters; http://rna.tbi.univie.ac.at/cgi-bin/RNAWebSuite/RNAfold.cgi). ΔG values, depicted in red above (genomic RNA) or below (mRNA) the structures, were calculated with one extra single-stranded residue included on the 5ʹ-side (genomic RNA) and on the 3ʹ-side (genomic RNA and mRNA) of the stem base. (B) Validated secondary structures forming in naked leader RNA [12,24,25]. Proposed promoter elements 1 and 2 (PE1, PE2) are shown in green letters and the 3ʹ-U residues of UN5 hexamers in PE1 and PE2 are highlighted in pink in the genomic RNA; orange nucleotides mark the spacer region between the TSS (in cyan) and PE2; G-75 is shown in blue to indicate interruption of UN5 hexamer phasing. The distance from nt −51 to −80 (5 x 6 = 30 nt) was recently defined as measure for hexamer phasing between PE1 and PE2 [27]. Nucleotide numbering of the genomic RNA starts at the 3ʹ-terminal nt (position −1) that is complementary to position 1 (5ʹ-terminus) of the antigenome. The 3ʹ-terminal G of the genome is shown as small letter to consider the recent finding that this nucleotide is not essential for initiation, as the EBOV RNA polymerase initiates RNA synthesis at the C residue preceding the 3ʹ-terminal G residue [43]
Figure 2.
Figure 2.
(A) Illustration of EBOV 3ʹ-leader minigenome constructs (replication-competent) in which the wt NP HP (turquoise-shaded area) consisting of the TSS and the orange spacer sequence was replaced with HP structures derived from the transcription reinitiation sites of the VP40, L and VP24 genes; in the case of the latter two, 1 nt (L) or 2 nt (VP24) were additionally inserted at the indicated locations to restore hexamer phasing between nt −51 and −80 [27]. For further details, see Fig. 1B. (B) Relative reporter activity of replication-competent minigenome (RC MG) constructs specified in panel A. The predicted overall stability of the HP on the mRNA level (MFE structure, RNAfold; for calculation of ΔG values, see legend to Fig. 1A) and the extension of the spacer region relative to the parental wt NP variant is given above the bars. Activity values (± standard error of the mean, SEM) were normalized to the wt NP construct and are based on at least 3 biological replicates with 2 or 3 technical replicates each. – L, background control (transfection without the plasmid encoding the polymerase L); white columns: native 5ʹ-UTR sequences; blue columns: 5ʹ-UTR sequences engineered to obey hexamer phasing
Figure 3.
Figure 3.
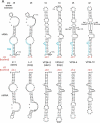
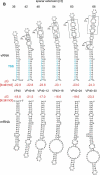
(A, B) Predicted MFE structures (RNAfold) on the genomic (vRNA, top) and mRNA (bottom) level of (A) engineered L, VP24 and (B) VP40 constructs; ΔG values are indicated in red. The individual spacer extensions (in nt) are given at the top; del., nt deletions; ins., nt insertions. For calculation of ΔG values, see legend to Fig. 1A. (C) Reporter gene activities measured for the replication-competent minigenome (RC MG) constructs specified in panels A and B. Values were normalized to the native (wt NP) 3ʹ-leader as control (100%). – L, background control (specified in the legend to Fig. 2B). Mean values (± SEM) are on average derived from three independent experiments with three technical replicates each. White columns: reference constructs; cyan column: the original VP24 HP construct; blue columns: engineered VP24 HP constructs; pink columns: the parental and engineered VP40 HP constructs. (D-E) Corresponding levels of viral mRNA, cRNA and vRNA measured by a 2-step strand-specific qRT-PCR using total RNA from cells transfected with RC MG constructs as analysed in panel C. For details, see Materials and Methods. Colour code as in panel C and the column for the original VP24 HP shown in light blue
Figure 3.
Figure 3.
(Continued)
Figure 3.
Figure 3.
(Continued)
Figure 4.
Figure 4.
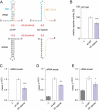
Analysis of a 3ʹ-leader construct with a 12-nt deletion in the spacer region (Δ5ʹ-spacer). (A) Predicted MFE structure of the wt NP transcription start region and the corresponding region of the Δ5ʹ-spacer variant carrying a deletion of 12 spacer nucleotides. The latter variant is predicted to be devoid of any secondary structure on the vRNA and mRNA level. For the nucleotide colour code on the vRNA level, see legend to Fig. 1B. (B) Luciferase reporter activities measured for the Δ5ʹ-spacer construct, the wt NP construct and the wt NP construct in the absence of polymerase L (background control, see legend to Fig. 2B). RC MG, replication-competent minigenome. Mean values (± SEM), normalized to the native wt NP leader construct, are based on 3 biological replicates with 3 or 4 technical replicates each; ****P < 0.00001; (unpaired t test, two-tailed). (C-E) Corresponding levels of viral mRNA, cRNA and vRNA measured by qRT-PCR using total RNA derived from the same cells as in panel B and normalized to the wt NP construct (see Materials and Methods). Mean 2−ΔΔCT values (± SEM) were derived from at least three independent experiments with 3 or 4 technical replicates each; *P < 0.05; *** P < 0.0001; **** P < 0.00001; (unpaired t test, two-tailed; a corresponding Mann Whitney test was used in case of data not normally distributed)
Figure 5.
Figure 5.
Predicted MFE structures (RNAfold) of minigenome constructs encoding the wt NP HP, its stabilized derivative NP G−72, the native VP40 HP and its incrementally stabilized derivatives VP406 to 1; ΔG values (in red), indicated for the vRNA strand (top) and the encoded mRNA (bottom), were calculated as described in the legend to Fig. 1A. Sequence changes relative to the parental VP40 HP are indicated as follows: del., single nt deletions; pink residues, point mutations; green residues, single nt insertions
Figure 6.
Figure 6.
Impact of NP HP stabilization and progressive rigidification of the VP40 HP on minigenomic viral transcription and replication. (A) Luciferase activities of replication-competent minigenomes (RC MG) carrying the NP and VP40 variants illustrated in Fig. 5. Activity values are given in % relative to the native 3ʹ-leader [wt NP = 100%]. Mean values (± SEM) are based on 3 biological replicates with at least 3 technical replicates each; *P < 0.05; *** P < 0.0001; **** P < 0.00001 (unpaired t test, two-tailed). (B-D) Corresponding levels of viral mRNA, cRNA and vRNA measured by qRT-PCR of RC MG samples using the same cells as in panel A. Mean values (± SEM) were derived from 3 independent experiments with at least 3 technical replicates each. *P < 0.05; ** P < 0.001; **** P < 0.00001; (unpaired t test, two-tailed, a corresponding Mann Whitney test was used in case of data not normally distributed)

Similar articles

Cited by

References

    1. Bukreyev AA, Chandran K, Dolnik O, et al. Discussions and decisions of the 2012–2014 international committee on taxonomy of viruses (ICTV) filoviridae study group, January 2012–June 2013. Arch Virol. 2014;159:821–830. - PMC - PubMed
    1. Burk R, Bollinger L, Johnson JC, et al. Neglected filoviruses. FEMS Microbiol Rev. 2016;40:494–519. - PMC - PubMed
    1. Malvy D, McElroy AK, de Clerck H, et al. Ebola virus disease. Lancet. 2019;393:936–948. - PubMed
    1. Mehedi M, Falzarano D, Seebach J, et al. A new Ebola virus nonstructural glycoprotein expressed through RNA editing. J Virol. 2011;85:5406–5414. - PMC - PubMed
    1. Mühlberger E, Weik M, Volchkov VE, et al., Comparison of the transcription and replication strategies of marburg virus and Ebola virus by using artificial replication systems. J Virol 1999;73:2333–2342. - PMC - PubMed

Publication types