. 2020 Oct 6;32(4):654-664.e5.
doi: 10.1016/j.cmet.2020.08.001. Epub 2020 Sep 2.

A Membrane-Bound Diacylglycerol Species Induces PKCϵ-Mediated Hepatic Insulin Resistance

Affiliations

A Membrane-Bound Diacylglycerol Species Induces PKCϵ-Mediated Hepatic Insulin Resistance

Kun Lyu et al. Cell Metab. .

Abstract

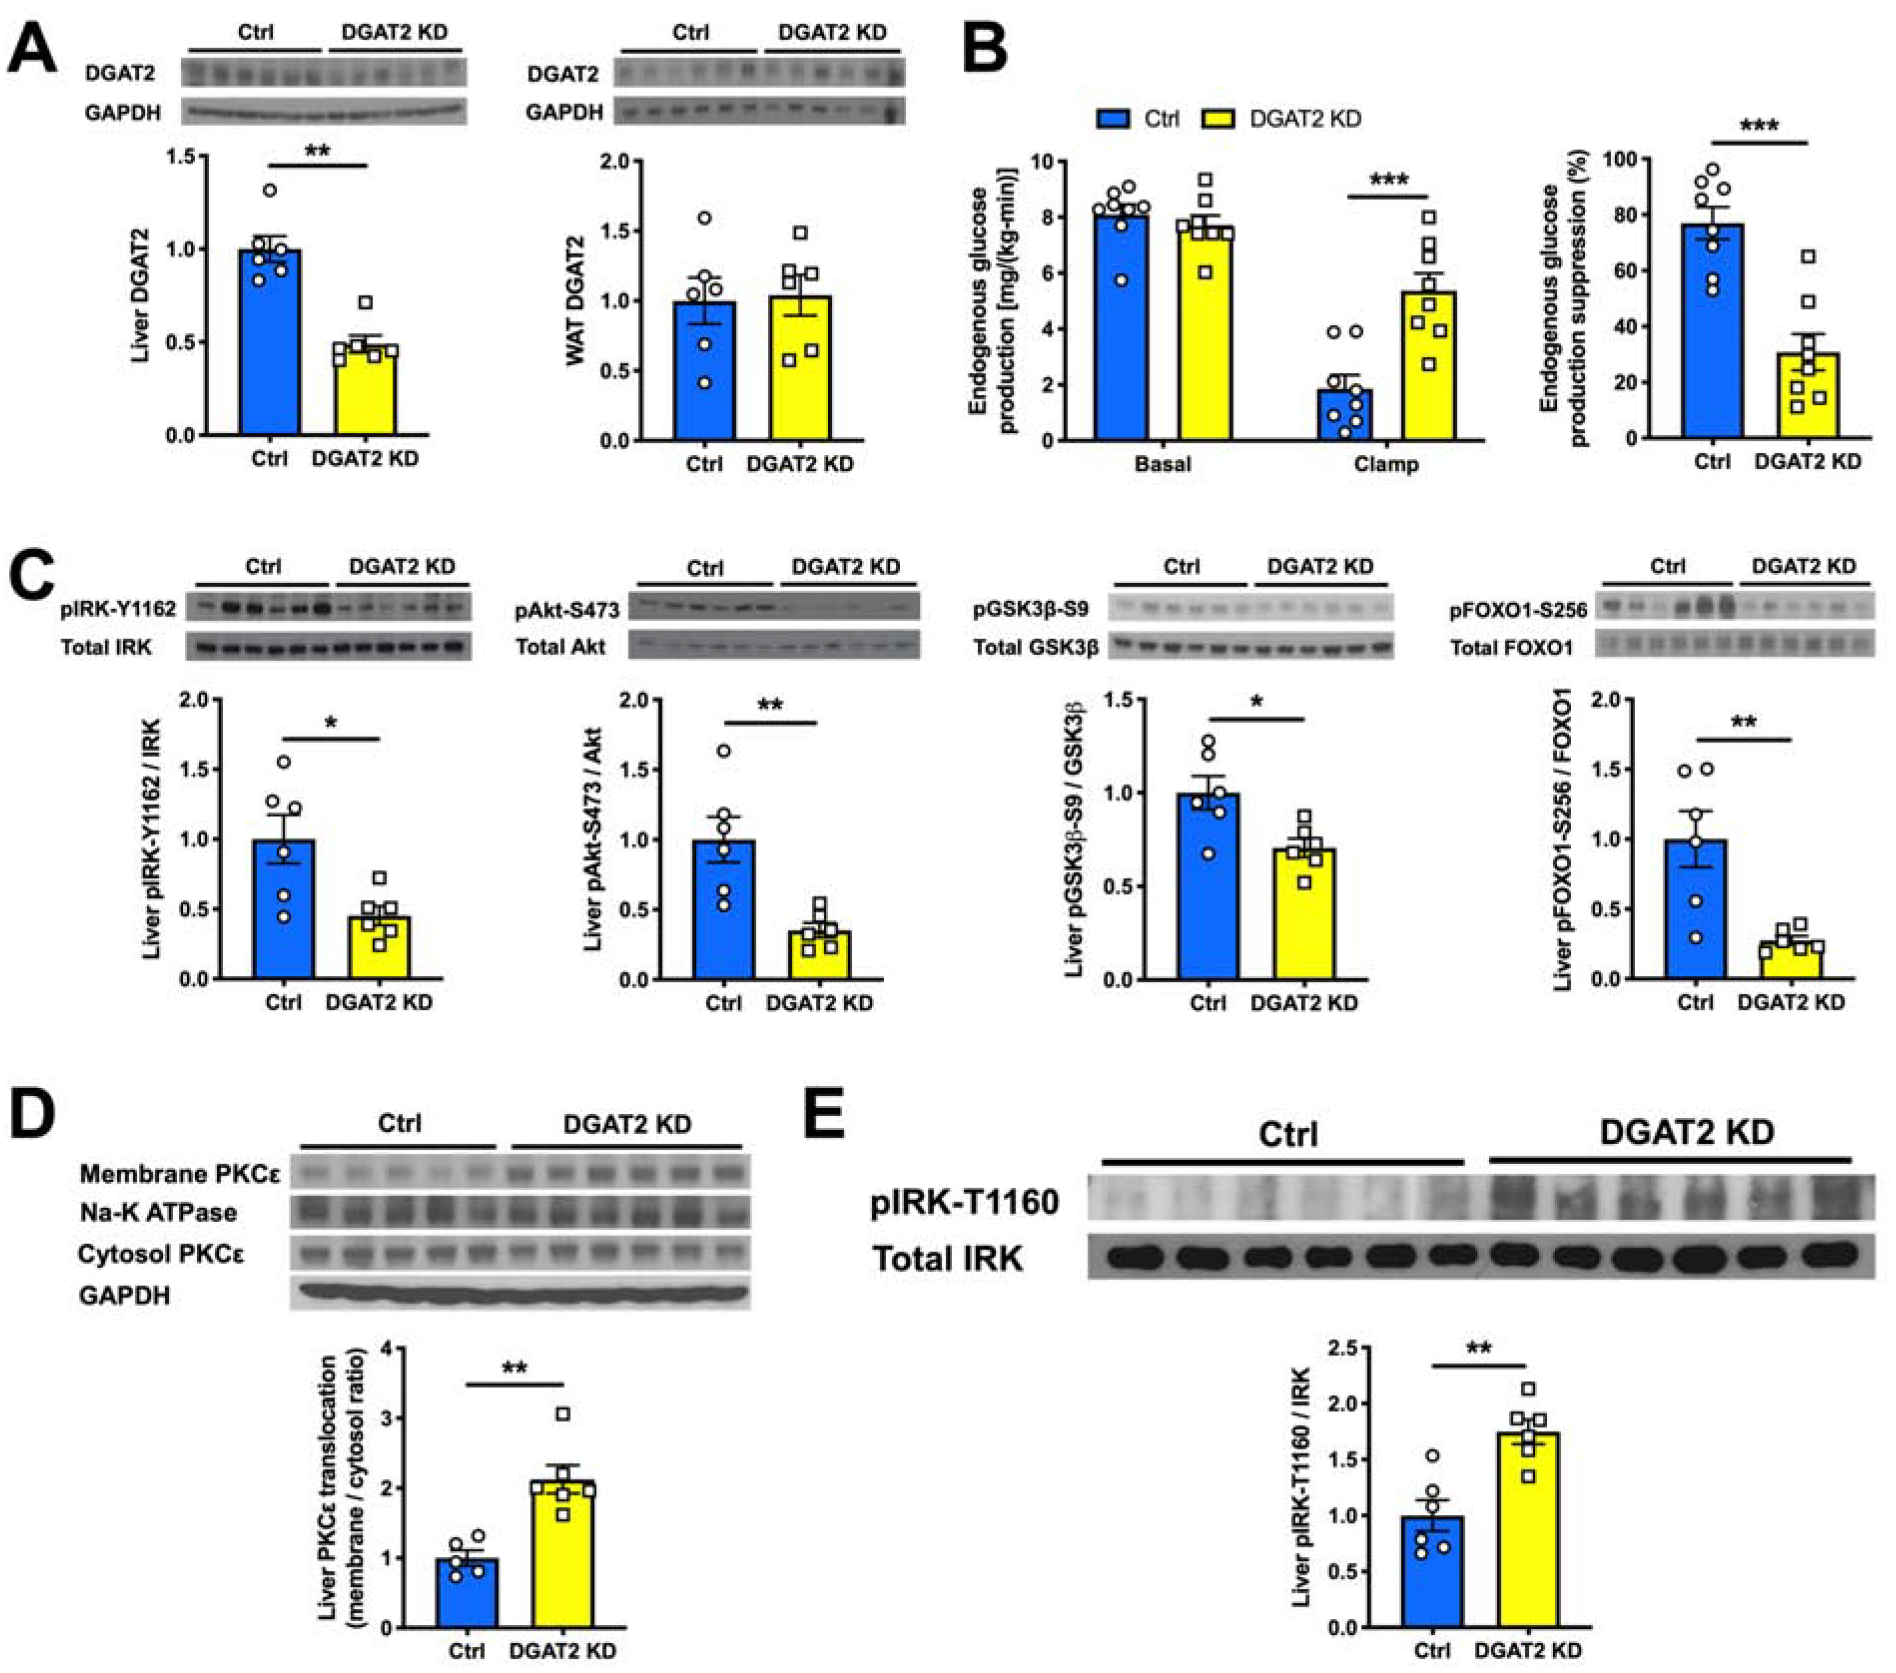
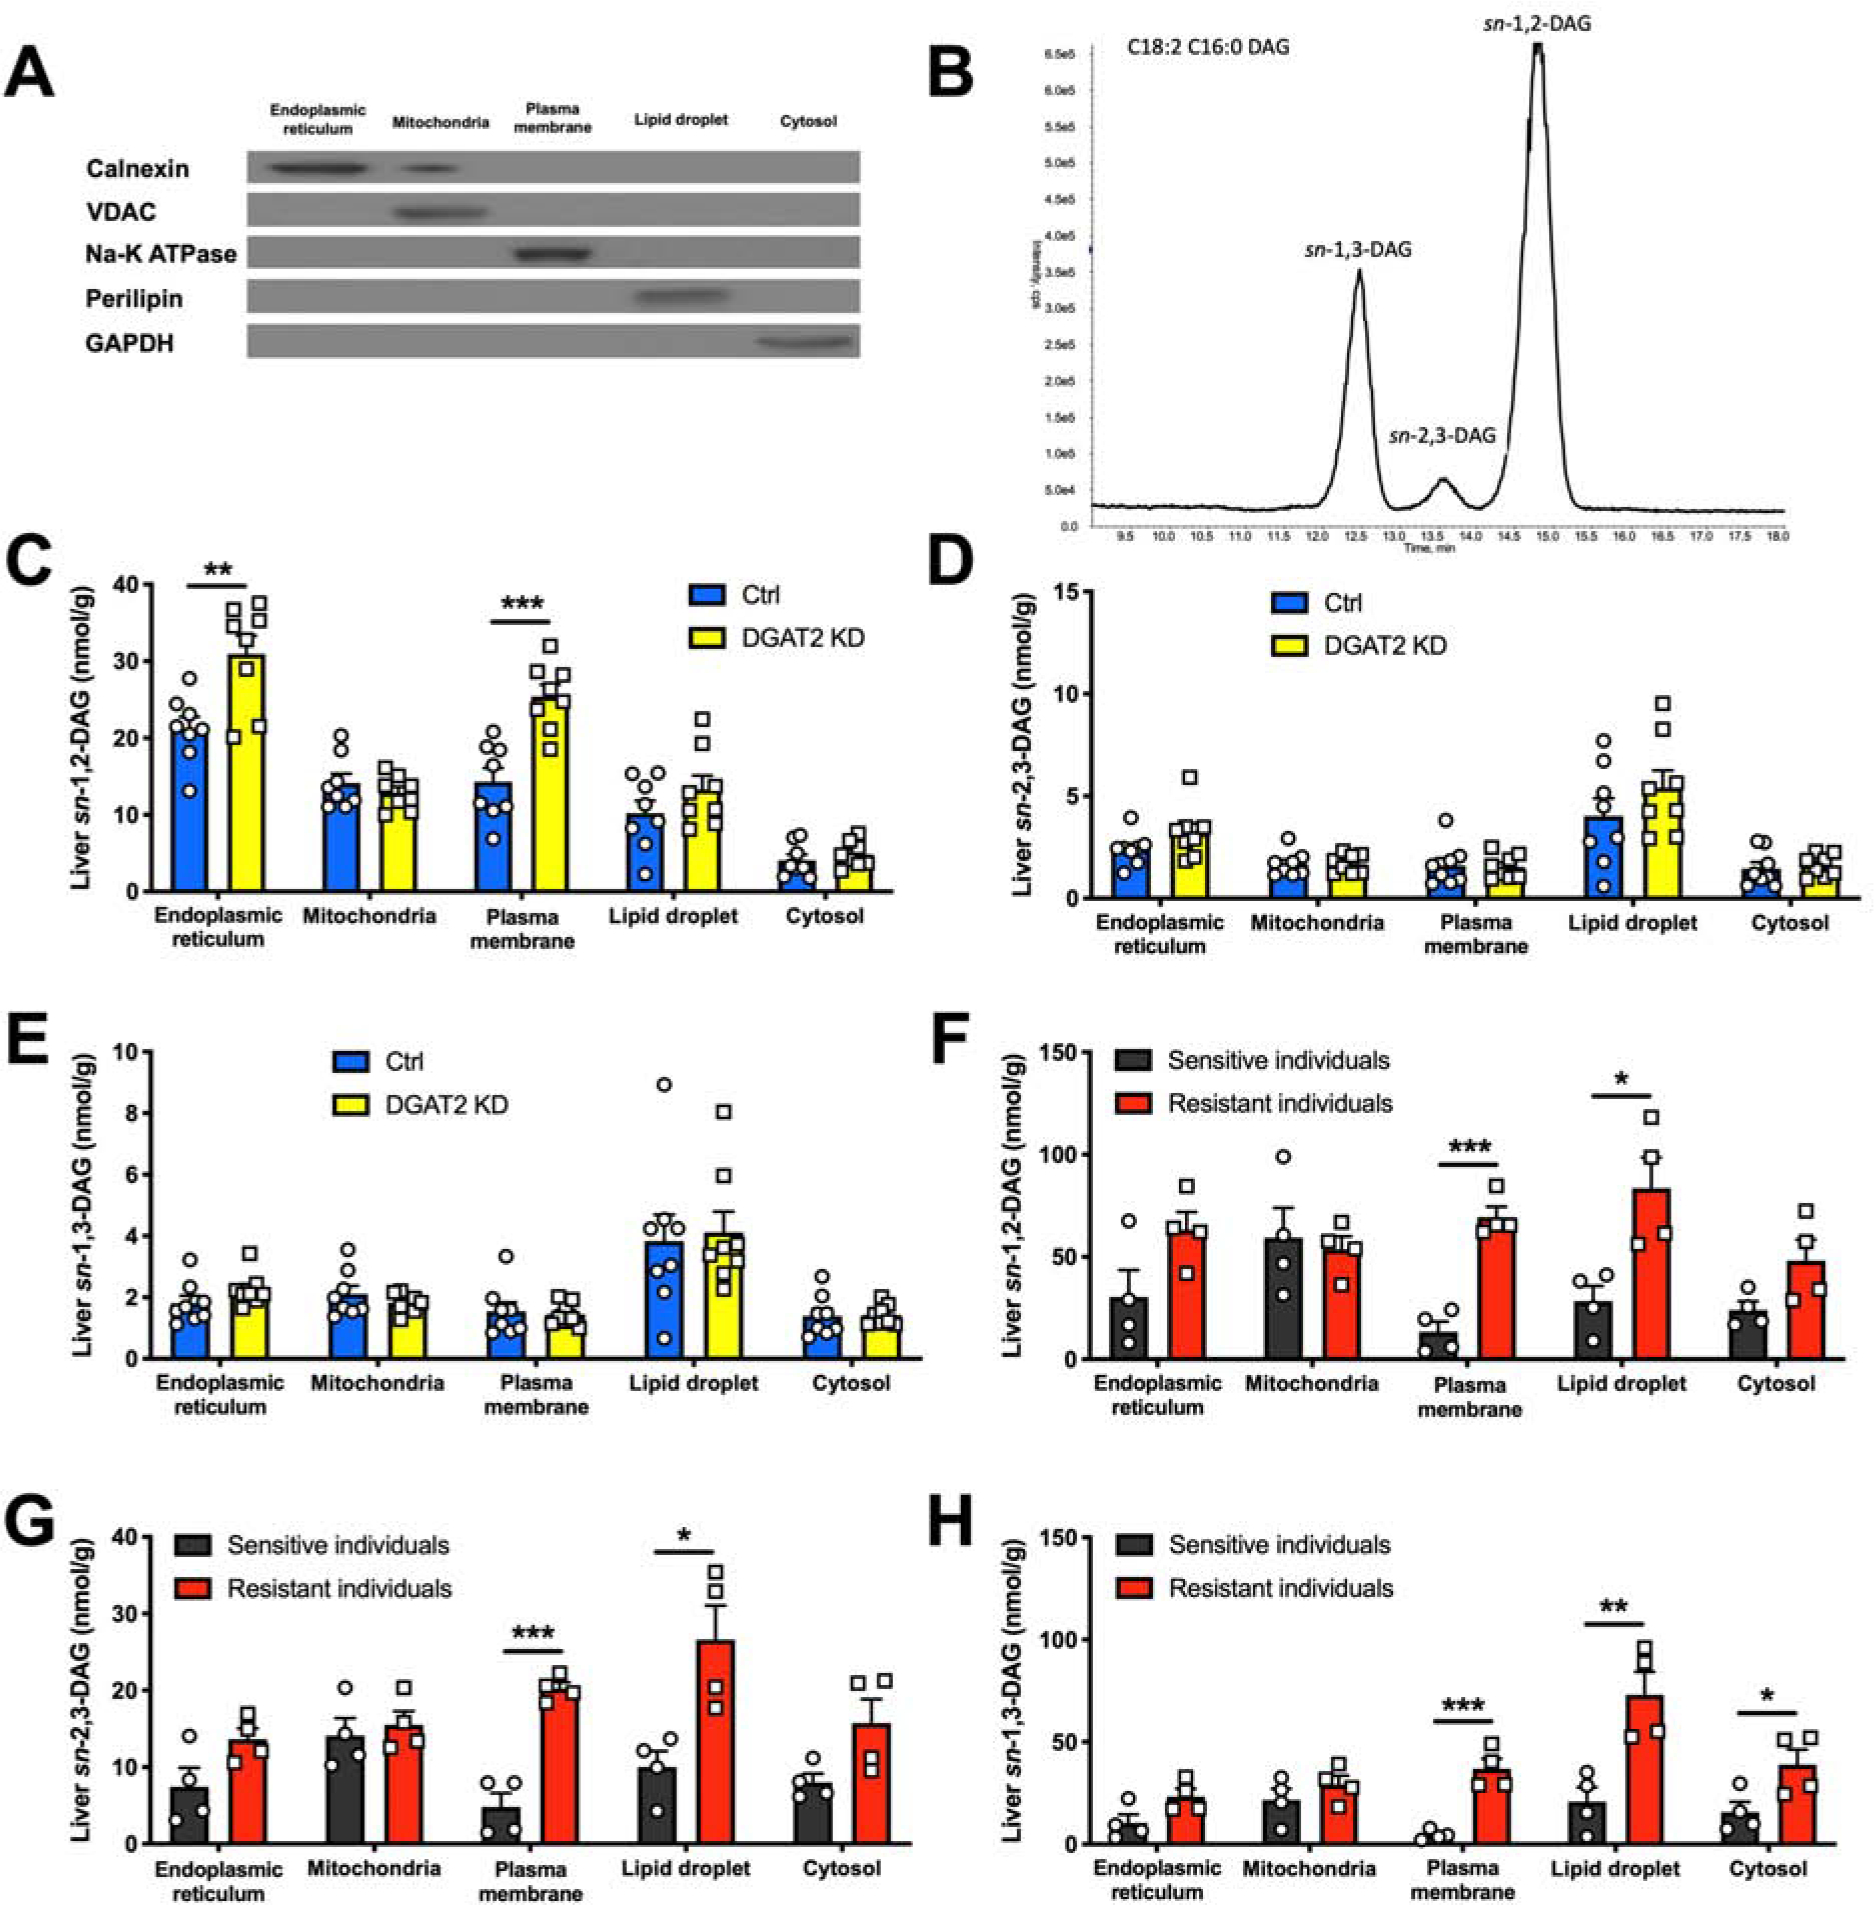
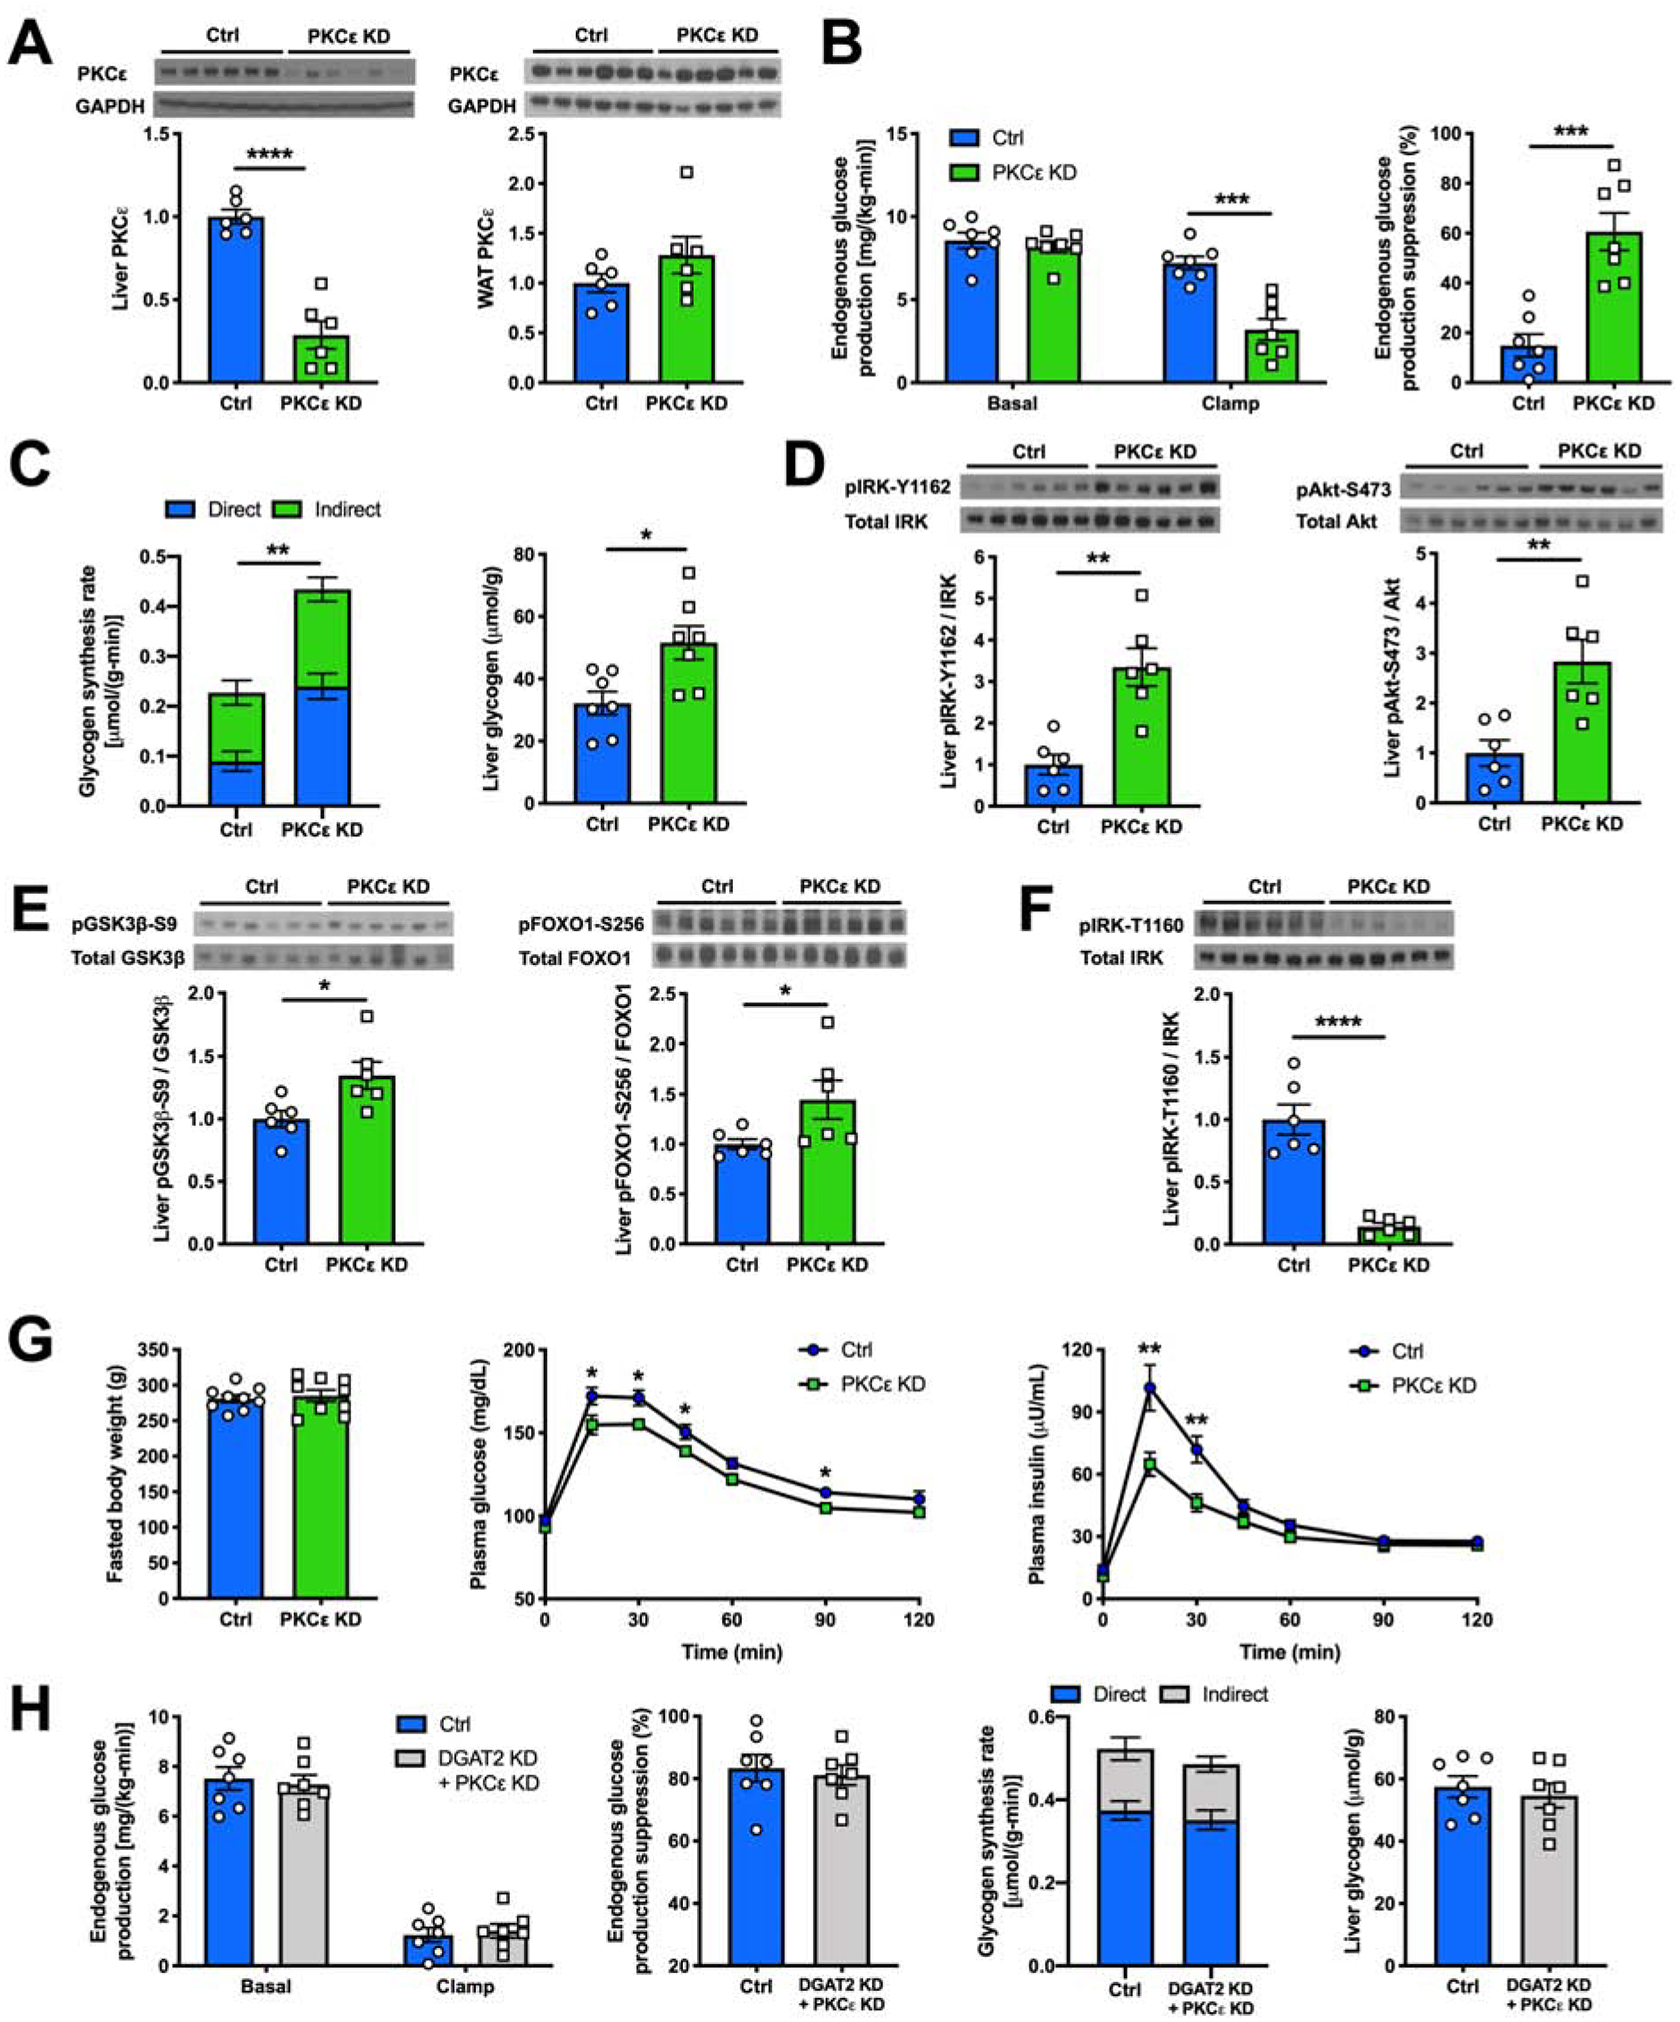
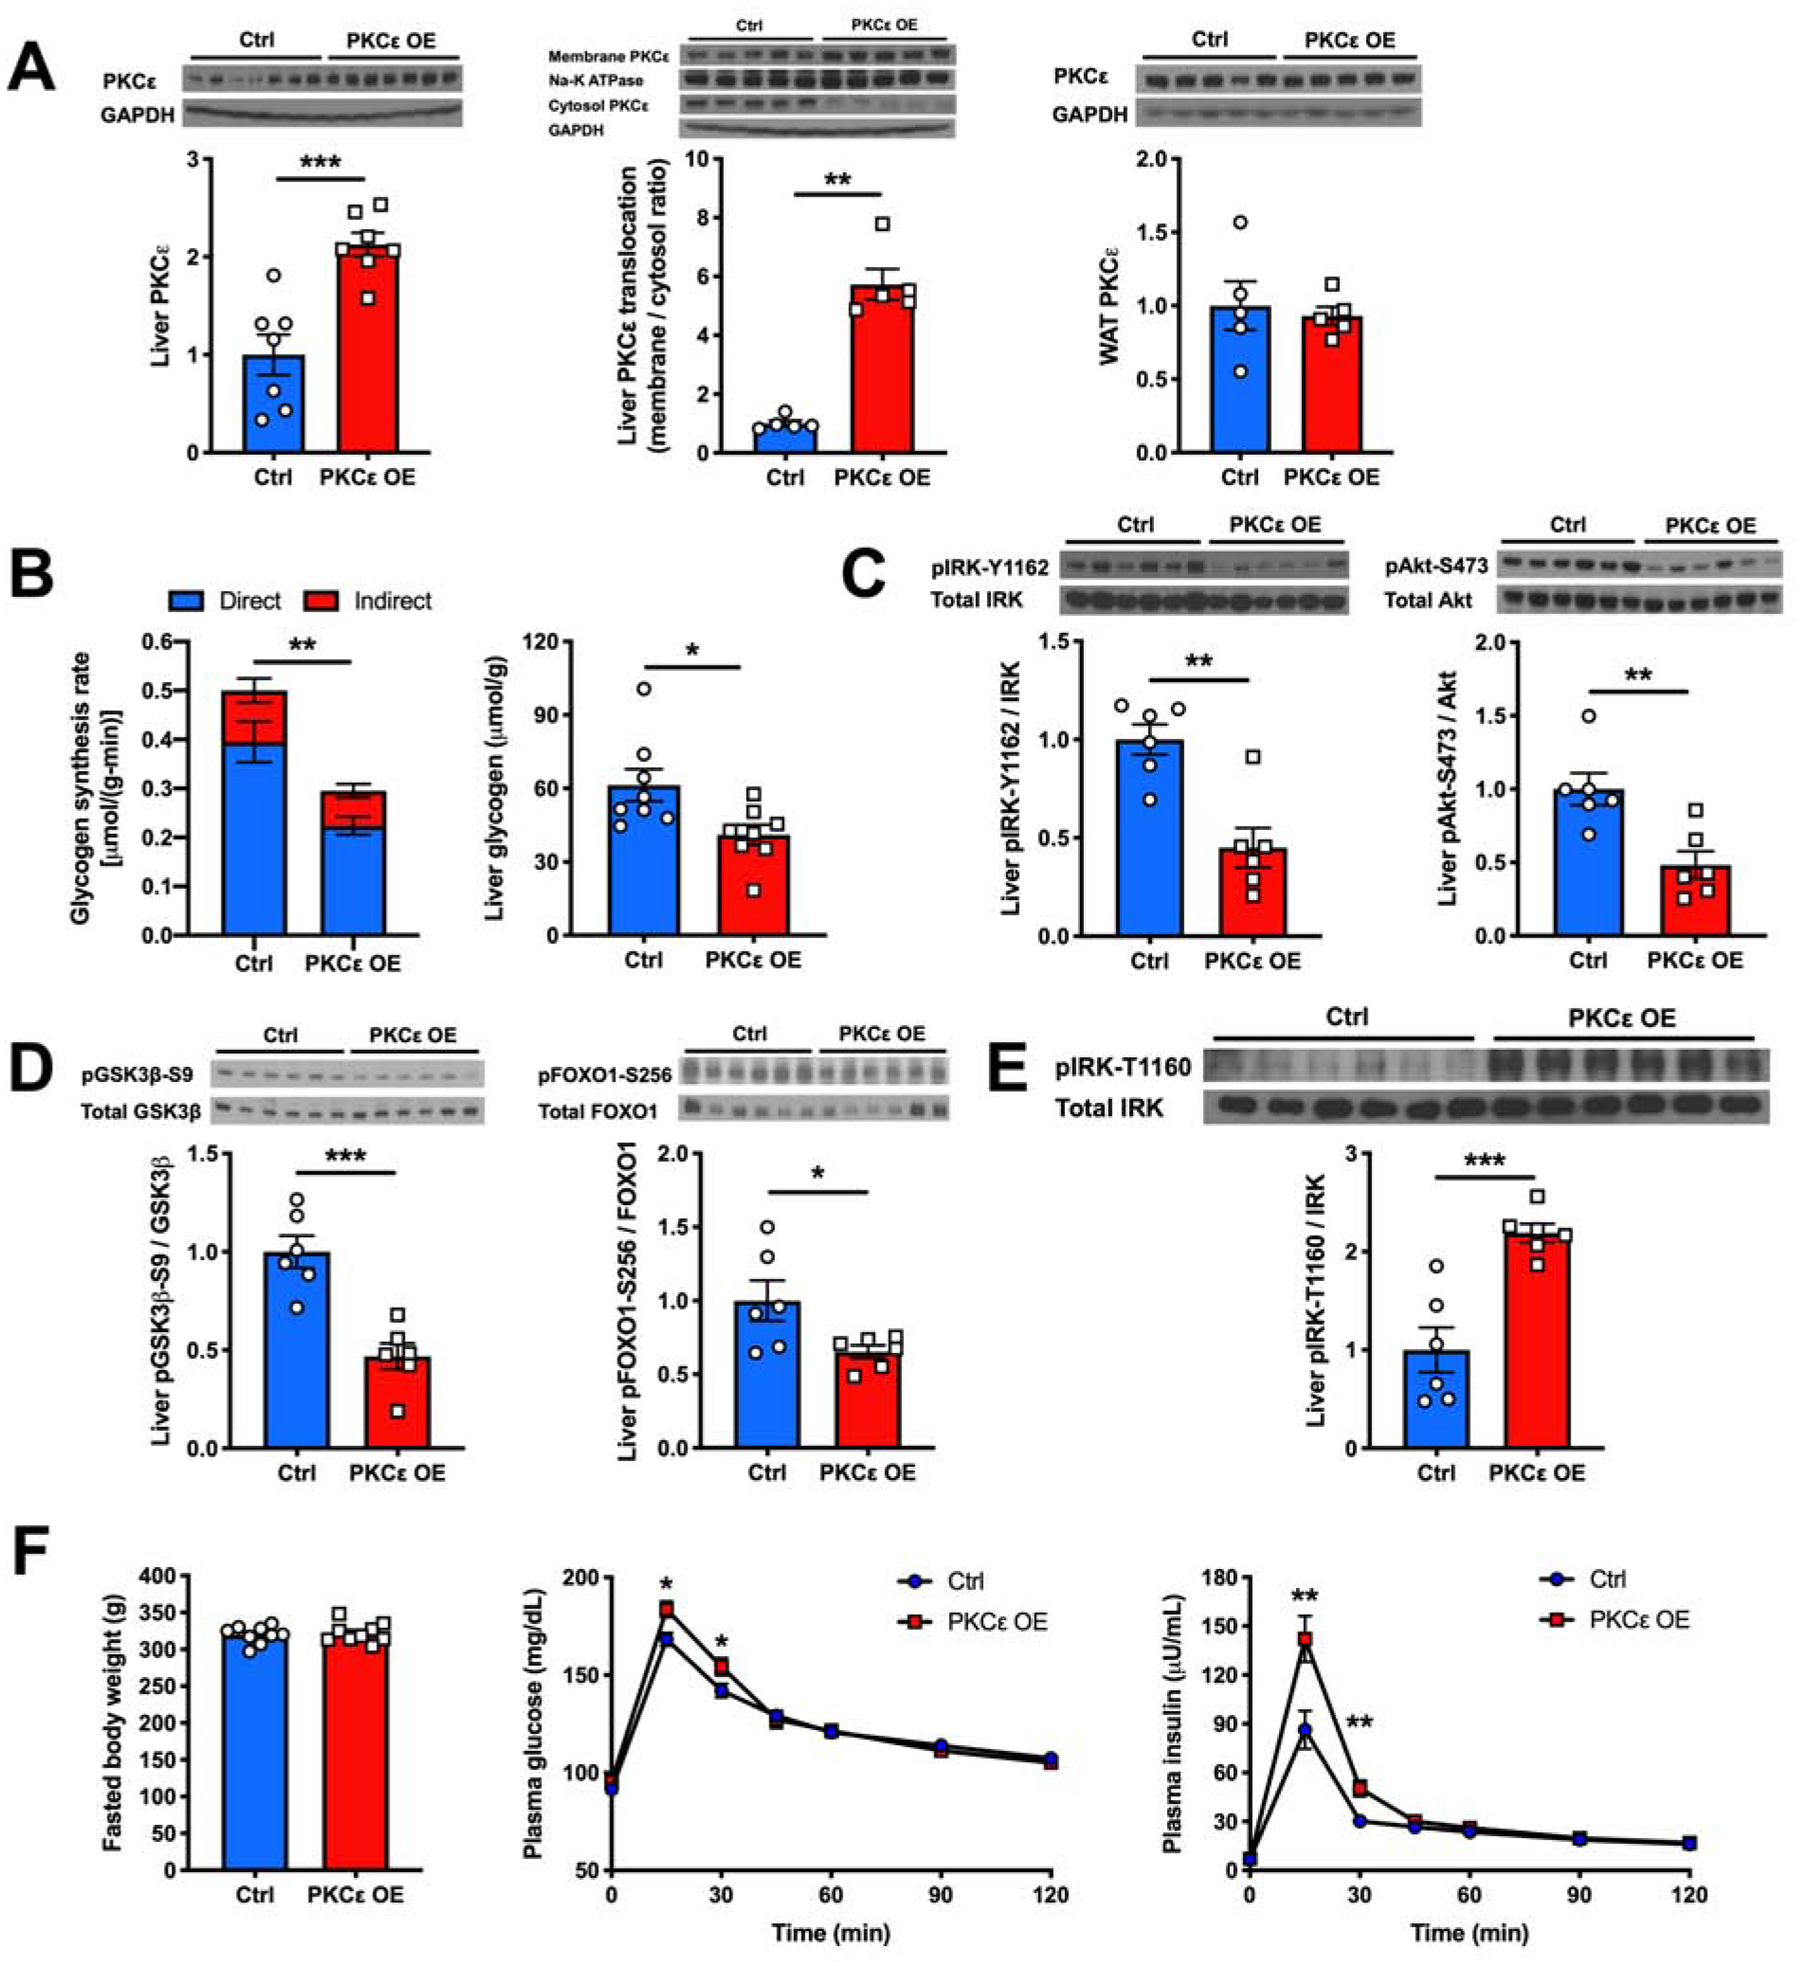
Nonalcoholic fatty liver disease is strongly associated with hepatic insulin resistance (HIR); however, the key lipid species and molecular mechanisms linking these conditions are widely debated. We developed a subcellular fractionation method to quantify diacylglycerol (DAG) stereoisomers and ceramides in the endoplasmic reticulum (ER), mitochondria, plasma membrane (PM), lipid droplets, and cytosol. Acute knockdown (KD) of diacylglycerol acyltransferase-2 in liver induced HIR in rats. This was due to PM sn-1,2-DAG accumulation, which promoted PKCϵ activation and insulin receptor kinase (IRK)-T1160 phosphorylation, resulting in decreased IRK-Y1162 phosphorylation. Liver PM sn-1,2-DAG content and IRK-T1160 phosphorylation were also higher in humans with HIR. In rats, liver-specific PKCϵ KD ameliorated high-fat diet-induced HIR by lowering IRK-T1160 phosphorylation, while liver-specific overexpression of constitutively active PKCϵ-induced HIR by promoting IRK-T1160 phosphorylation. These data identify PM sn-1,2-DAGs as the key pool of lipids that activate PKCϵ and that hepatic PKCϵ is both necessary and sufficient in mediating HIR.

Keywords: ceramides; dicylglycerols; hepatic glucose production; hepatic glycogen synthesis; hepatic insulin resistance; insulin receptor phosphorylation; liquid chromatography-tandem mass spectrometry; nonalcoholic fatty liver disease; protein kinase C-epsilon; type 2 diabetes.


Conflict of interest statement

Declaration of Interests The authors declare no competing interests.

Figures

Figure 1.
Figure 1.. Acute Hepatic DGAT2 KD Induces HIR
(A) Hepatic and WAT DGAT2 protein content measured by western blot (top) and its quantification (bottom). (B) EGP and its suppression by insulin during a hyperinsulinemic-euglycemic clamp in Ctrl vs acute hepatic DGAT2 KD rats. (C) Levels of insulin-stimulated liver pIRK-Y1162, pAkt-S473, pGSK3β-S9 and pFOXO1-S256 as measured by western blot (top) and with its quantification (bottom). (D) Liver PKCε translocation from cytosol to membrane as measured by western blot (top) and with its quantification (bottom). (E) Levels of liver pIRK-T1160 in Ctrl vs acute hepatic DGAT2 KD rats as measured by western blot (top) and with its quantification (bottom). In all panels, data are the mean±S.E.M. In (A) and (C), n = 6 per group. In (B), n = 8 per group. In (D), n = 5 or 6 per group. In (E), n = 5 per group. *P < 0.05, **P < 0.01 and ***P < 0.001.
Figure 2.
Figure 2.. Liver PM sn-1,2-DAG Content Tracks with HIR in Rats and Humans
(A) Separation of five subcellular compartments in liver measured by western blot. (B) Representative chromatogram (n = 13) of DAG stereoisomer separation on LC/MS-MS. (C), (D) and (E) Liver DAG stereoisomer content in five subcellular compartments in Ctrl vs DGAT2 KD rats. (F), (G) and (H) Liver DAG stereoisomer content in five subcellular compartments in human individuals who were insulin-sensitive (black) or insulin-resistant (red). In all panels, data are the mean±S.E.M. In (C), (D) and (E), n = 8 per group. In (F), (G) and (H), n = 4 per group. *P < 0.05, **P < 0.01 and ***P < 0.001.
Figure 3.
Figure 3.. Liver-Specific PKCε KD Ameliorates HFD- and Acute DGAT2 KD-Induced HIR
(A) Hepatic and WAT PKCε protein content measured by western blot (top) and its quantification (bottom). (B) EGP and its suppression by insulin during a hyperinsulinemic-hyperglycemic clamp in Ctrl vs hepatic PKCε KD rats. (C) Hepatic glycogen synthesis rate during a hyperinsulinemic-hyperglycemic clamp and post-clamp hepatic glycogen content. (D) and (E) Levels of insulin-stimulated liver pIRK-Y1162, pAkt-S473, pGSK3β-S9 and pFOXO1-S256 as measured by western blot (top) and with its quantification (bottom). (F) Levels of liver pIRK-T1160 as measured by western blot (top) and with its quantification (bottom). (G) Fasted body weight, plasma glucose and insulin levels during an oGTT in Ctrl vs hepatic PKCε KD rats. (H) EGP, EGP’s suppression by insulin and hepatic glycogen synthesis rate during a hyperinsulinemic-hyperglycemic clamp and post-clamp hepatic glycogen content in Ctrl vs hepatic PKCε KD rats. In all panels, data are the mean±S.E.M. In (A), (D), (E) and (F), n = 6 per group. In (B), (C) and (H), n = 7 per group. In (G), n = 9 per group. *P < 0.05, **P < 0.01, ***P < 0.001 and ****P < 0.0001.
Figure 4.
Figure 4.. Liver-Specific OE of Constitutively Active PKCε Induces HIR
(A) Hepatic PKCε protein content, hepatic PKCε translocation from cytosol to membrane and WAT PKCε content measured by western blot (top) and its quantification (bottom). (B) Hepatic glycogen synthesis rate during a hyperinsulinemic-hyperglycemic clamp and post-clamp liver glycogen content in Ctrl vs hepatic PKCε OE rats. (C) and (D) Levels of insulin-stimulated liver pIRK-Y1162, pAkt-S473, pGSK3β-S9 and pFOXO1-S256 as measured by western blot (top) and with its quantification (bottom). (E) Levels of liver pIRK-T1160 as measured by western blot (top) and with its quantification (bottom). (F) Fasted body weight, plasma glucose and insulin levels during an oGTT in Ctrl vs hepatic PKCε OE rats. In all panels, data are the mean±S.E.M. In (A), n = 5 or 7 per group. In (B), n = 8 per group. In (C), (D) and (E), n = 6 per group. In (F), n = 9 per group. *P < 0.05, **P < 0.01 and ***P < 0.001.

References

    1. Abulizi A, Perry RJ, Camporez JPG, Jurczak MJ, Petersen KF, Aspichueta P, and Shulman GI (2017). A controlled-release mitochondrial protonophore reverses hypertriglyceridemia, nonalcoholic steatohepatitis, and diabetes in lipodystrophic mice. FASEB J 31, 2916–2924. - PMC - PubMed
    1. Bogan JS, McKee AE, and Lodish HF (2001). Insulin-responsive compartments containing GLUT4 in 3T3-L1 and CHO cells: regulation by amino acid concentrations. Mol Cell Biol 21, 4785–4806. - PMC - PubMed
    1. Boni LT, and Rando RR (1985). The nature of protein kinase C activation by physically defined phospholipid vesicles and diacylglycerols. J Biol Chem 260, 10819–10825. - PubMed
    1. Brandon AE, Liao BM, Diakanastasis B, Parker BL, Raddatz K, McManus SA, O’Reilly L, Kimber E, van der Kraan AG, Hancock D, et al. (2019). Protein Kinase C Epsilon Deletion in Adipose Tissue, but Not in Liver, Improves Glucose Tolerance. Cell Metab 29, 183–191 e187. - PubMed
    1. Brown JM, Betters JL, Lord C, Ma Y, Han X, Yang K, Alger HM, Melchior J, Sawyer J, Shah R, et al. (2010). CGI-58 knockdown in mice causes hepatic steatosis but prevents diet-induced obesity and glucose intolerance. J Lipid Res 51, 3306–3315. - PMC - PubMed

Publication types