. 2021 Jan;99(1):148-160.
doi: 10.1016/j.kint.2020.07.047. Epub 2020 Aug 31.

Impaired angiotensin II type 1 receptor signaling contributes to sepsis-induced acute kidney injury

Affiliations

Impaired angiotensin II type 1 receptor signaling contributes to sepsis-induced acute kidney injury

Daniel E Leisman et al. Kidney Int. 2021 Jan.

Abstract

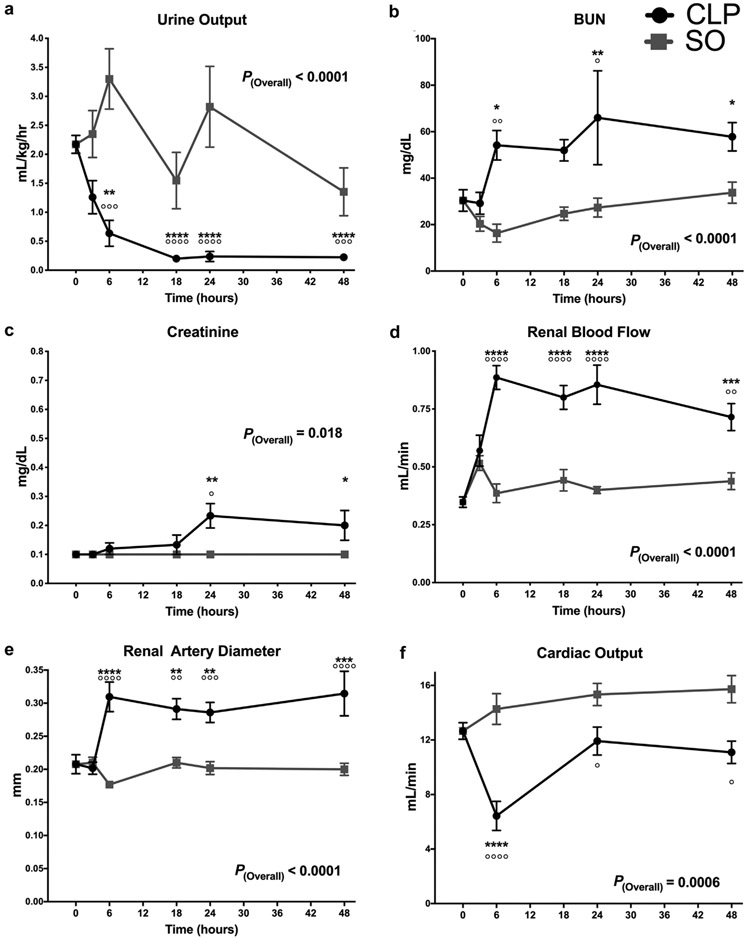
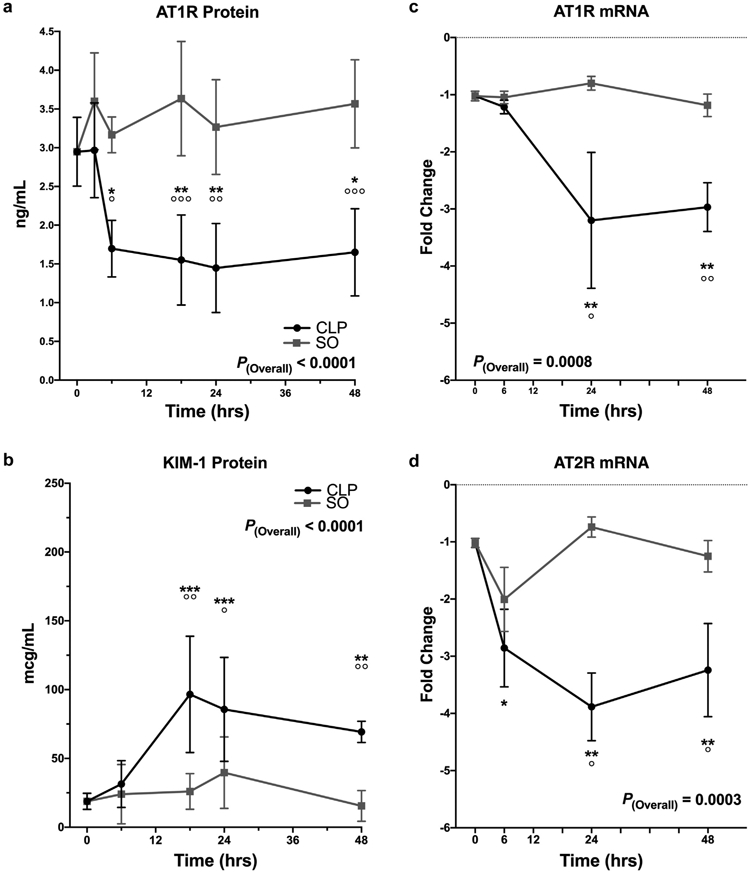
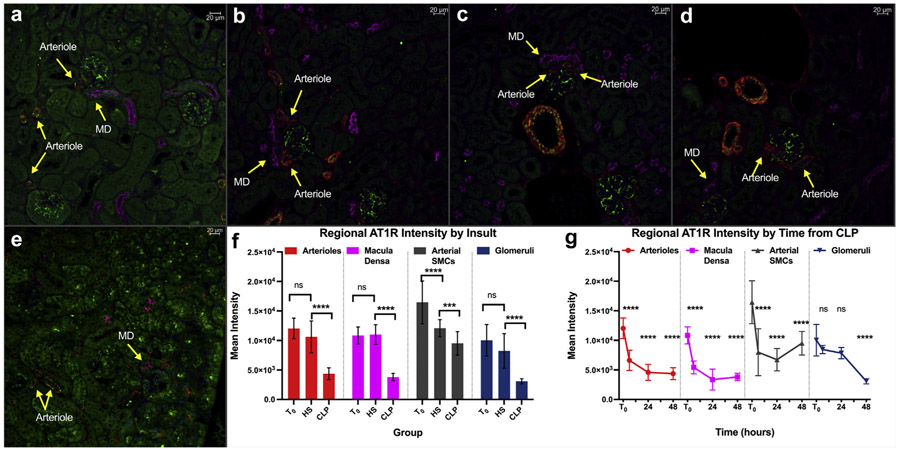
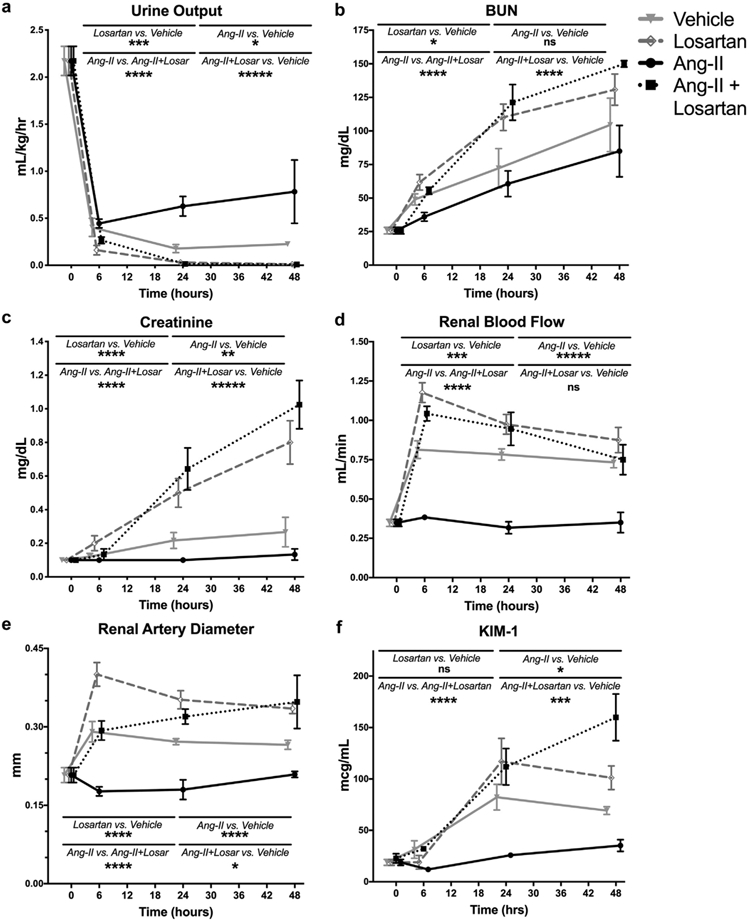
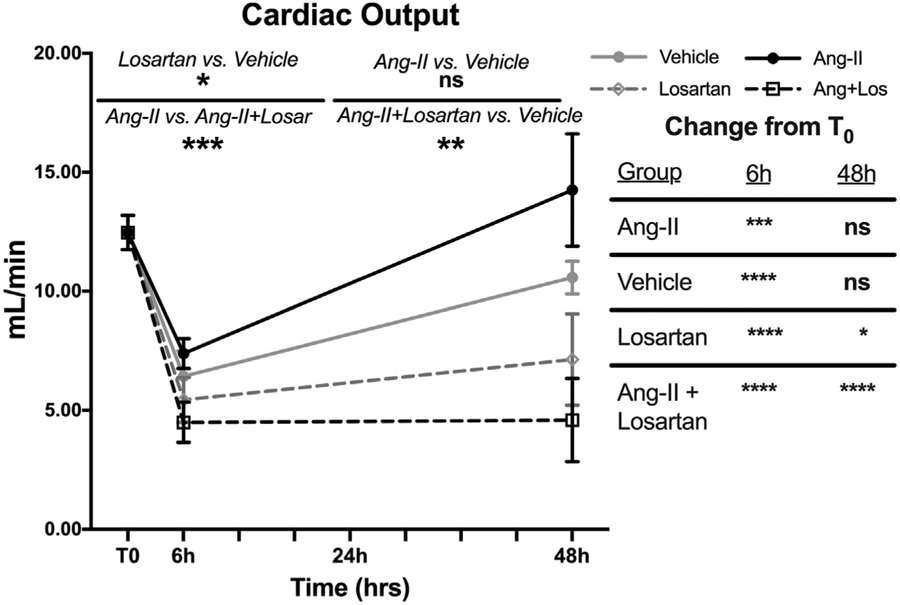
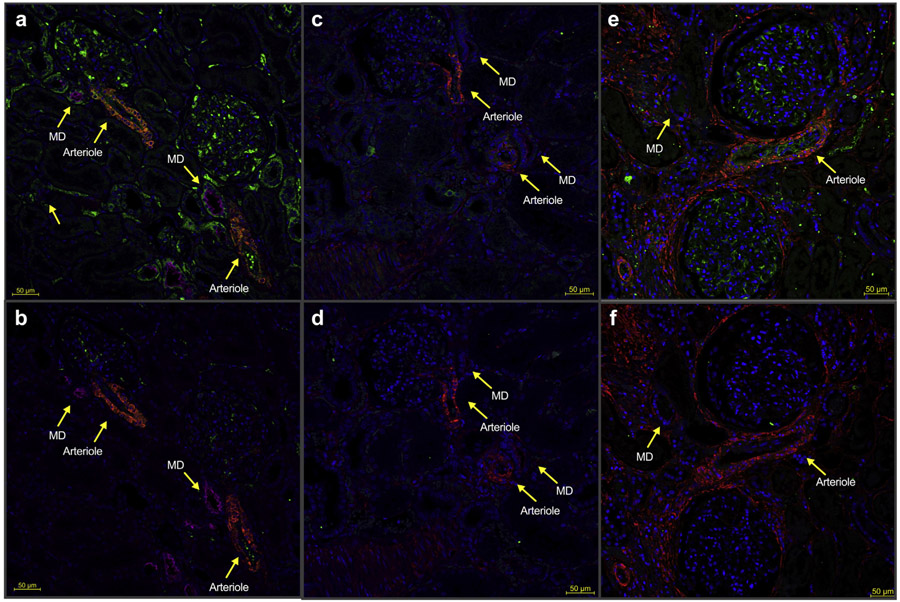
In sepsis-induced acute kidney injury, kidney blood flow may increase despite decreased glomerular filtration. Normally, angiotensin-II reduces kidney blood flow to maintain filtration. We hypothesized that sepsis reduces angiotensin type-1 receptor (AT1R) expression to account for this observation and tested this hypothesis in a patient case-control study and studies in mice. Seventy-three mice underwent cecal ligation and puncture (a sepsis model) or sham operation. Additionally, 94 septic mice received losartan (selective AT1R antagonist), angiotensin II without or with losartan, or vehicle. Cumulative urine output, kidney blood flow, blood urea nitrogen, and creatinine were measured. AT1R expression was assessed using ELISA, qPCR, and immunofluorescence. A blinded pathologist evaluated tissue for ischemic injury. AT1R expression was compared in autopsy tissue from seven patients with sepsis to that of the non-involved portion of kidney from ten individuals with kidney cancer and three non-infected but critically ill patients. By six hours post ligation/puncture, kidney blood flow doubled, blood urea nitrogen rose, and urine output fell. Concurrently, AT1R expression significantly fell 2-fold in arterioles and the macula densa. Creatinine significantly rose by 24 hours and sham operation did not alter measurements. Losartan significantly exacerbated ligation/puncture-induced changes in kidney blood flow, blood urea nitrogen, creatinine, and urine output. There was no histologic evidence of cortical ischemia. Significantly, angiotensin II prevented changes in kidney blood flow, creatinine, and urine output compared to vehicle. Co-administering losartan with angiotensin-II reversed this protection. Relative to both controls, patients with sepsis had low AT1R expression in arterioles and macula densa. Thus, murine cecal ligation/puncture and clinical sepsis decrease renal AT1R expression. Angiotensin II prevents functional changes while AT1R-blockade exacerbates them independent of ischemia in mice.

Keywords: acute kidney injury; angiotensin II; receptor, angiotensin, type 1; sepsis.


Figures

Figure 1∣
Figure 1∣. Cecal ligation and puncture (CLP) induces oliguric renal dysfunction and a high-flow, low-resistance hemodynamic state.
CLP versus sham operation (SO). Data as mean ± SD. p(overall) indicates the overall P value for the difference between CLP and SO groups. P < 0.05, **P < 0.01, ***P < 0.001, ****P < 0.0001 versus T0 controls. °P < 0.05, °°P < 0.01, °°°P < 0.001, °°°°P < 0.0001 for CLP versus SO at that time point. P values calculated using 2-way analysis of variance with Sidak’s post hoc correction for multiple comparisons. Data in (a) violated the homoscedastic error assumption and were subjected to natural-logarithm transformation. The data in (a) were transformed for P value calculation but untransformed values were graphed to provide clinically relevant values for visual interpretation. (a) Urine output (UOP). (b) Blood urea nitrogen (BUN). (c) Creatinine. (d) Renal blood flow. (e) Renal artery diameter. (f) Cardiac output.
Figure 2 ∣
Figure 2 ∣. Cecal ligation and puncture (CLP) alters renal arterial pulsewave Doppler waveform morphology.
Representative images of pulsewave Doppler recording used to measure renal arterial velocities. Blue indicates flow away from the ultrasound probe (toward the kidney) and red toward the probe (away from the kidney). Waveforms show arterial velocity on the Y-axis and time on the X-axis. (a) T0 mouse. (b) Mouse 48 hours after CLP.
Figure 3 ∣
Figure 3 ∣. Cecal ligation and puncture (CLP) induces early downregulation of renal angiotensin II type-1 receptor (AT1R) and kidney injury molecule 1 (KIM-1) elevation.
Concentration of specific proteins and mRNA in whole kidney homogenate determined using enzyme-linked immunosorbent assay and quantitative polymerase chain reaction, respectively. Data as mean ± SD. P(overall) indicates the overall p-value for the difference between CLP and sham operation (SO) groups. P < 0.05, **P < 0.01, ***P < 0.001, ****P < 0.0001 versus T0 controls. °P < 0.05, °°P < 0.01, °°°P < 0.001, °°°°P < 0.0001 for CLP versus SO at that time point. The 95% confidence intervals (CIs) of group differences and P values are determined using 2-way analysis of variance with Sidak’s post hoc correction for multiple comparisons. (a,b) Black circles = CLP; gray squares = SO. (a) AT1R protein in CLP versus SO. The 95% CIs and P values for CLP versus SO at each time point were as follows: 3 hours: −1.8 to 0.6 ng/ml, P = 0.6; 6 hours: −2.7 to −0.2 ng/ml, P = 0.013; 18 hours: −3.3 to −0.9 ng/ml, P < 0.001; 24 hours: −3.1 to −0.6 ng/ml, P = 0.002; 48 hours: −3.1 to −0.7 ng/ml; P = 0.001. (b) KIM-1 protein in CLP versus SO. The 95% CIs and P values at each time point were as follows: 6 hours: −34 to 49 mcg/ml, P = 0.99; 18 hours: 22 to 119 mcg/ml, P = 0.002; 24 hours: 4 to 88 mcg/ml, P = 0.025; 48 hours: 14 to 93 mcg/ml, P = 0.004. (c) AT1R mRNA in CLP versus SO. Y-axis shows fold-change relative to the glyceraldehyde-3-phosphate dehydrogenase housekeeping mRNA. 6 hours: −1.5 to 1.2 relative units, P = 0.99; 24 hours: −4.5 to −0.3 relative units, P = 0.021; 48 hours: −3.1 to −0.5 relative units, P = 0.004. (d) AT2R mRNA in CLP versus SO; 6 hours: −2.7 to 1.0 relative units, P = 0.66; 24 hours: −5.7 to −0.6 relative units, P = 0.011; 48 hours: −3.7 to −0.3 relative units, P = 0.013. AT2R, angiotensin II type 2 receptor.
Figure 4 ∣
Figure 4 ∣. Cecal ligation and puncture (CLP) decreases renal angiotensin II type-1 receptor (AT1R) expression in different regions of the renal cortex.
Representative fluorescence microscopic images of fixed kidney sections at original magnification ×20. Different structures labeled with different fluorescent tags. Green = AT1R; red = smooth muscle α-actin (smooth muscle); magenta = Na-K-Cl cotransporter (macula densa); blue = 4′,6-diamidino-2-phenylindole (nuclei). (a) T0 control. (b) Hemorrhagic shock (HS) control—kidney harvested 48 hours post–40% blood loss. (c) Six hours post-CLP. (d) Twenty-four hours post-CLP. (e) Forty-eight hours post-CLP. (f) Graphic depiction of quantification of AT1R fluorescence intensity in different renal structures at T0, at 48 hours post-HS or at 48 hours post-CLP. Bars indicate mean ± SD. P < 0.05, **P < 0.01, ***P < 0.001, ****P < 0.0001, ns = P > 0.05 for the group difference. Brackets indicate the 2 groups being compared. Red = arterioles; magenta = macula densa; gray = arterial smooth muscle cells; blue = glomeruli. (g) Graphic depiction of quantification of AT1R fluorescence intensity in different renal structures at different time points post-CLP. Point and error bar indicate mean ± SD. Colors represent region noted above. Asterisks indicate P value levels compared with T0 controls as above. SMCs, smooth muscle cells. To optimize viewing of this image, please see the online version of this article at www.kidney-international.org.
Figure 5 ∣
Figure 5 ∣. Cecal ligation and puncture (CLP)-induced changes in renal hemodynamics and function are mediated by angiotensin II type-1 receptor (AT1R)-dependent angiotensin II signaling.
Data as mean ± SD. *P < 0.05, **P < 0.01, ***P < 0.001, ****P < 0.0001, ns = P > 0.05 for group difference. P values calculated using 2-way analysis of variance with Sidak’s post hoc correction for multiple comparisons. Gray circles/solid gray line = CLP + vehicle; black circles/solid black line = CLP + Ang-II, gray diamonds/dashed gray line = CLP + losartan; black boxes/dashed black line = CLP + Ang-II + losartan. (a) Urine output. (b) Blood urea nitrogen (BUN). (c) Creatinine. (d) Renal blood flow. (e) Renal artery diameter. (f) KIM-1.
Figure 6 ∣
Figure 6 ∣. Angiotensin II type-1 receptor (AT1R) modulation alters the trajectory of cardiac output after cecal ligation and puncture (CLP).
Data as mean ± SD. *P < 0.05, **P < 0.01, ***P < 0.001, ****P < 0.0001, ns = P > 0.05 for the group difference. P values calculated using 2-way analysis of variance with Sidak’s post hoc correction for multiple comparisons. Gray circles/solid gray line = CLP + vehicle; black circles/solid black line = CLP + Ang-II; gray diamonds/dashed gray line = CLP + losartan; black boxes/dashed black line = CLP + Ang-II + losartan. Table at right shows comparison of the treatment group at the indicated time to the T0 measurements.
Figure 7 ∣
Figure 7 ∣. Recently deceased sepsis patients show decreased renal angiotensin II type-1 receptor (AT1R).
Representative immunofluorescence images of renal cortical tissue from sepsis patients versus healthy and noninfected critically ill controls. Fluorescence: Green = AT1R; red = smooth muscle α-actin (smooth muscle); magenta = Na-K-Cl cotransporter (macula densa); blue = 4′,6-diamidino-2-phenylindole (nuclei). Control (Ctrl) is a serial section in which the primary antibody cocktail was preincubated with free AT1R peptide to prevent anti-AT1R primary antibody from binding to target antigen in tissue. Green fluorescence in the sample that is absent in the adjacent control therefore confirms the specificity of the signal to AT1R. (a) Healthy tissue. (b) Serial section from healthy tissue where anti-AT1R antibody was preadsorbed with control peptide. (c) Tissue from a sepsis victim. (d) Serial section from a sepsis victim with preadsorbed anti-AT1R. (e) Tissue from a deceased noninfected critically ill control. (f) Serial section with preadsorbed anti-AT1R from a deceased noninfected critically ill control. ICU, intensive care unit; MD, macula densa. To optimize viewing of this image, please see the online version of this article at www.kidney-international.org.

References

    1. Singer M, Deutschman CS, Seymour CW, et al. The Third International Consensus Definitions for Sepsis and Septic Shock (Sepsis-3). JAMA. 2016;315:801–810. - PMC - PubMed
    1. Ali T, Khan I, Simpson W, et al. Incidence and outcomes in acute kidney injury: a comprehensive population-based study. J Am Soc Nephrol. 2007;18:1292–1298. - PubMed
    1. Bagshaw SM, George C, Bellomo R, Committee ADM. Early acute kidney injury and sepsis: a multicentre evaluation. Crit Care. 2008;12:R47. - PMC - PubMed
    1. Kellum JA, Prowle JR. Paradigms of acute kidney injury in the intensive care setting. Nat Rev Nephrol. 2018;14:217–230. - PubMed
    1. Gomez H, Kellum JA. Sepsis-induced acute kidney injury. Curr Opin Crit Care. 2016;22:546–553. - PMC - PubMed

Publication types