

Exceedances and trends of particulate matter (PM2.5) in five Indian megacities
- PMID: 32882489
- PMCID: PMC7417276
- DOI: 10.1016/j.scitotenv.2020.141461
Exceedances and trends of particulate matter (PM2.5) in five Indian megacities
Abstract
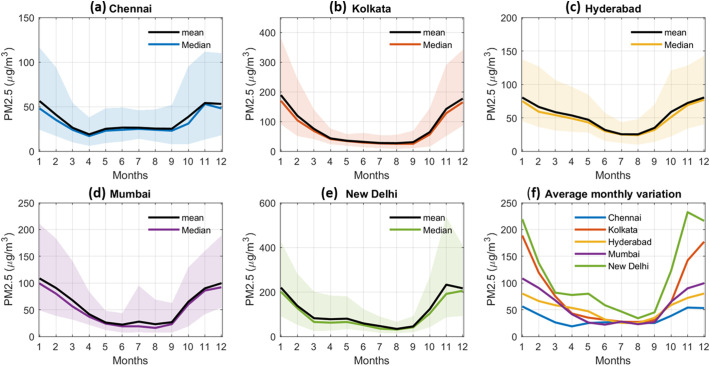
Fine particulate matter (PM2.5) is the leading environmental risk factor that requires regular monitoring and analysis for effective air quality management. This work presents the variability, trend, and exceedance analysis of PM2.5 measured at US Embassy and Consulate in five Indian megacities (Chennai, Kolkata, Hyderabad, Mumbai, and New Delhi) for six years (2014-2019). Among all cities, Delhi is found to be the most polluted city followed by Kolkata, Mumbai, Hyderabad, and Chennai. The trend analysis for six years for five megacities suggests a statistically significant decreasing trend ranging from 1.5 to 4.19 μg/m3 (2%-8%) per year. Distinct diurnal, seasonal, and monthly variations are observed in the five cities due to the different site locations and local meteorology. All cities show the highest and lowest concentrations in the winter and monsoon months respectively except for Chennai which observed the lowest levels in April. All the cities consistently show morning peaks (~08: 00-10:00 h) and the lowest level in late afternoon hours (~15:00-16:00 h). We found that the PM2.5 levels in the cities exceed WHO standards and Indian NAAQS for 50% and 33% of days in a year except for Chennai. Delhi is found to have more than 200 days of exceedances in a year and experiences an average 15 number of episodes per year when the level exceeds the Indian NAAQS. The trends in the exceedance with a varying threshold (20-380 μg/m3) suggest that not only is the annual mean PM2.5 decreasing in Delhi but also the number of exceedances is decreasing. This decrease can be attributed to the recent policies and regulations implemented in Delhi and other cities for the abatement of air pollution. However, stricter compliance of the National Clean Air Program (NCAP) policies can further accelerate the reduction of the pollution levels.
Keywords: Air quality; Delhi; Emissions; Long-term trends; Pollution episodes; U.S. Embassy & Consulates.
Copyright © 2020 Elsevier B.V. All rights reserved.
Conflict of interest statement
Declaration of competing interest The author(s) declare(s) that there is no conflict of interest regarding the publication of this article.
Figures


References
-
- Ali K., Panicker A.S., Beig G., Srinivas R., Acharja P. Carbonaceous aerosols over Pune and Hyderabad (India) and influence of meteorological factors. J. Atmos. Chem. 2016;73(1):1–27.
-
- Ali K., Acharja P., Trivedi D.K., Kulkarni R., Pithani P., Safai P.D.…Rajeevan M. Characterization and source identification of PM2.5 and its chemical and carbonaceous constituents during Winter Fog Experiment 2015–16 at Indira Gandhi International Airport, Delhi. Science of The Total Environment. 2019;662:687–696. - PubMed
-
- Alimissis A., Philippopoulos K., Tzanis C.G., Deligiorgi D. Spatial estimation of urban air pollution with the use of artificial neural network models. Atmos. Environ. 2018;191:205–213.
-
- Appel, K.W., Bhave, P.V., Gilliland, A.B., Sarwar, G., Roselle, S.J., 2008. Evaluation of the community multiscale air quality (CMAQ) model version 4.5: sensitivities impacting model performance; part II—particulate matter. Atmos. Environ. 42, 6057–6066. https://doi.org/ 10.1016/j.atmosenv.2008.03.036. - DOI
LinkOut - more resources
Full Text Sources
Other Literature Sources
Miscellaneous
