. 2020 Sep 1;12(9):2477.
doi: 10.3390/cancers12092477.

ATP Production Relies on Fatty Acid Oxidation Rather than Glycolysis in Pancreatic Ductal Adenocarcinoma

Affiliations

ATP Production Relies on Fatty Acid Oxidation Rather than Glycolysis in Pancreatic Ductal Adenocarcinoma

Jae-Seon Lee et al. Cancers (Basel). .

Abstract

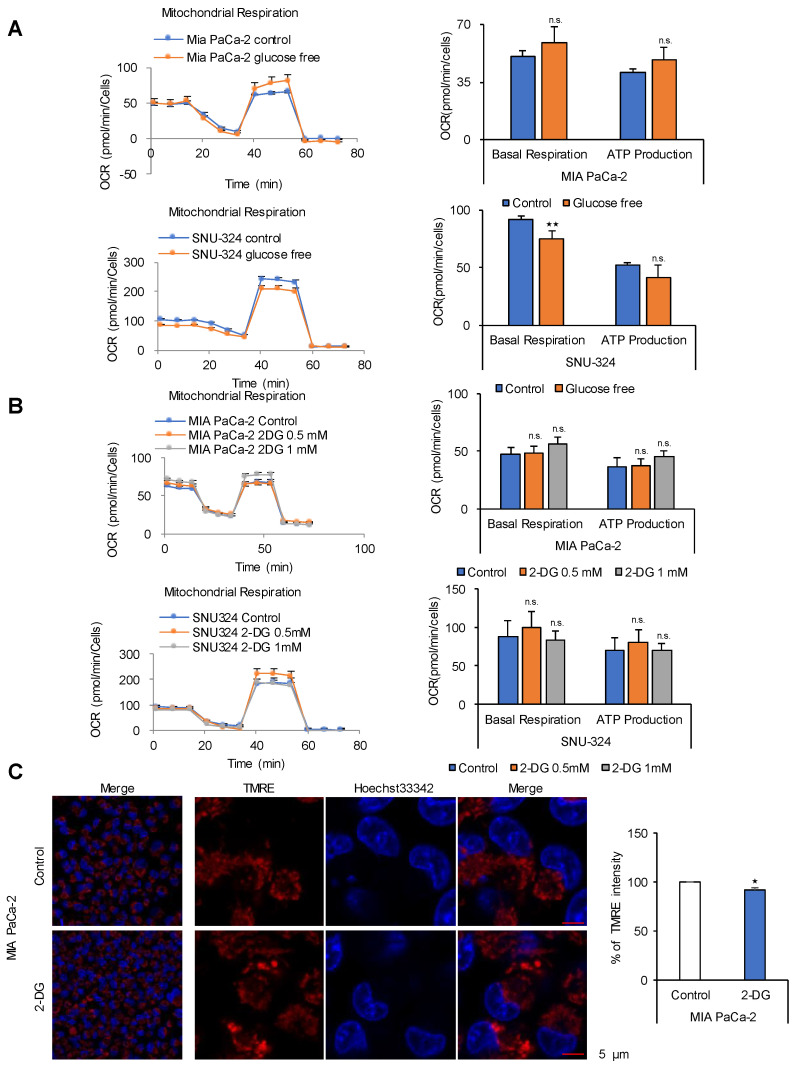
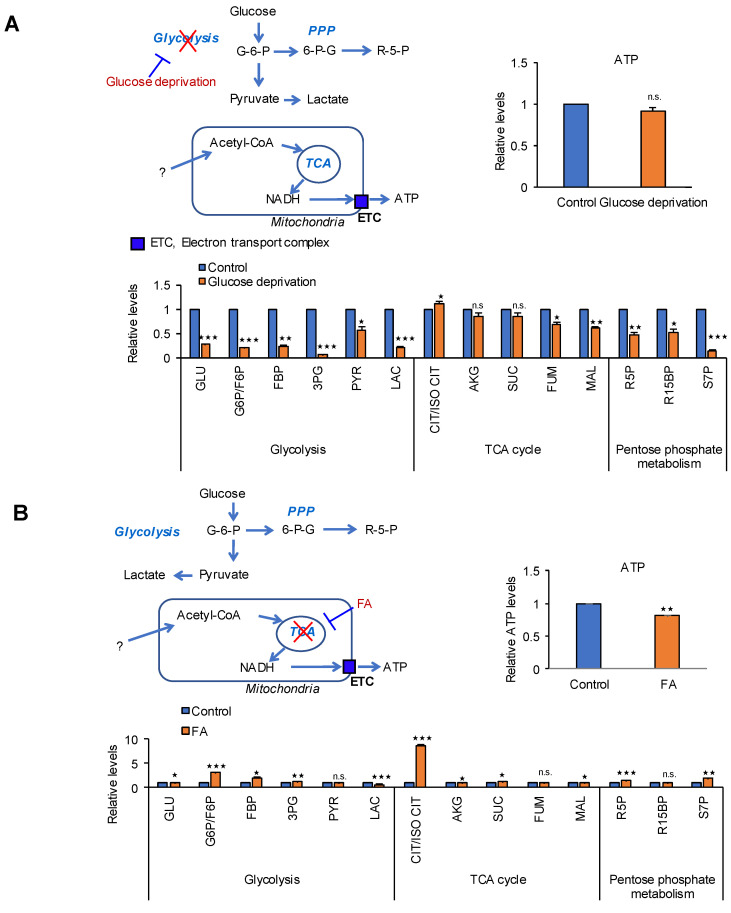
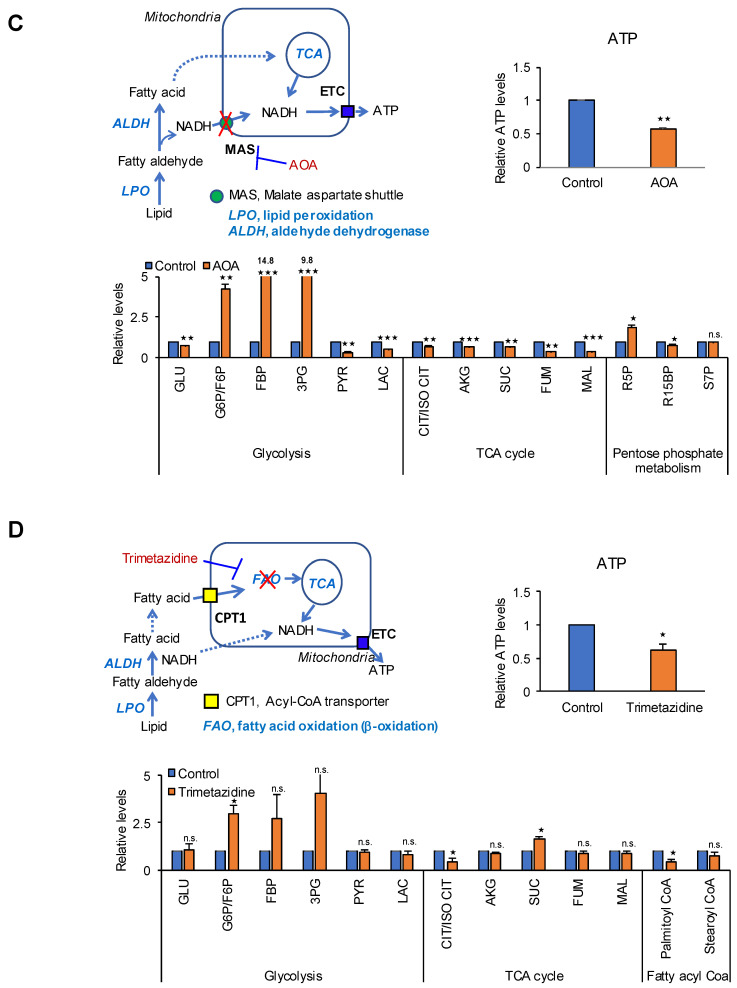
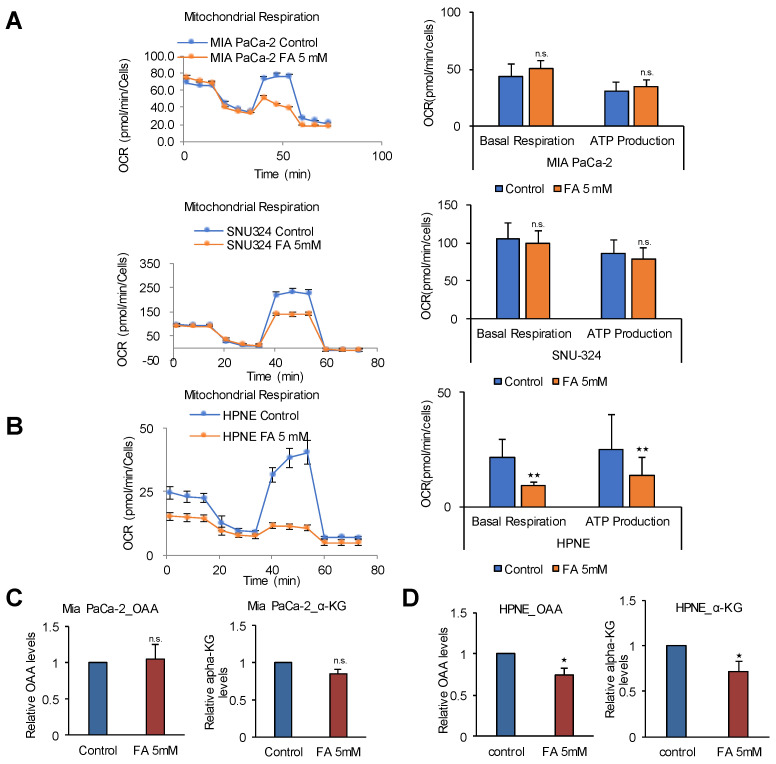
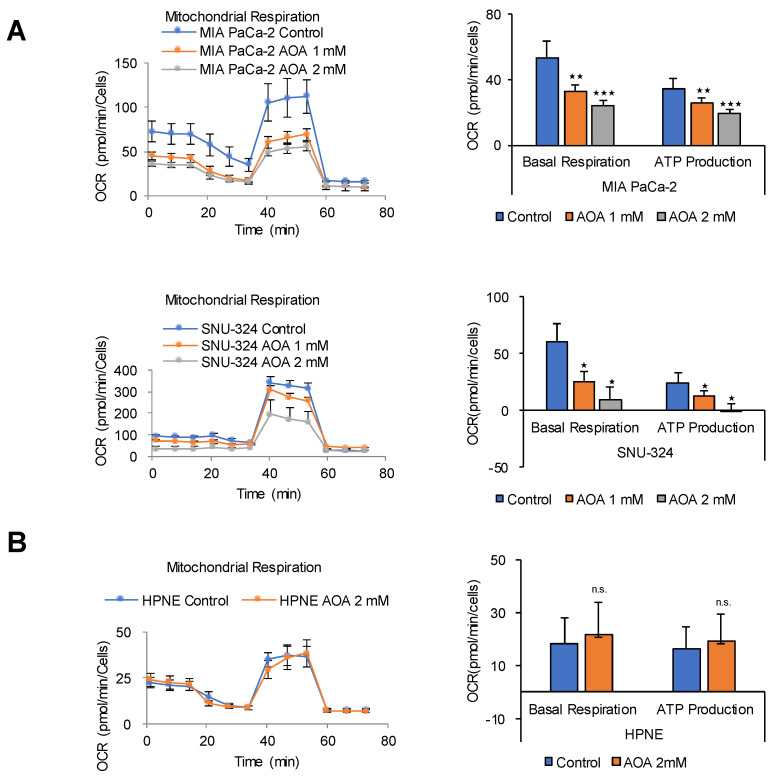
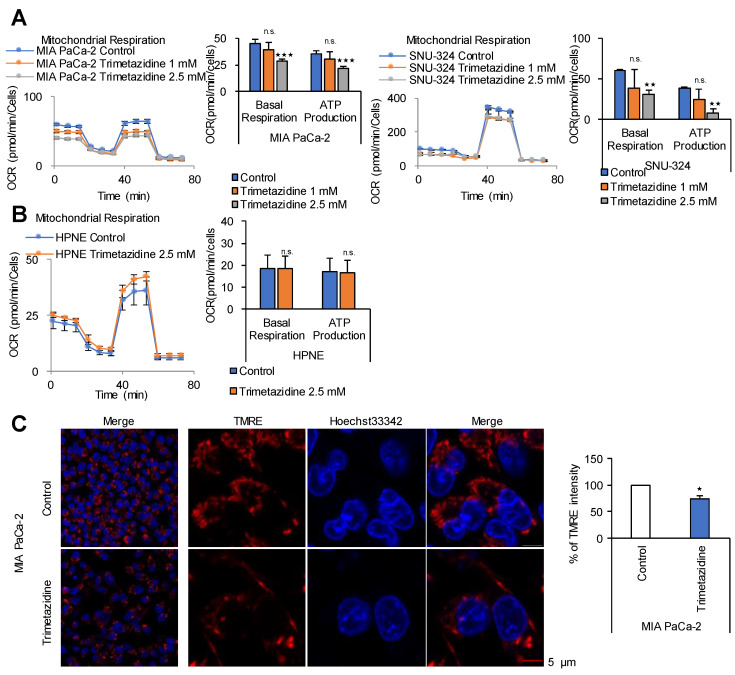
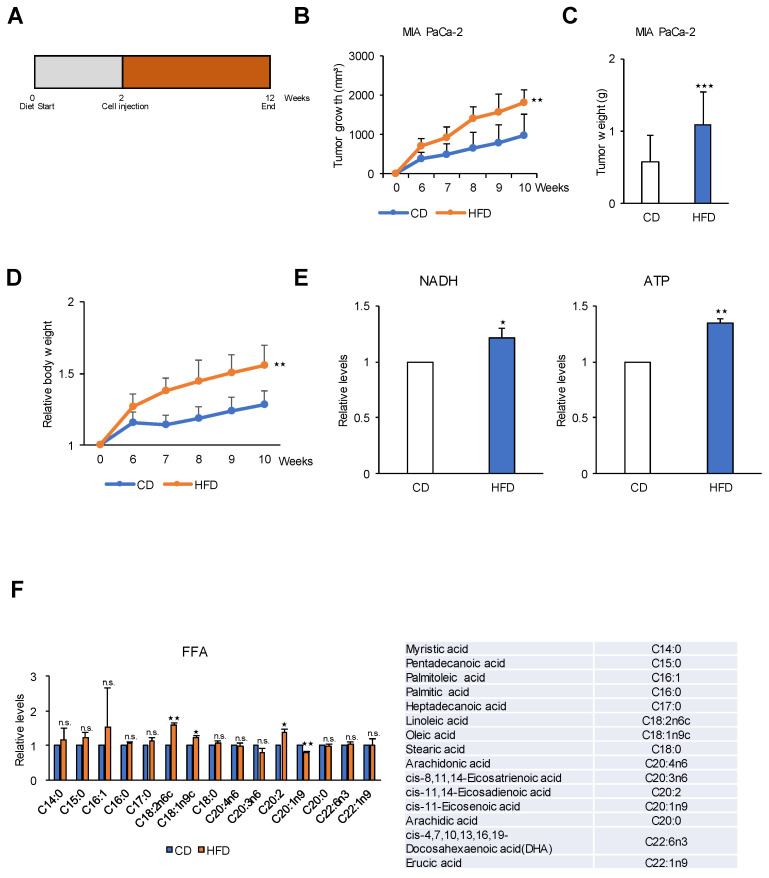
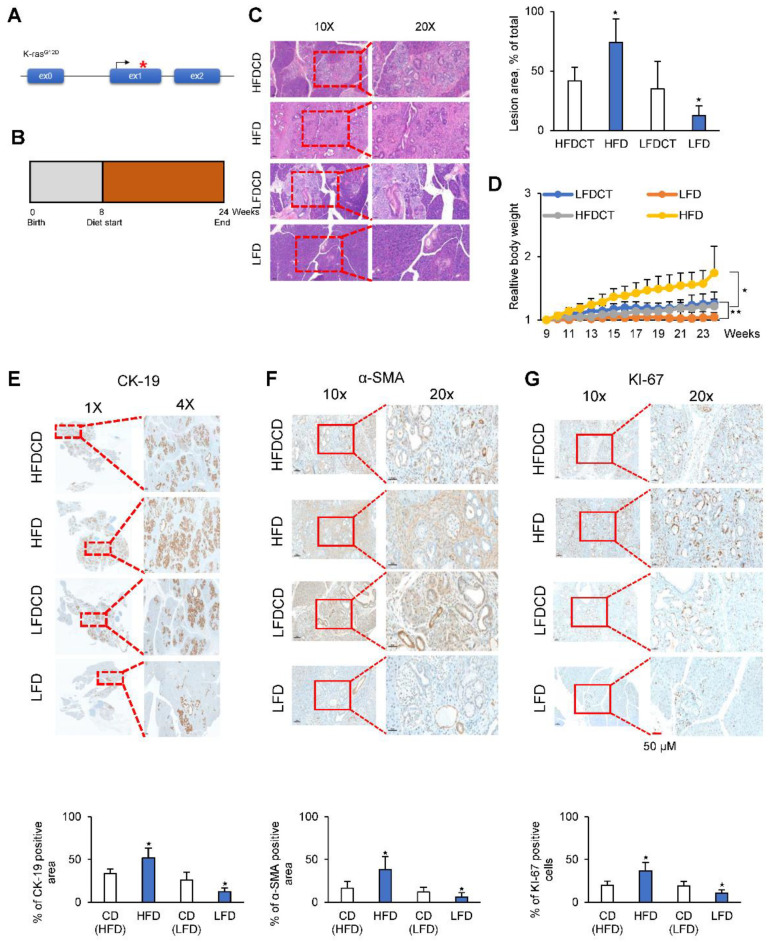
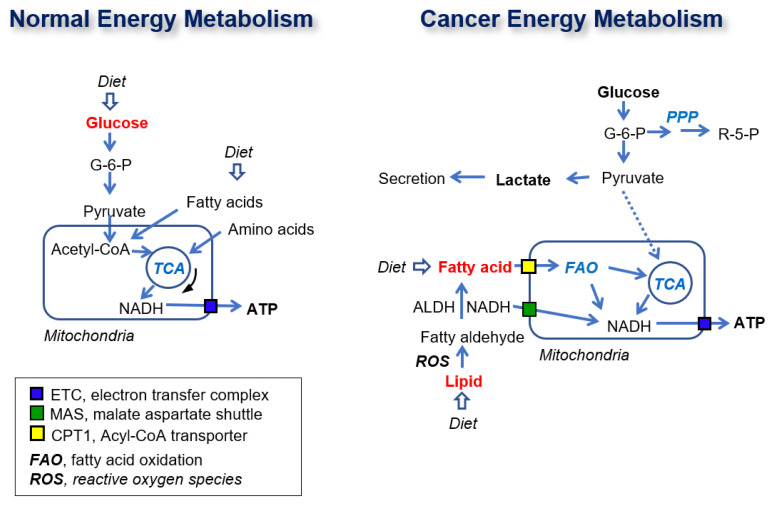
Glycolysis is known as the main pathway for ATP production in cancer cells. However, in cancer cells, glucose deprivation for 24 h does not reduce ATP levels, whereas it does suppress lactate production. In this study, metabolic pathways were blocked to identify the main pathway of ATP production in pancreatic ductal adenocarcinoma (PDAC). Blocking fatty acid oxidation (FAO) decreased ATP production by 40% in cancer cells with no effect on normal cells. The effects of calorie balanced high- or low-fat diets were tested to determine whether cancer growth is modulated by fatty acids instead of calories. A low-fat diet caused a 70% decrease in pancreatic preneoplastic lesions compared with the control, whereas a high-fat diet caused a two-fold increase in preneoplastic lesions accompanied with increase of ATP production in the Kras (G12D)/Pdx1-cre PDAC model. The present results suggest that ATP production in cancer cells is dependent on FAO rather than on glycolysis, which can be a therapeutic approach by targeting cancer energy metabolism.

Keywords: ATP production; KC mouse; PDAC; fatty acid oxidation; glycolysis.


Conflict of interest statement

The authors declare no conflict of interest.

Figures

Figure 1
Figure 1
Glucose is not the ATP source in cancer cells. (A) Seahorse XF analysis of MIA PaCa-2 and SNU-324 cells treated sequentially with oligomycin, the chemical uncoupler FCCP, and antimycin A/Rotenone. The oxygen consumption rate (OCR) was determined using the Seahorse XFe96 analyzer in normal medium compared with glucose deprivation medium. (B) OCR in response to 0.5 mM and 1 mM of 2-DG. Abbreviations: 2-DG, 2-Deoxy-D-glucose. (C) MIA PaCa-2 cells were treated with 1 mM of 2-DG for 48 h, and the mitochondrial membrane potential was determined by TMRE staining and live cell imaging. Scale bar = 5 µm. n.s. (not significant), * p < 0.05, ** p < 0.01 compared with the vehicle control.
Figure 2
Figure 2
MAS and FAO are major contributors to ATP production in pancreatic cancer cells. Effect of blocking metabolic pathways were analyzed by relative pool sizes of metabolites using targeted LC-MS/MS after various treatments for 24 h. (A) glucose deprivation medium for blocking glycolysis, (B) 5 mM of fluoroacetate (FA) for blocking TCA cycle, (C) 750 µM of amino-oxy acetate (AOA) for blocking MAS system, and (D) 2.5 mM of trimetazidine treatments for blocking FAO in MIA PaCa-2 cells. Data represent the mean and standard deviation of three independent experiments. n.s. (not significant), * p < 0.05, ** p < 0.01, *** p < 0.001 compared with the vehicle control.
Figure 2
Figure 2
MAS and FAO are major contributors to ATP production in pancreatic cancer cells. Effect of blocking metabolic pathways were analyzed by relative pool sizes of metabolites using targeted LC-MS/MS after various treatments for 24 h. (A) glucose deprivation medium for blocking glycolysis, (B) 5 mM of fluoroacetate (FA) for blocking TCA cycle, (C) 750 µM of amino-oxy acetate (AOA) for blocking MAS system, and (D) 2.5 mM of trimetazidine treatments for blocking FAO in MIA PaCa-2 cells. Data represent the mean and standard deviation of three independent experiments. n.s. (not significant), * p < 0.05, ** p < 0.01, *** p < 0.001 compared with the vehicle control.
Figure 3
Figure 3
The TCA cycle is not involved in ATP production in PDAC cells. (A) OCR was analyzed using the Seahorse XFe96 analyzer. OCR in response to 5 mM of FA in MIA PaCa-2, SNU-324, and (B) normal HPNE cells. (C) The levels of OAA and α-KG were measured after treatment of MIA PaCa-2 cells with 5 mM of FA for 24 h using OAA colorimetric/fluorometric assay kit and α-KG colorimetric/fluorometric assay kit. (D) The levels of OAA and α-KG were measured after treatment of HPNE cells with 5 mM of FA for 24 h. Abbreviations: FA, fluoroacetate. OAA, oxaloacetate. α-KG, α-ketoglutarate. n.s. (not significant), * p < 0.05, ** p < 0.01 compared with the vehicle control.
Figure 4
Figure 4
MAS inhibition dose-dependently decreases ATP synthesis in PDAC cells but not in normal cells. (A) OCR in response to 1 mM or 2 mM of AOA was analyzed using the Seahorse XFe96 analyzer in MIA PaCa-2, SNU-324, and (B) HPNE cells. Abbreviations: AOA, amino-oxy acetate. n.s. (not significant), * p < 0.05, ** p < 0.01, *** p < 0.001 compared with the vehicle control.
Figure 5
Figure 5
FAO inhibition dose-dependently decreases ATP synthesis in PDAC cells. (A) OCR in response to 1 mM or 2.5 mM of trimetazidine was measured using the Seahorse XFe96 analyzer in MIA PaCa-2, SNU-324, and (B) HPNE cells. OCR and ATP production in PDAC cells showed dose-dependent reduction while OCR and ATP production in normal cells showed no reduction. (C) The mitochondrial membrane potential was determined by TMRE staining and live cell imaging in MIA PaCa-2 cells treated with 2.5 mM of trimetazidine for 48 h. Scale bar = 5 µm. * p < 0.05, ** p < 0.01, *** p < 0.001 compared with the vehicle control. n.s., not significant.
Figure 6
Figure 6
A high-fat diet increases tumor growth in a human pancreatic cancer xenograft mouse model. (A) MIA PaCa-2 (1 × 10⁷) cells were injected into 6–8-week-old BALB/c nude mice (n = 6 per group) exposed to a HFD or a CD for 12 weeks. (B) Tumor growth was measured using calipers. Tumor size is 2-fold greater in HFD group than in the CD group at 10 weeks. (C) Final weight of subcutaneous tumors derived from MIA PaCa-2 cells were measured. Tumor weight is 2-fold greater in HFD group than in the CD group at 10 weeks. (D) Effect of HFD on body weight in MIA PaCa-2 xenograft mouse model. (E) The levels of NADH and ATP were measured in CD and HFD groups by LC-MS/MS analysis. (F) Effect of HFD on metabolites in MIA PaCa-2 tumor tissues. Relative pool sizes of metabolites determined by targeted GC-MS. FFA, free-fatty acids; CD, control diet; HFD, high fat diet. * p < 0.05, ** p < 0.01, *** p < 0.001 compared with the control diet. n.s., not significant.
Figure 7
Figure 7
A low-fat diet abrogated spontaneous tumor formation in a KC mouse model. (A) Schematic illustration of the genetic construct used to activate KrasG12D in the pancreas of KC mice. (B) Schematic showing the experimental design of diet protocols in KC mice for 24 weeks. (C) H&E staining of the pancreas in calorie balanced CD, HFD, and LFD mice, and quantification of the percentage of PanlN lesions (left). Lesion area was analyzed by software and presented as % of the total area (right). (D) Changes in body weight of KrasG12D; Pdx1-cre mice for 24 weeks in calorie balanced CD, HFD, and LFD. (EG) Staining of the pancreas in CD, HFD, and LFD mice using antibodies of CK-19 as a ductal epithelial marker, α-SMA as a stromal fibrosis marker, and KI-67 as a proliferation marker. LFD, low-fat diet; HFD, high-fat diet; LFDCD and HFDCD, control diets of low fat diet and high fat diet. Scale bar = 50 µm * p < 0.05, ** p < 0.01.
Figure 8
Figure 8
Schematic diagram of normal and cancer energy metabolism. The dotted line presents weak connection. The red color metabolites present major contributor of ATP production.

References

    1. Warburg O. On respiratory impairment in cancer cells. Science. 1956;124:269–270. - PubMed
    1. Pedersen P.L. Tumor mitochondria and the bioenergetics of cancer cells. Prog. Exp. Tumor Res. 1978;22:190–274. doi: 10.1159/000401202. - DOI - PubMed
    1. Xu R.H., Pelicano H., Zhou Y., Carew J.S., Feng L., Bhalla K.N., Keating M.J., Huang P. Inhibition of glycolysis in cancer cells: A novel strategy to overcome drug resistance associated with mitochondrial respiratory defect and hypoxia. Cancer Res. 2005;65:613–621. - PubMed
    1. Moreno-Sanchez R., Rodriguez-Enriquez S., Marin-Hernandez A., Saavedra E. Energy metabolism in tumor cells. FEBS J. 2007;274:1393–1418. doi: 10.1111/j.1742-4658.2007.05686.x. - DOI - PubMed
    1. DeBerardinis R.J., Chandel N.S. Fundamentals of cancer metabolism. Sci. Adv. 2016;2:e1600200. doi: 10.1126/sciadv.1600200. - DOI - PMC - PubMed

LinkOut - more resources