. 2020 Oct 23;127(10):1306-1322.
doi: 10.1161/CIRCRESAHA.119.316162. Epub 2020 Sep 4.

Infarct Collagen Topography Regulates Fibroblast Fate via p38-Yes-Associated Protein Transcriptional Enhanced Associate Domain Signals

Affiliations

Infarct Collagen Topography Regulates Fibroblast Fate via p38-Yes-Associated Protein Transcriptional Enhanced Associate Domain Signals

Darrian Bugg et al. Circ Res. .

Abstract

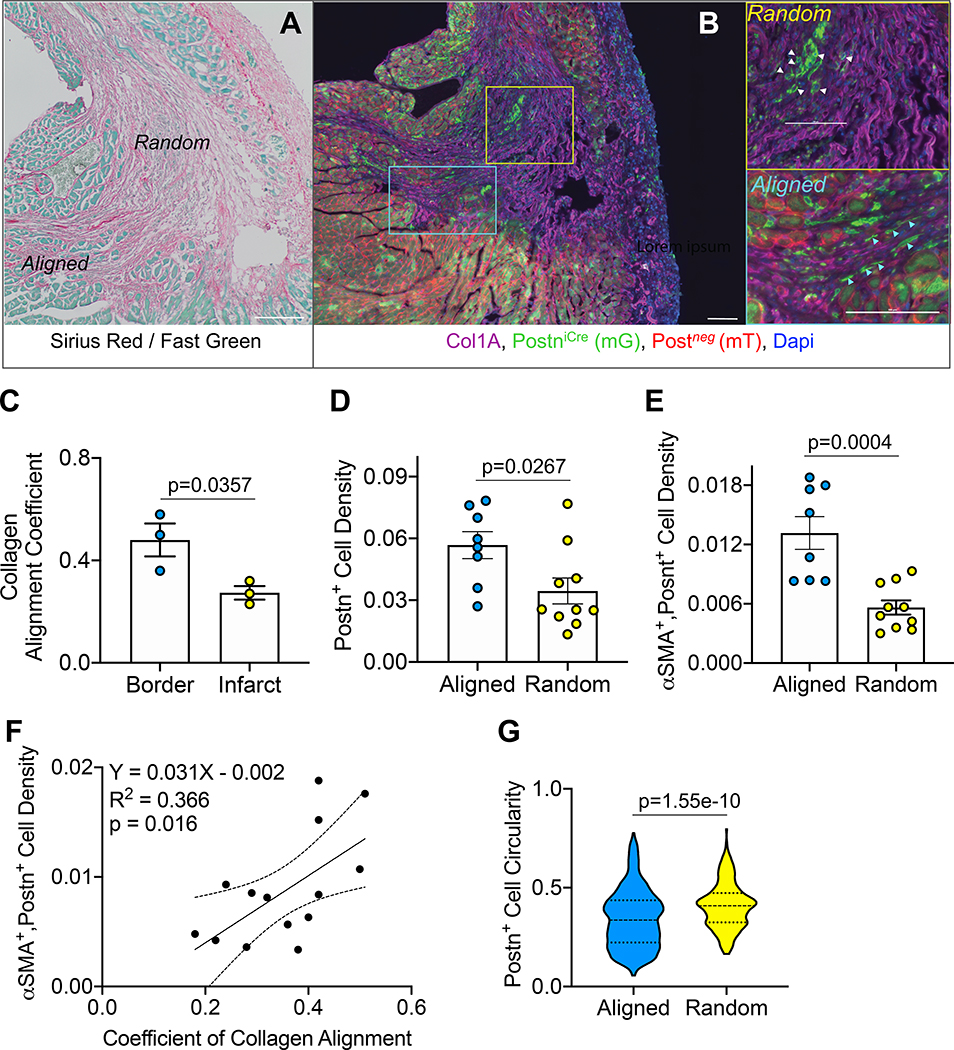
Rationale: Myocardial infarction causes spatial variation in collagen organization and phenotypic diversity in fibroblasts, which regulate the heart's ECM (extracellular matrix). The relationship between collagen structure and fibroblast phenotype is poorly understood but could provide insights regarding the mechanistic basis for myofibroblast heterogeneity in the injured heart.

Objective: To investigate the role of collagen organization in cardiac fibroblast fate determination.

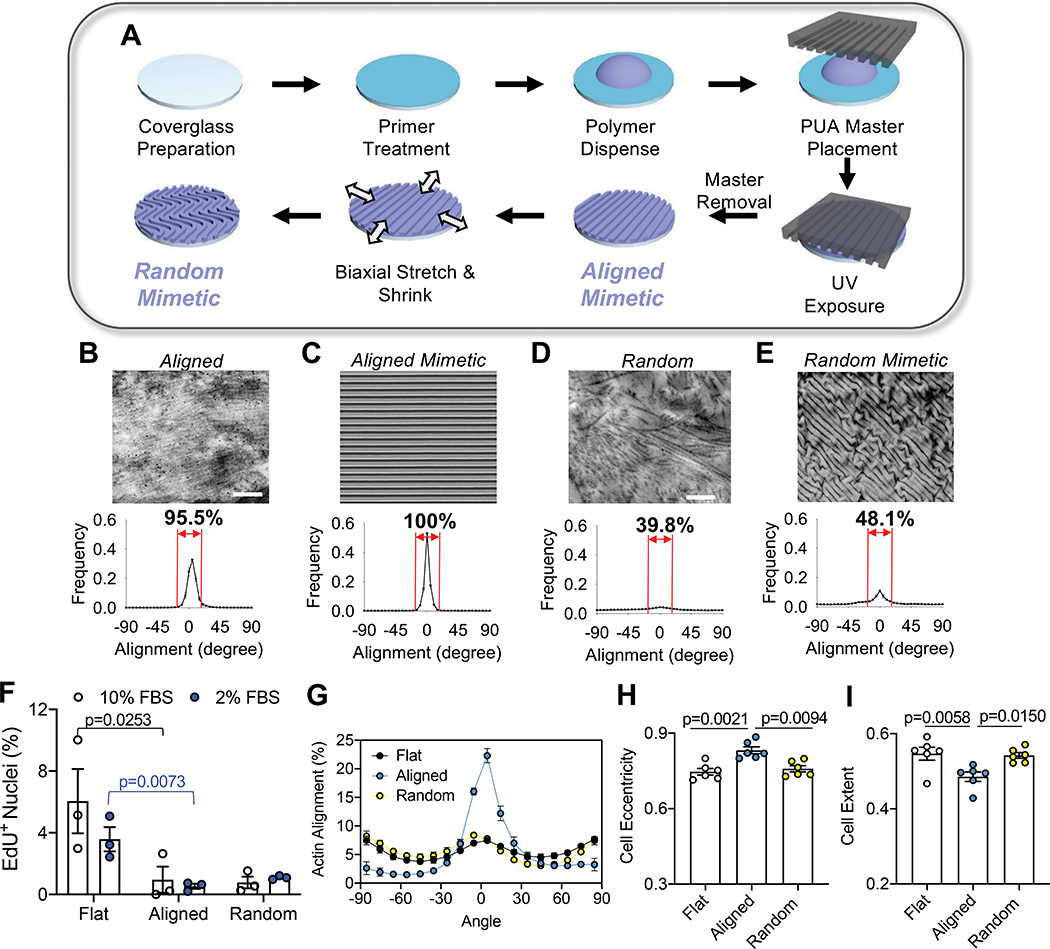
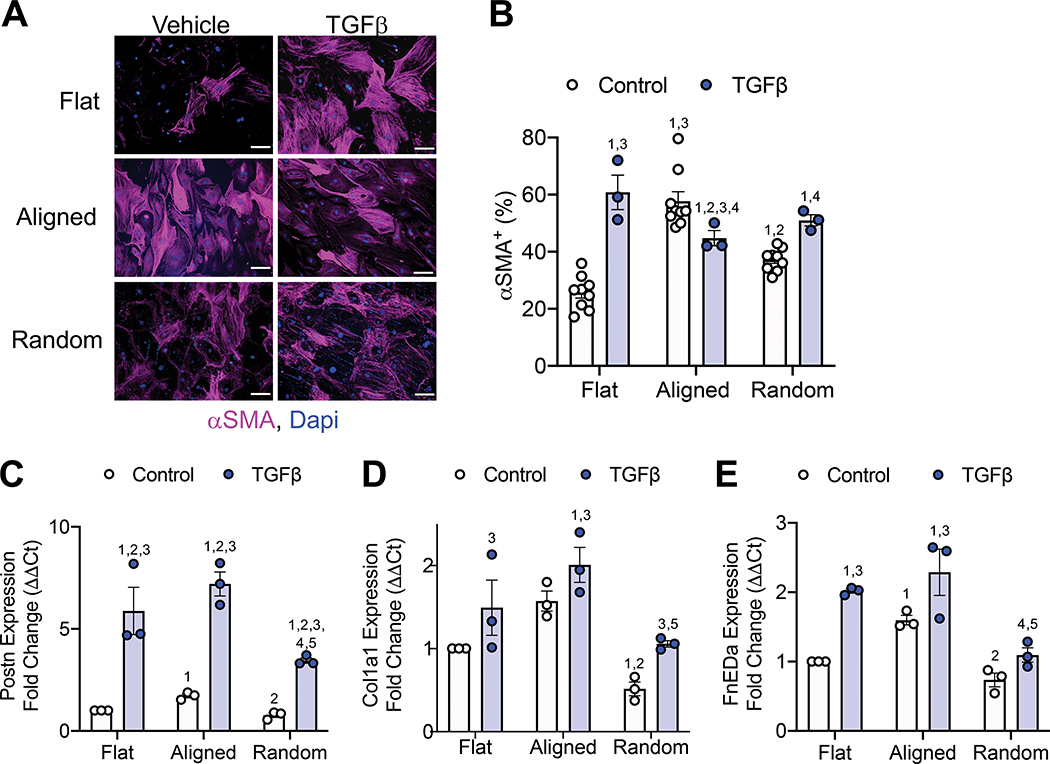
Methods and results: Biomimetic topographies were nanofabricated to recapitulate differential collagen organization in the infarcted mouse heart. Here, adult cardiac fibroblasts were freshly isolated and cultured on ECM topographical mimetics for 72 hours. Aligned mimetics caused cardiac fibroblasts to elongate while randomly organized topographies induced circular morphology similar to the disparate myofibroblast morphologies measured in vivo. Alignment cues also induced myofibroblast differentiation, as >60% of fibroblasts formed αSMA (α-smooth muscle actin) stress fibers and expressed myofibroblast-specific ECM genes like Postn (periostin). By contrast, random organization caused 38% of cardiac fibroblasts to express αSMA albeit with downregulated myofibroblast-specific ECM genes. Coupling topographical cues with the profibrotic agonist, TGFβ (transforming growth factor beta), additively upregulated myofibroblast-specific ECM genes independent of topography, but only fibroblasts on flat and randomly oriented mimetics had increased percentages of fibroblasts with αSMA stress fibers. Increased tension sensation at focal adhesions induced myofibroblast differentiation on aligned mimetics. These signals were transduced by p38-YAP (yes-associated protein)-TEAD (transcriptional enhanced associate domain) interactions, in which both p38 and YAP-TEAD (yes-associated protein transcriptional enhanced associate domain) binding were required for myofibroblast differentiation. By contrast, randomly oriented mimetics did not change focal adhesion tension sensation or enrich for p38-YAP-TEAD interactions, which explains the topography-dependent diversity in fibroblast phenotypes observed here.

Conclusions: Spatial variations in collagen organization regulate cardiac fibroblast phenotype through mechanical activation of p38-YAP-TEAD signaling, which likely contribute to myofibroblast heterogeneity in the infarcted myocardium.

Keywords: extracellular matrix; fibroblasts; fibrosis; myocardial infarction; nanotechnology.


Figures

Figure 1.
Figure 1.. Regions of the infarcted heart with highly aligned collagen are associated with increased myofibroblast density.
Representative images of A Sirius Red-Fast Green and B Collagen I immunofluorescent staining of cardiac sections from infarcted periostin-lineage reporter mice (PostniCre-mT/mG). Boxed insets show examples of regions with collagen fibers aligned in parallel versus disorganized (random) orientation. Scale bars=100mm. C Quantification of the average collagen alignment coefficient in the border zone versus the infarct core. Mann-Whitney test was used, n=3 mice per group with 2–4 regions assessed per mouse. D Quantification of the average number of Postn+ cells (stained by eGFP, PostniCre- mG in B ) and E cells positive for both αSMA and Postn in regions of aligned (coefficients ≥ 0.4 in C, n=8) versus randomly (coefficients < 0.4 in C, n=10) oriented collagen. Unpaired t test used. F Linear regression analysis demonstrating the relationship between αSMA+, Postn+ myofibroblast density and collagen organization where coefficients ≥ 0.4 equate to a high frequency of aligned collagen fibers. Dashed line = 95% confidence interval. G Violin plot of the shape of Postn+ cells in regions of aligned (coefficients ≥ 0.4 in C) versus randomly (coefficients < 0.4 in C) oriented collagen. Dashed line represents the mean and dotted lines represent the 1st and 3rd quartile. Mann-Whitney test used. Graphs represent Mean ± SEM, and filled circles denote biological replicates.
Figure 2.
Figure 2.. Nanoengineered mimetics of collagen topography alter cardiac fibroblast proliferation and morphology.
A Schematics depicting the nanofabrication of each biomimetic. Transmission electron microscopy (TEM) image of B (Top) aligned and D (Top) randomly oriented collagen fibers in regions of aligned collagen (coefficients ≥ 0.4 in Figure 1C) in infarcted mouse hearts, and (Bottom) the corresponding histogram of the percent collagen fibers aligned within 20° of the major axis. Scanning electron microscopy (SEM) image of nanoengineered C (Top) aligned and E (Top) randomly oriented collagen biomimetic and (Bottom) the corresponding histogram of the percent collagen fiber aligned within 20° of the major axis. F Quantification of EdU+ cardiac fibroblasts cultured on flat, aligned, or random biomimetics in proliferation conditions (10% FBS, n=3 mice, 123–395 cells counted per mouse on Flat, 454–904 cells counted per mouse on Aligned, & 263–1099 cells counted per mouse on Random) and differentiation conditions (2% FBS, n=3 mice, 201–409 cells counted per mouse on Flat, 309–480 cells counted per mouse on Aligned, & 552–1560 cells counted per mouse on Random). Kruskal-Wallis test was performed independently for proliferation and differentiation conditions followed by uncorrected Dunn’s multiple comparison test between patterns. G Quantification of actin stress fiber alignment (n=3 biological replicates per pattern). H Quantification of cell eccentricity (0 = circular and 1 = a line segment) and I cell extent (higher values = more protrusions) in cardiac fibroblasts on flat (94–284 cells studied per mouse), aligned (83–767 cells studied per mouse), or random (171–844 cells studied per mouse) biomimetics. Kruskal-Wallis test followed by uncorrected Dunn’s multiple comparison tests were made between patterns, n=6 biological replicates per group. Graphs represent Mean±SEM.
Figure 3.
Figure 3.. Aligned topographical mimetics promote cardiac fibroblast to myofibroblast differentiation.
A Immunofluorescent images and B quantification of the percentage of cardiac fibroblasts positive for αSMA stress fibers on flat (177–399 cells studied per mouse), aligned (157–344 cells studied per mouse), and random (220–470 cells studied per mouse) biomimetics with (n=9 mice) and without TGFb (n=3 mice). Scale bars=100mm. Mixed effects logistic regression followed by Bonferroni corrected post hoc comparisons were made between groups. Fold change in C periostin (Postn), D collagen 1a (Col1a1), and E fibronectin EDa splice variant (FnEDa) gene expression in fibroblasts on flat, aligned, and random biomimetics with and without TGFb treatment. Values are calculated using the 2-DDCt method and expressed relative to the flat,control condition, n=3 biological replicates per group. Log transformed outcome and two-way ANOVA with the natural log of the variable of interest as the outcome variable and Bonferroni corrected pairwise comparisons were used for analysis. Graphs represent Mean±SEM, 1 vs Control,Flat, 2 vs Control,Aligned, 3 vs Control,Random, 4 vs TGFb,Flat, 5 vs TGFb,Aligned.
Figure 4.
Figure 4.. Alignment-induced focal adhesion and cytoskeletal remodeling is mediated by heightened tension sensation.
A Representative immunofluorescent images of MEFs cultured on flat, aligned and random biomimetics stained with DAPI (blue) and Tensin 1 (red). Scale bar = 30mm. Quantification of Tensin 1 positive focal adhesion B number and C size in MEFs cultured on flat, aligned and random biomimetics. D Fold change in Tenascin C (TnC) gene expression in cardiac fibroblasts on flat, aligned and random biomimetics. Values are calculated using the 2-DDCt method and expressed relative to the flat condition. Quantification of (E) focal adhesion (FA) alignment index and (F) average FRET efficiency in cardiac fibroblasts expressing a vinculin tension sensor. F,Left Representative image of the acceptor intensity and FRET efficiency of fibroblasts on a flat mimetic. Scale bar = 100mm. Graphs represent Mean±SEM and filled circles denote biological replicates. 1-way ANOVA followed by Tukey post hoc comparisons between groups. G Quantification of the percentage of cardiac fibroblasts positive for αSMA stress fibers when cultured on flat, aligned, and random biomimetics with and without Tensin 1 knockdown (siTensin1). Graphs represent Mean±SEM and filled circles denote biological replicates. Mixed effects logistic regression followed by Bonferroni corrected post hoc comparisons were used for analysis, 1 vs Control,Flat, 2 vs Control,Aligned.
Figure 5.
Figure 5.. p38 is required for alignment-induced myofibroblast differentiation and co-localization of YAP and TEAD.
A Representative western blot and B densitometry analysis of p38 and GAPDH expression in cardiac fibroblasts cultured on flat, aligned and random biomimetics with (+) and without (−) Cre. Graph represent Mean±SEM, n=3 biological replicates, log transformed outcome and two-way ANOVA with the natural log of the variable of interest as the outcome variable and Bonferroni corrected pairwise comparisons were used for analysis: 1 vs p38F/F,Flat, 2 vs p38F/F,Aligned, 3 vs p38F/F,Random. C Quantification of intensity of p38 staining in the nucleus in cardiac fibroblasts cultured on flat and aligned biomimetics. Graph represent Mean±SEM, n=36 biological replicates per group. Mann-Whitney test used. D Quantification of the percentage of p38F/F cardiac fibroblasts positive for αSMA stress fibers on flat (231–451 cells studied per mouse within each condition), aligned (186–279 cells studied per mouse within each condition), and random biomimetics (253–380 cells studied per mouse within each condition) with and without Cre, n=3 biological replicates, and mixed effects logistic regression followed by Bonferroni corrected post hoc comparisons were made between groups: 1 vs p38F/F,Flat, 2 vs p38F/F,Aligned, 3 vs p38F/F,Random. E Quantification of the nuclear colocalization of p38 and YAP and F p38 and TEAD in cardiac fibroblasts on flat and aligned biomimetics. Graph represent Mean±SEM, n=36 biological replicates per group. Mann-Whitney test used. G Representative western blot of lysates (Input) and phosphorylated-p38 immunoprecipated proteins (IP: Phos-p38) from these inputs, which were derived from cardiac fibroblasts on flat, aligned (align), and random (Rnd) biomimetics. H Quantification of the ratio of phospho-p38 immunoprecipitated TEAD to TEAD-input and I YAP to YAP-input. Here, log transformed outcome analysis and one-way ANOVA with the natural log of the variable of interest as the outcome variable and Bonferroni corrected pairwise comparisons were used for analysis. All graphs represent Mean±SEM, filled circles denote biological replicates, and ns = not significant.
Figure 6.
Figure 6.. p38-YAP-TEAD interactions are necessary for alignment-induced myofibroblast differentiation.
A Representative Western blot of phosphorylated YAP (phos-YAP), total YAP, pan TEAD, and GAPDH expression. Here GAPDH served as a loading control. B Densitometry analysis of YAP protein levels normalized to GAPDH. C Change in YAP gene expression in cardiac fibroblasts on flat, aligned and random biomimetics with (+) and without (−) Cre. Values are calculated using the 2-DDCt method and expressed relative to flat,p38F/F condition. D Quantification of the ratio of phosphorylated YAP to total YAP protein levels in cardiac fibroblasts on flat, aligned and random biomimetics with (+) and without (−) Cre. For B, C, and D, graphs represent Mean±SEM, n=3 biological replicates,and log transformed outcome and two-way ANOVA with the natural log of the variable of interest as the outcome variable and Bonferroni corrected pairwise comparisons were used for analysis where: 1 vs p38F/F,Flat, 2 vs p38F/F,Aligned, 3 vs p38F/F,Random, 4 vs p38F/F-Cre,Flat, and 5 vs p38F/F-Cre,Aligned. Quantification of intensity of E YAP and F TEAD staining in the nucleus of p38F/F cardiac fibroblasts cultured on flat and aligned biomimetics with and without Cre. Graphs represent Mean±SEM, n=18 except for the Aligned-p38F/F-Cre group in E where the n=14. 2-Way ANOVA and Tukey post hoc comparisons were made between groups, 1 vs flat,p38F/F, 2 vs flat,p38F/F-Cre, 3 vs aligned,p38F/F. G Representative images and H quantification of nuclear YAP staining intensity (purple) in PDGFRa+ cardiac fibroblasts (green) in cardiac tissue sections from infarcted p38F/F and p38F/F-Tcf21iCre mice. Nuclei are stained with Hoechst and staining intensity was subclassified by regions of aligned (coefficients ≥ 0.4 in Figure 1C) versus random (coefficients < 0.4 in Figure 1C) collagen organization. Scale bars=50mm. Graph represent Mean±SEM, n=3–5 biological replicates as denoted by the circles, 2-Way ANOVA and Tukey post hoc comparisons were made between groups, 1 vs flat,p38F/F, 2 vs flat,p38F/F-Cre, 3 vs aligned,p38F/F. I Quantification of the percentage of fibroblasts positive for αSMA stress fibers on flat (177–504 cells studied per mouse), aligned (310–604 cells studied per mouse), and random biomimetics (320–358 cells studied per mouse) with and without dominant negative YAP (YAPS94A) expression. Mixed effects logistic regression followed by Bonferroni corrected post hoc comparisons were made between groups. Fold change in J periostin (Postn) and K fibronectin EDa splice variant (FnEDa) gene expression in cardiac fibroblasts on flat, aligned, and random biomimetics with and without dominant negative YAP (YAPS94A) expression. Values are calculated using the 2-DDCt method and expressed relative to the flat,control condition. Here log transformed outcome and two-way ANOVA with the natural log of the variable of interest as the outcome variable and Bonferroni corrected pairwise comparisons were used for analysis. For I-K, graphs represent Mean±SEM, and statistically significant comparisons defined as: 1 vs flat,control, 2 vs aligned,control, and 3 vs random,control. L Quantification of the percentage of fibroblasts positive for αSMA stress fibers on flat (202–279 cells studied per mouse), aligned (310–604 cells studied per mouse), and random (204–402 cells studied per mouse) biomimetics with and without constitutively active YAP (YAPS127A) expression. Graph represent Mean±SEM, n=3 biological replicates, mixed effects logistic regression followed by Bonferroni corrected post hoc comparisons were made between groups where: 1 vs flat,p38F/F, 2 vs flat,p38F/F-Cre, 3 vs flat,p38F/F,YAPS127A, 4 vs flat,p38F/F-Cre,YAPS127A, 5 vs aligned,p38F/F, 6 vs aligned,p38F/F-Cre, 7 vs aligned,p38F/F,YAPS127A, 8 vs aligned,p38F/F-Cre,YAPS127A, 9 vs random,p38F/F-Cre, only significant relationships are shown.
Figure 7.
Figure 7.. Signaling model of ECM topography-dependent regulation of programmed cardiac myofibroblast differentiation.
Dashed arrow represents previously identified interactions between signaling nodes.

References

    1. Richardson WJ, Clarke SA, Quinn TA and Holmes JW. Physiological Implications of Myocardial Scar Structure. Compr Physiol. 2015;5:1877–909. - PMC - PubMed
    1. Rog-Zielinska EA, Norris RA, Kohl P and Markwald R. The Living Scar--Cardiac Fibroblasts and the Injured Heart. Trends Mol Med. 2016;22:99–114. - PMC - PubMed
    1. Fomovsky GM, Thomopoulos S and Holmes JW. Contribution of extracellular matrix to the mechanical properties of the heart. J Mol Cell Cardiol. 2010;48:490–6. - PMC - PubMed
    1. Stempien-Otero A, Kim DH and Davis J. Molecular networks underlying myofibroblast fate and fibrosis. J Mol Cell Cardiol. 2016;97:153–61. - PMC - PubMed
    1. Sullivan KE, Quinn KP, Tang KM, Georgakoudi I and Black LD, 3rd. Extracellular matrix remodeling following myocardial infarction influences the therapeutic potential of mesenchymal stem cells. Stem Cell Res Ther. 2014;5:14. - PMC - PubMed

Publication types

MeSH terms