

Genomic differentiation across the speciation continuum in three hummingbird species pairs
- PMID: 32883209
- PMCID: PMC7469328
- DOI: 10.1186/s12862-020-01674-9
Genomic differentiation across the speciation continuum in three hummingbird species pairs
Abstract
Background: The study of speciation has expanded with the increasing availability and affordability of high-resolution genomic data. How the genome evolves throughout the process of divergence and which regions of the genome are responsible for causing and maintaining that divergence have been central questions in recent work. Here, we use three pairs of species from the recently diverged bee hummingbird clade to investigate differences in the genome at different stages of speciation, using divergence times as a proxy for the speciation continuum.
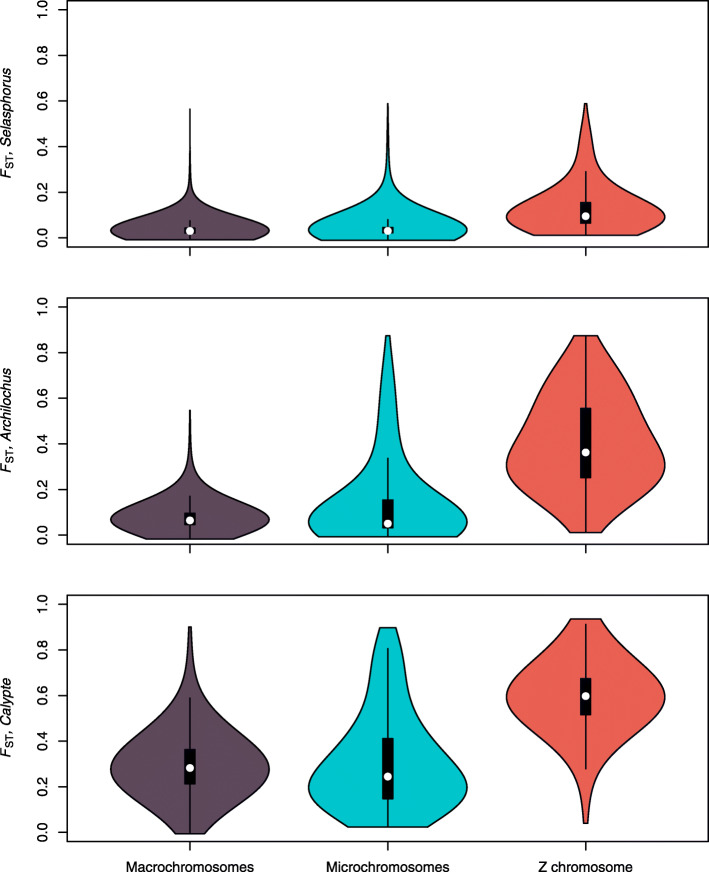
Results: Population measures of relative differentiation between hybridizing species reveal that different chromosome types diverge at different stages of speciation. Using FST as our relative measure of differentiation we found that the sex chromosome shows signs of divergence early in speciation. Next, small autosomes (microchromosomes) accumulate highly diverged genomic regions, while the large autosomes (macrochromosomes) accumulate genomic regions of divergence at a later stage of speciation.
Conclusions: Our finding that genomic windows of elevated FST accumulate on small autosomes earlier in speciation than on larger autosomes is counter to the prediction that FST increases with size of chromosome (i.e. with decreased recombination rate), and is not represented when weighted average FST per chromosome is compared with chromosome size. The results of this study suggest that multiple chromosome characteristics such as recombination rate and gene density combine to influence the genomic locations of signatures of divergence.
Keywords: Divergence; FST; Hummingbird; Polymorphism; Speciation continuum; Speciation genomics; dxy.
Conflict of interest statement
The authors declare that they have no competing interests.
Figures


Similar articles
-
Divergence with gene flow across a speciation continuum of Heliconius butterflies.BMC Evol Biol. 2015 Sep 24;15:204. doi: 10.1186/s12862-015-0486-y. BMC Evol Biol. 2015. PMID: 26403600 Free PMC article.
-
The genomic landscape at a late stage of stickleback speciation: High genomic divergence interspersed by small localized regions of introgression.PLoS Genet. 2018 May 23;14(5):e1007358. doi: 10.1371/journal.pgen.1007358. eCollection 2018 May. PLoS Genet. 2018. PMID: 29791436 Free PMC article.
-
Pronounced differentiation on the Z chromosome and parts of the autosomes in crowned sparrows contrasts with mitochondrial paraphyly: implications for speciation.J Evol Biol. 2024 Feb 14;37(2):171-188. doi: 10.1093/jeb/voae004. J Evol Biol. 2024. PMID: 38305563
-
Sex chromosomes and speciation in birds and other ZW systems.Mol Ecol. 2018 Oct;27(19):3831-3851. doi: 10.1111/mec.14537. Epub 2018 Mar 23. Mol Ecol. 2018. PMID: 29443419 Review.
-
Making sense of genomic islands of differentiation in light of speciation.Nat Rev Genet. 2017 Feb;18(2):87-100. doi: 10.1038/nrg.2016.133. Epub 2016 Nov 14. Nat Rev Genet. 2017. PMID: 27840429 Review.
Cited by
-
Whole-genome Analyses Reveal Past Population Fluctuations and Low Genetic Diversities of the North Pacific Albatrosses.Mol Biol Evol. 2023 Jul 3;40(7):msad155. doi: 10.1093/molbev/msad155. Mol Biol Evol. 2023. PMID: 37402641 Free PMC article.
-
Chromosome size affects sequence divergence between species through the interplay of recombination and selection.Evolution. 2022 Apr;76(4):782-798. doi: 10.1111/evo.14467. Epub 2022 Mar 23. Evolution. 2022. PMID: 35271737 Free PMC article.
-
The Genomic Signature of Allopatric Speciation in a Songbird Is Shaped by Genome Architecture (Aves: Certhia americana).Genome Biol Evol. 2021 Aug 3;13(8):evab120. doi: 10.1093/gbe/evab120. Genome Biol Evol. 2021. PMID: 34042960 Free PMC article.
-
Linked supergenes underlie split sex ratio and social organization in an ant.Proc Natl Acad Sci U S A. 2021 Nov 16;118(46):e2101427118. doi: 10.1073/pnas.2101427118. Proc Natl Acad Sci U S A. 2021. PMID: 34772805 Free PMC article.
-
Repeatable Selection on Large Ancestry Blocks in an Avian Hybrid Zone.Mol Biol Evol. 2025 Mar 5;42(3):msaf044. doi: 10.1093/molbev/msaf044. Mol Biol Evol. 2025. PMID: 39992157 Free PMC article.
References
-
- Campbell RC, Poelstra JW, Yoder AD. What is speciation genomics? The roles of ecology, gene flow, and genomic architecture in the formation of species. Biol J Linnean Soc. 2018;124:561–583.
-
- Mayr E. Animal species and evolution. Cambridge, Mass: Harvard University Press; 1963.
-
- Mallet J. Hybridization as an invasion of the genome. Trends Ecol Evol. 2005;20:229–237. - PubMed
Publication types
MeSH terms
Grants and funding
LinkOut - more resources
Full Text Sources
Miscellaneous
