. 2020 Nov;216(3):717-734.
doi: 10.1534/genetics.120.303629. Epub 2020 Sep 3.

HtsRC-Mediated Accumulation of F-Actin Regulates Ring Canal Size During Drosophila melanogaster Oogenesis

Affiliations

HtsRC-Mediated Accumulation of F-Actin Regulates Ring Canal Size During Drosophila melanogaster Oogenesis

Julianne A Gerdes et al. Genetics. 2020 Nov.

Abstract

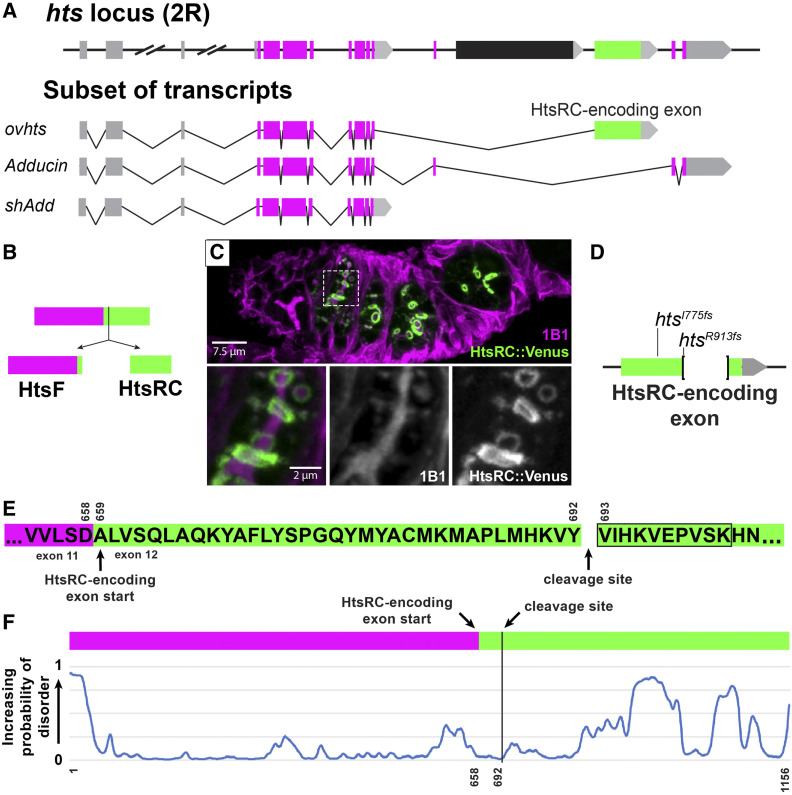
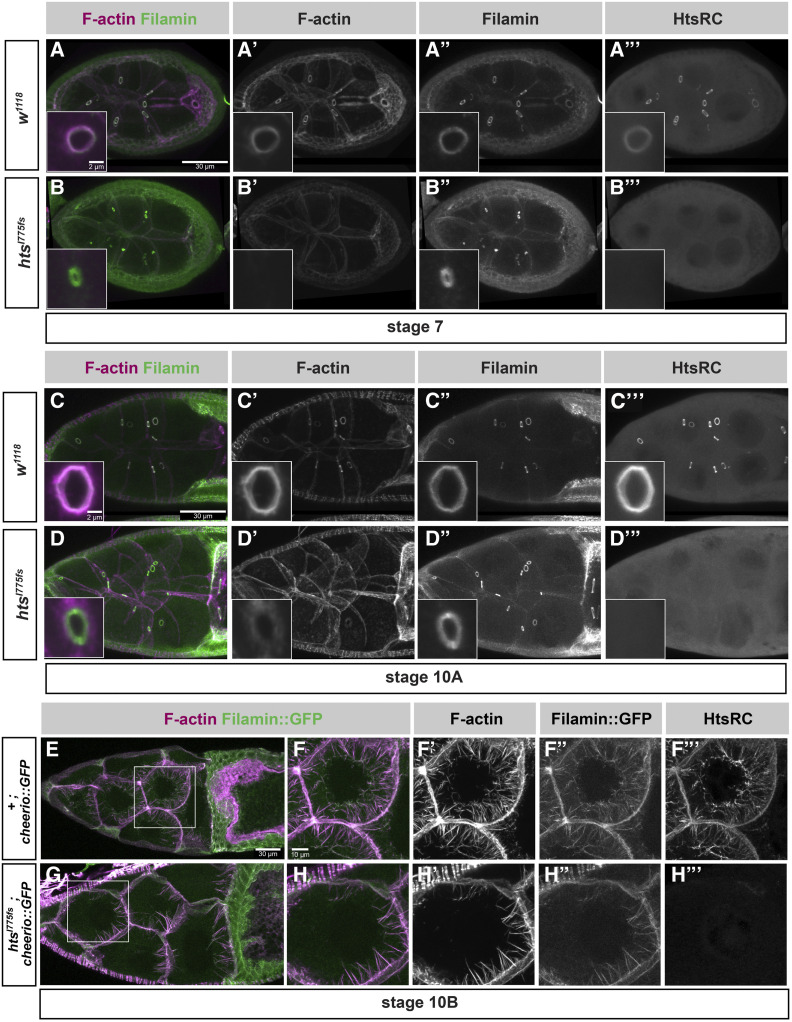
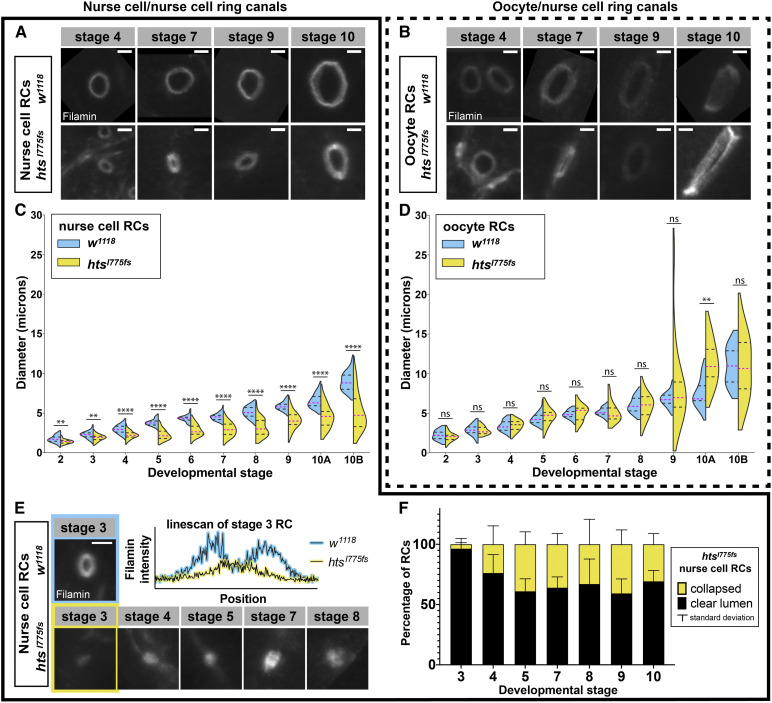
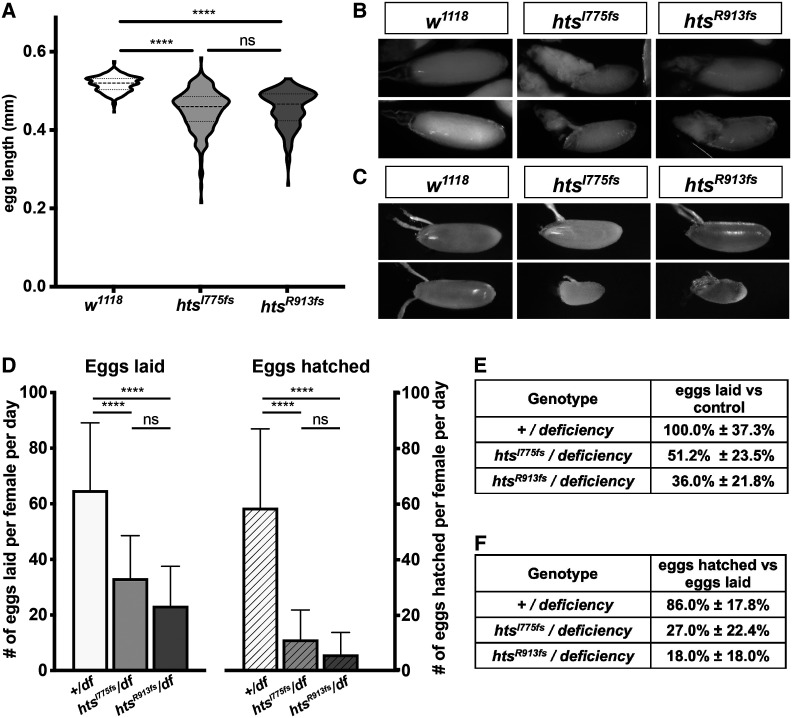
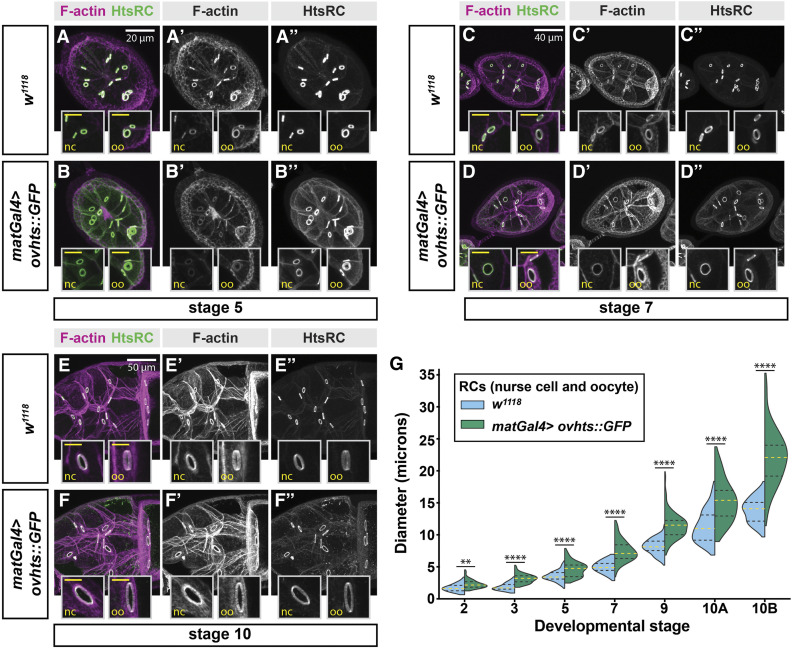
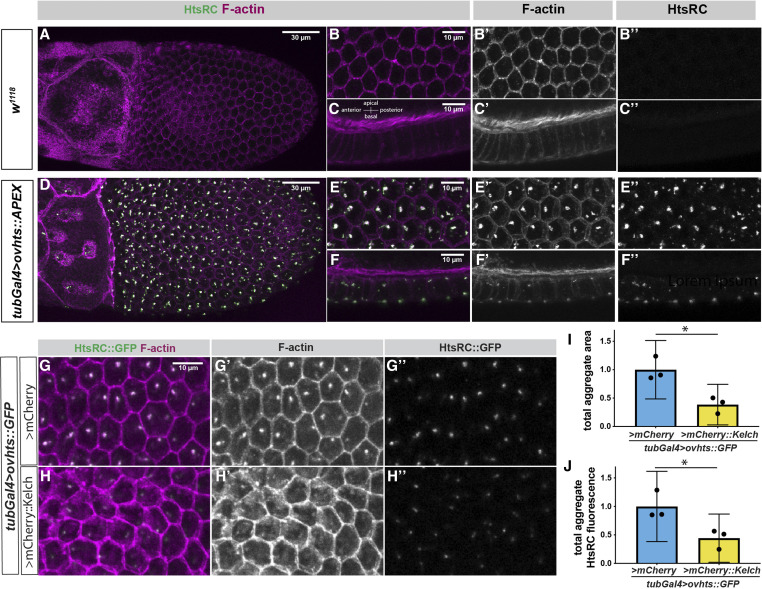
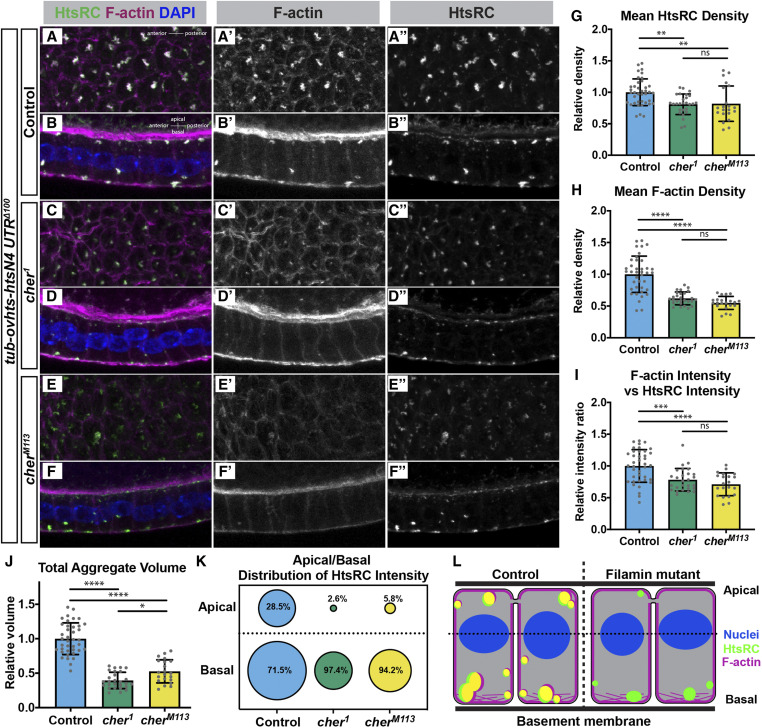
Ring canals in the female germline of Drosophila melanogaster are supported by a robust filamentous actin (F-actin) cytoskeleton, setting them apart from ring canals in other species and tissues. Previous work has identified components required for the expansion of the ring canal actin cytoskeleton, but has not identified the proteins responsible for F-actin recruitment or accumulation. Using a combination of CRISPR-Cas9 mediated mutagenesis and UAS-Gal4 overexpression, we show that HtsRC-a component specific to female germline ring canals-is both necessary and sufficient to drive F-actin accumulation. Absence of HtsRC in the germline resulted in ring canals lacking inner rim F-actin, while overexpression of HtsRC led to larger ring canals. HtsRC functions in combination with Filamin to recruit F-actin to ectopic actin structures in somatic follicle cells. Finally, we present findings that indicate that HtsRC expression and robust female germline ring canal expansion are important for high fecundity in fruit flies but dispensable for their fertility-a result that is consistent with our understanding of HtsRC as a newly evolved gene specific to female germline ring canals.

Keywords: Drosophila oogenesis; actin cytoskeleton; hu li tai shao; intrinsically disordered protein; ring canal.


Figures

Figure 1
Figure 1
HtsRC is produced from the HtsRC exon after cleavage of the Ovhts polyprotein. (A) Diagram of the hts locus, showing a subset of spliced exons (top) and the structure of three transcripts containing alternatively spliced terminal exons. Untranslated regions and exons are color coded as follows: 5′ UTRs (gray boxes), 3′ UTRs (gray arrows), conserved Adducin exons (magenta boxes), and the HtsRC exon (green box). The black exon corresponds to a testis-specific splice variant not shown. Three hts isoforms with unique terminal exon groups can be detected in the ovary: ovhts, Adducin, and shAdd. Distances are to scale, except where indicated by hash marks. (B) ovhts mRNA produces the Ovhts polyprotein, which is cleaved into HtsF and HtsRC. Exons are color coded as in (A). (C) A germarium expressing transgenic Ovhts::Venus polyprotein. Ovhts tagged at the C-terminus with Venus produces HtsRC::Venus and untagged HtsF following cleavage. HtsF is labeled with a monoclonal antibody (1B1), which also labels Add and shAdd in the fusome. Insets show 1B1 labeling and HtsRC::Venus at the time point where the fusome is dissolving and ring canals first recruit HtsRC. (D) Summary of mutations in the HtsRC exon induced by CRISPR-Cas9 mediated NHEJ. htsI775fs is a 2 bp deletion resulting in a frameshift and 62 novel amino acid residues followed by a stop codon. htsR913fs is a 559 bp deletion followed by a frameshift resulting in 10 novel residues and a stop codon. (E) Amino acid sequence of the Ovhts polyprotein, showing the start of the HtsRC exon and the cleavage site identified by mass spectrometry experiments at residue 693 (residue 35 of the HtsRC exon). Black outline indicates the identified semitryptic peptide. (F) Prediction of intrinsically disordered regions within the Ovhts polyprotein using the SPOT-Disorder-Single application (Hanson et al. 2018). Vertical black line indicates the polyprotein cleavage site described in (E).
Figure 2
Figure 2
htsRC-specific mutants lose F-actin at ring canals but not at cytoplasmic actin bundles. Maximum intensity projections of wild-type (w1118) and htsRC-specific mutant (htsI775 fs) egg chambers at (A and B) stage 7, (C and D) stage 10A, and (E–H) stage 10B. (A–D) Egg chambers are stained with TRITC-Phalloidin and labeled with Filamin and HtsRC antibodies. The left column shows a merge of F-actin (magenta) and Filamin (green) channels, where white indicates overlap between channels. Insets contain a representative nurse cell ring canal from the same genotype and stage, although not the same egg chamber. Bar, 30 µm, inset Bar, 2 µm. (E–H) Egg chambers from wild-type and htsRC-specific mutant flies expressing Filamin::GFP. Size differences between these egg chambers represent the normal variation among stage 10B egg chambers. (E and G) Egg chambers are labeled with TRITC-Phalloidin (magenta). Bar, 30 µm. (F and H) Nurse cells marked by white boxes in (E) and (G) are magnified to show labeling of the cytoplasmic actin bundles. Bar, 10 µm.
Figure 3
Figure 3
Nurse cell ring canals are smaller and less stable in HtsRC mutants. Representative ring canals and quantification of ring canal diameter for ring canals connecting pairs of nurse cells (A, C, and E) or connecting nurse cells to the oocyte (B and D). (A and B) Representative ring canals labeled with Filamin antibody from w1118 (top) and htsI775 fs (bottom) ovaries. (C and D) Violin plots showing ring canal diameter across stages 2–10B of oogenesis in w1118 (blue) vs. htsI775 (yellow). Two or more egg chambers were sampled at each stage; Table S1 contains additional information about the means and sample numbers for the data displayed in this figure panel. Significance was determined by Welch’s t-test. Significance thresholds: **P < 0.01; ****P < 0.0001; ns, not significant. (E) Representative examples of collapsed nurse cell ring canals in htsRC-specific mutants (bottom) compared with a wild-type w1118 ring canal (top) with a clear lumen. Graph shows pixel intensity vs. position along a 3 μm horizontal linescan through the center of the stage three ring canals highlighted. (F) Number of collapsed nurse cell ring canals (no visible lumen; yellow) compared to nurse cell ring canals with a clear open lumen (black). Each egg chamber contains 11 nurse cell ring canals. n = 3 egg chambers per stage. Bars, 2 µm.
Figure 4
Figure 4
Loss of HtsRC protein impacts egg length and fecundity. (A) Violin plots showing distribution of egg length for two unique htsRC-specific mutants or w1118. n > 200 per genotype. Significance was determined using Tukey’s multiple comparison test. (B) Representative images from late stage egg chambers showing residual nurse cell cytoplasm. (C) Representative images showing the range of sizes among laid eggs. (D) Graph indicating number of eggs laid per day per female (solid bars) compared with the number of eggs hatched per female (patterned bars) for flies carrying either a wild-type allele or one of two independent htsRC-specific mutations over the Df(2R)BSC26 deficiency. Error bars indicate SD. n > 11 per genotype. Significance was determined using Tukey’s multiple comparison test. (E) Egg laying rates with SD as a percentage of egg laying in the wild-type control. (F) Egg hatching as a percentage of the number of eggs laid for each genotype, ± SD. Significance thresholds: ****P < 0.0001; ns, not significant.
Figure 5
Figure 5
Overexpression of ovhts results in larger ring canals. (A–F) Fluorescence micrographs of F-actin staining and HtsRC antibody labeling in egg chambers throughout oogenesis show that maternal alpha tubulin-GAL4 (matGal4)-driven UASH-ovhts::GFP leads to the formation of large ring canals, compared to w1118 control. Insets contain higher-resolution micrographs of nurse cell and oocyte ring canals from the same egg chamber. Inset scale bars are 10 μm. (G) Quantification of ring canal diameter throughout development, visualized by violin plots. Refer to Table S1 for information about the means and sample numbers for the data in this figure panel. Yellow dotted lines indicate median ring canal diameter, and black dotted lines represent the upper and lower quartiles. Welch’s t-test was performed between w1118 control and matGal4>ovhts::GFP ring canal diameters at each stage; Significance thresholds: **P < 0.01; ****P < 0.0001.
Figure 6
Figure 6
Ectopic HtsRC expression drives the formation of F-actin aggregates. (A–F) Stage 10B egg chambers focusing on the somatic follicle cell layer surrounding the oocyte either from the basal surface (A, B, D, and E) or from the side with the basal side at the bottom and the apical side and germline at the top (C and F). (A–C) Wild-type (w1118) control egg chamber labeled with Phalloidin and HtsRC antibody. All images shown were taken from the same egg chamber. (D–F) Ectopic expression of UASh-ovhts::APEX::V5 driven with the tubulin-Gal4 (tubGal4) driver. All images are taken from the same egg chamber. (G–H) tubulin-Gal4 driving UASh-ovhts::GFP along with either UASp-mCherry::kelch or a UASp-mCherry control. (I) Total area occupied by foci in a Z-projection the follicle cells, measured by HtsRC::GFP fluorescence. (J) Total HtsRC::GFP fluorescence contained within aggregates in control or UASp-mCherry::kelch overexpression. (I and J) Student’s t-tests were used to determine significance. Significance thresholds: *P < 0.05; **P < 0.01; ***P < 0.001; ****P < 0.0001; ns, not significant.
Figure 7
Figure 7
Filamin is important for F-actin recruitment to HtsRC aggregates. Ectopic HtsRC protein was driven from the tubulin-ovhts-N4Δ100 transgene in somatic follicle cells in either a wild-type background (A and B) or two independent cheerio mutant backgrounds (C–F). (A, C, and E) Z-projections from representative egg chambers showing the follicle cells from the basal surface. (B, D, and F) Z-projections of follicle cells showing the apical/basal distribution of aggregates with the apical side facing the top. Image pairs come from the same egg chamber. (G and H) Density calculated as HtsRC (G) or F-actin (H) intensity per μm3, averaged across all aggregates within a uniform region. All mean values were divided by the mean of the controls to obtain a relative density. (I) F-actin intensity per unit HtsRC intensity, relative to the mean of the controls. (J) Total volume occupied by aggregates normalized to the mean total aggregate volume for the controls. (G–J) All results were significant by both ANOVA and pairwise t-tests with P values adjusted for multiple comparisons, with pairwise t-tests displayed on graphs. Significance thresholds: *P < 0.05; **P < 0.01; ***P < 0.001, ****P < 0.0001. (K) Distribution of total HtsRC intensity within aggregates relative to the center of the nuclei (dotted line in L). Percentages indicate the distribution of HtsRC as a fraction of total HtsRC intensity within that genotype. The areas of the circles are scaled to indicate relative intensity between genotypes and between regions. (L) Model of HtsRC/F-actin aggregate formation in control (left) compared to cheerio mutants (right). HtsRC (green) and F-actin (magenta) colocalize (yellow) in aggregates at both the apical and basal ends of the cells in controls, but HtsRC does not recruit F-actin robustly in mutants and primarily forms aggregates at the basal end.

References

    1. Andrianantoandro E., and Pollard T. D., 2006. Mechanism of actin filament turnover by severing and nucleation at different concentrations of ADF/cofilin. Mol. Cell 24: 13–23. 10.1016/j.molcel.2006.08.006 - DOI - PubMed
    1. Cant K., and Cooley L., 1996. Single amino acid mutations in Drosophila fascin disrupt actin bundling function in vivo. Genetics 143: 249–258. - PMC - PubMed
    1. Cant K., Knowles B. A., Mooseker M. S., and Cooley L., 1994. Drosophila singed, a fascin homolog, is required for actin bundle formation during oogenesis and bristle extension. J. Cell Biol. 125: 369–380. 10.1083/jcb.125.2.369 - DOI - PMC - PubMed
    1. Carlier M. -F., Husson C., Renault L., and Didry D., 2011. Control of actin assembly by the WH2 domains and their multifunctional tandem repeats in Spire and Cordon-Bleu. Int. Rev. Cell Mol. Biol. 290: 55–85. 10.1016/B978-0-12-386037-8.00005-3 - DOI - PubMed
    1. Carlier M.-F., and Pantaloni D., 1997. Control of actin dynamics in cell motility. J. Mol. Bio. 269: 459–467. 10.1006/jmbi.1997.1062 - DOI - PubMed

Publication types

LinkOut - more resources