. 2020 Nov 15;26(22):5943-5951.
doi: 10.1158/1078-0432.CCR-20-1804. Epub 2020 Sep 3.

Comprehensive Genomic Profiling of Gastroenteropancreatic Neuroendocrine Neoplasms (GEP-NENs)

Affiliations

Comprehensive Genomic Profiling of Gastroenteropancreatic Neuroendocrine Neoplasms (GEP-NENs)

Alberto Puccini et al. Clin Cancer Res. .

Abstract

Purpose: GEP-NENs are rare malignancies with increasing incidence. Their molecular characteristics are still undefined. We explored the underlying biology of GEP-NENs and the differences between gastrointestinal (GI) and pancreatic (PNEN), high-grade (HG), and low-grade (LG) tumors.

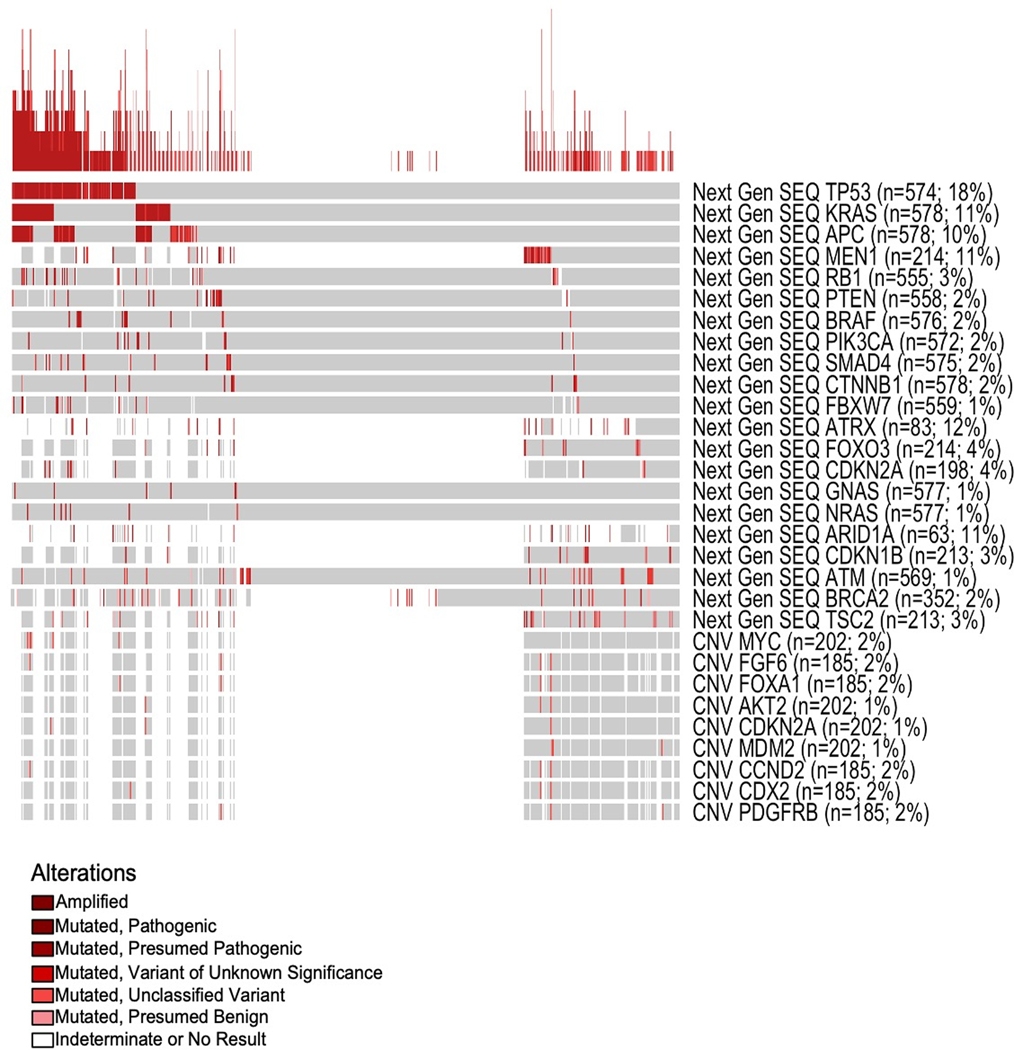
Experimental design: GEP-NENs were analyzed using next-generation sequencing (NGS; MiSeq on 47 genes, NextSeq on 592 genes), IHC, and in situ hybridization. Tumor mutational burden (TMB) was calculated on the basis of somatic nonsynonymous missense mutations, and microsatellite instability (MSI) was evaluated by NGS of known MSI loci.

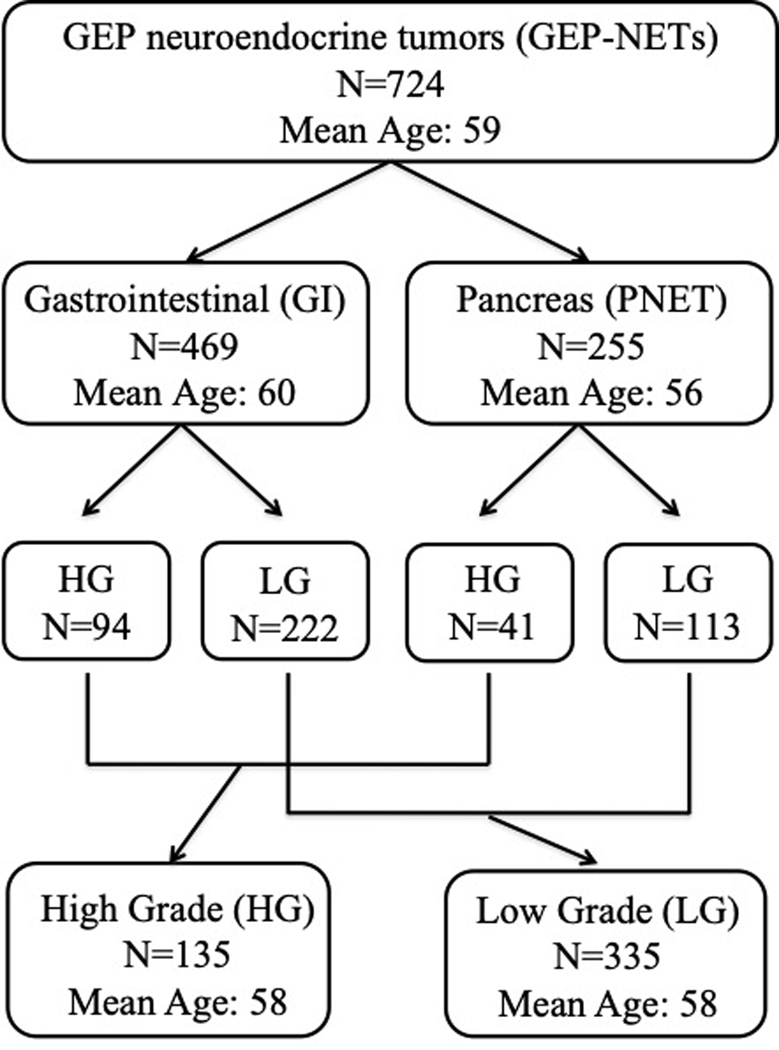
Results: In total, 724 GEP-NENs were examined: GI (N = 469), PNEN (N = 255), HG (N = 135), and LG (N = 335). Forty-nine percent were female, and median age was 59. Among LG tumors, the most frequently mutated genes were ATRX (13%), ARID1A (10%), and MEN1 (10%). HG tumors showed TP53 (51%), KRAS (30%), APC (27%), and ARID1A (23%). Immune-related biomarkers yielded a lower prevalence in LG tumors compared with HG [MSI-H 0% vs. 4% (P = 0.04), PD-L1 overexpression 1% vs. 6% (P = 0.03), TMB-high 1% vs. 7% (P = 0.05)]. Compared with LG, HG NENs showed a higher mutation rate in BRAF (5.4% vs. 0%, P < 0.0001), KRAS (29.4% vs. 2.6%, P < 0.0001), and PI3KCA (7% vs. 0.3%, P < 0.0001). When compared with GI, PNEN carried higher frequency of MEN1 (25.9% vs. 0.0%, P < 0.0001), FOXO3 (8.6% vs. 0.8%, P = 0.005), ATRX (20.6% vs. 2.0%, P = 0.007), and TSC2 (6.3% vs. 0.0%, P = 0.007), but lower frequency of mutations in APC (1.0% vs. 13.8%, P < 0.0001).

Conclusions: Significant molecular differences were observed in GEP-NENs by tumor location and grade, indicating differences in carcinogenic pathways and biology.


Conflict of interest statement

Conflict of interests:

Drs. K. Poorman, J. Xiu and W. M. Korn are employed by Caris Life Sciences. Dr. J. L. Marshall is a consultant for Caris Life Sciences. Drs. A. F. Shields, A. Seeber and R. M. Goldberg received research and travel support from Caris Life Sciences. Drs. M. E. Salem, and H-J. Lenz received travel support from Caris Life Sciences. Drs. A. Puccini, D. Soldato, M.D. Berger, R. Tokunaga, M. Naseem, F. Battaglin, A. Barzi, S. Iqbal, W. Zhang, S. Soni, J.J. Hwang and P.A. Philip and S. Sciallero declare no potential conflicts of interest.

Figures

Figure 1 –
Figure 1 –
Patient Demographics. NEN from GI (N = 469), PNEN (N = 255), HG (N = 135), and LG (N = 335). Female to male ratio was 49%/51% and the median age was 59.
Figure 2.
Figure 2.. Oncoprint
Comprehensive molecular profile of 724 GEP-NENs. Overall, the most frequently mutated genes were TP53 (18%), ATRX (12%), KRAS (11%), MEN1 (11%), ARID1A (11%), and APC (10%). Gene amplification events, as determined by NGS, were rare across the cohort. The most frequently amplified genes are MYC (2%), FGF6 (2%), CCND2 (2%), and FOXA1 (2%). Each column is a single patient; gray boxes are those in which no alteration was detected. Samples were arranged by those that harbored a mutation in the genes listed as rows top to bottom (those with TP53 mutation show up on left, then by KRAS mt, then by APC, etc). The stacked graph at the top is a representation of the number of alterations that case had (the higher the line the more alterations). Mutation frequencies were determined on a per gene level excluding cases from that analysis where a particular gene was determined to be indeterminate. The variation of sample size per gene comes from the fact that not all genes within a single case are evaluable.
Figure 3
Figure 3. Molecular differences between PNEN and GI-NEN.
Compared to GI, PNEN carried significantly higher frequency of MEN1 (25.9% vs 0.0%), FOXO3 (8.6% vs 0.8%), ATRX (20.6% vs 2.0%), and TSC2 (6.3% vs 0.0%), but lower frequency of mutations in APC (1.0% vs 13.8%). PNEN had a significantly higher expression of PR (38.9% vs 3.7%), but interestingly, GI-NEN had higher expression levels of ER (12.5% vs 2.4%).
Figure 4.
Figure 4.. Differences in LG PNET and LG GI-NET
Molecular differences between LG PNET and LG GI-NET. Compared to LG GI-NET, LG PNET carried significantly higher frequency of MEN1 (24.3% vs 0.0%), ATRX (33.3% vs 0.0%), and FOXO3 (12.2% vs 0.0%). LG GI-NET had a higher mutation rate in APC (1.6% vs 0.0%) and CDKNB1 (4.9% vs 2.5%), although neither was significant. Molecular profiles of LG tumors were similar to those of the entire cohort for each primary location.
Figure 5
Figure 5
Figure 5a – Molecular differences between HG and LG GEP-NEN. Among LG tumors, the most frequently mutated genes were ATRX (13%), ARID1A (10%) and MEN1 (10%). Among HG, TP53 (51%), KRAS (30%), APC (27%), ARID1A (23%) and RB1 (11%). Compared to LG, HG NENs showed a higher mutation rate in BRAF (5.4% vs 0%), KRAS (29.4% v 2.6%) and PI3KCA (7% vs 0.3%), among others. 5b – Differences in immune markers between HG vs LG GEP-NEN. Immune-related biomarkers showed lower prevalence in LG tumors compared to HG: lower mean TML (5.1 mut/MB vs 9.5, P < .0001), MSI-H 0% vs 4% (P = .04), PD-L1 expression 1% vs 6% (P = .03).
Figure 5
Figure 5
Figure 5a – Molecular differences between HG and LG GEP-NEN. Among LG tumors, the most frequently mutated genes were ATRX (13%), ARID1A (10%) and MEN1 (10%). Among HG, TP53 (51%), KRAS (30%), APC (27%), ARID1A (23%) and RB1 (11%). Compared to LG, HG NENs showed a higher mutation rate in BRAF (5.4% vs 0%), KRAS (29.4% v 2.6%) and PI3KCA (7% vs 0.3%), among others. 5b – Differences in immune markers between HG vs LG GEP-NEN. Immune-related biomarkers showed lower prevalence in LG tumors compared to HG: lower mean TML (5.1 mut/MB vs 9.5, P < .0001), MSI-H 0% vs 4% (P = .04), PD-L1 expression 1% vs 6% (P = .03).

References

    1. Rindi G, Klimstra DS, Abedi-Ardekani B et al. A common classification framework for neuroendocrine neoplasms: an International Agency for Research on Cancer (IARC) and World Health Organization (WHO) expert consensus proposal. Mod Pathol 2018; 31: 1770–1786. - PMC - PubMed
    1. Lewis MA, Yao JC. Molecular pathology and genetics of gastrointestinal neuroendocrine tumours. Curr Opin Endocrinol Diabetes Obes 2014; 21: 22–27. - PubMed
    1. Bijlsma MF, Sadanandam A, Tan P, Vermeulen L. Molecular subtypes in cancers of the gastrointestinal tract. Nat Rev Gastroenterol Hepatol 2017; 14: 333–342. - PubMed
    1. El-Deiry WS, Goldberg RM, Lenz HJ et al. The current state of molecular testing in the treatment of patients with solid tumors, 2019. CA Cancer J Clin 2019; 69: 305–343. - PMC - PubMed
    1. Girardi DM, Silva ACB, Rego JFM et al. Unraveling molecular pathways of poorly differentiated neuroendocrine carcinomas of the gastroenteropancreatic system: A systematic review. Cancer Treat Rev 2017; 56: 28–35. - PubMed

Publication types

MeSH terms

Supplementary concepts