. 2020 Nov;26(11):1694-1700.
doi: 10.1038/s41591-020-1070-6. Epub 2020 Sep 3.

Ad26 vaccine protects against SARS-CoV-2 severe clinical disease in hamsters

Affiliations

Ad26 vaccine protects against SARS-CoV-2 severe clinical disease in hamsters

Lisa H Tostanoski et al. Nat Med. 2020 Nov.

Abstract

Coronavirus disease 2019 (COVID-19) in humans is often a clinically mild illness, but some individuals develop severe pneumonia, respiratory failure and death1-4. Studies of severe acute respiratory syndrome coronavirus 2 (SARS-CoV-2) infection in hamsters5-7 and nonhuman primates8-10 have generally reported mild clinical disease, and preclinical SARS-CoV-2 vaccine studies have demonstrated reduction of viral replication in the upper and lower respiratory tracts in nonhuman primates11-13. Here we show that high-dose intranasal SARS-CoV-2 infection in hamsters results in severe clinical disease, including high levels of virus replication in tissues, extensive pneumonia, weight loss and mortality in a subset of animals. A single immunization with an adenovirus serotype 26 vector-based vaccine expressing a stabilized SARS-CoV-2 spike protein elicited binding and neutralizing antibody responses and protected against SARS-CoV-2-induced weight loss, pneumonia and mortality. These data demonstrate vaccine protection against SARS-CoV-2 clinical disease. This model should prove useful for preclinical studies of SARS-CoV-2 vaccines, therapeutics and pathogenesis.


Conflict of interest statement

D.H.B., F.W., J.C., H.S. and R.Z. are co-inventors on related vaccine patents. F.W., J.C., H.S. and R.Z. are employees of Janssen Vaccines & Prevention BV and hold stock in Johnson & Johnson.

Figures

Fig. 1
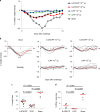
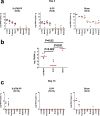
Fig. 1. Clinical disease after SARS-CoV-2 infection in hamsters.
Syrian golden hamsters (10–12 weeks old; male and female; n = 20) were infected with 5 × 10⁴ TCID50 (low-dose; n = 4) or 5 × 10⁵ TCID50 (high-dose; n = 16) of SARS-CoV-2 by the intranasal route. a, Median percent weight change after challenge. The numbers reflect the number of animals at each time point. In the high-dose group, four animals were necropsied on day 2, four animals were necropsied on day 4, four animals met euthanization criteria on day 6 and two animals met euthanization criteria on day 7. b, Percent weight change after challenge in individual animals. Median weight loss is depicted in red. Asterisks indicate mortality. Gray lines indicate animals with scheduled necropsies on day 2 and day 4. c, Tissue viral loads as measured by log10 RNA copies per gram of tissue (limit of quantification, 100 copies per gram) in the scheduled necropsies at day 2 and day 4 and in 2–5 of 6 animals that met euthanization criteria on days 6–7. Extended tissues were not harvested on day 6.
Fig. 2
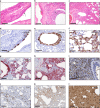
Fig. 2. Pathologic features of high-dose SARS-CoV-2 infection in hamsters.
a, Necrosis and inflammation (arrow) in nasal turbinate, H&E (day 2). b, Bronchiolar epithelial necrosis with cellular debris and degenerative neutrophils in lumen (arrow) and transmigration of inflammatory cells in vessel wall (arrowhead), H&E (day 2). c, Interstitial pneumonia, hemorrhage and consolidation of lung parenchyma, H&E (day 2). d, Nasal turbinate epithelium shows strong positivity for SARS-CoV-N by IHC (day 2). e, Bronchiolar epithelium and luminal cellular debris show strong positivity for SARS-CoV-N by IHC (day 2). f, Pneumocytes and alveolar septa show multifocal strong positivity for SARS-CoV-N by IHC (day 2). g, Diffuse vRNA staining by RNAscope within pulmonary interstitium (arrow, interstitial pneumonia) and within bronchiolar epithelium (arrowhead; day 2). h, Diffuse vRNA staining by RNAscope within pulmonary interstitium (day 4). i, Iba-1 IHC (macrophages) within pulmonary interstitium (day 7). j, CD3+ T lymphocytes within pulmonary interstitium, CD3 IHC (day 4). k, MPO IHC indicating presence of interstitial neutrophils (day 7). l, Interferon inducible gene MX1 IHC shows strong and diffuse positivity throughout the lung (day 4). Representative sections are shown. Experiments were repeated at least three times with similar results. Scale bars, 20 μm (b, d); 50 μm (a, e, f); and 100 μm (c, gl). H&E, hematoxylin and eosin.
Fig. 3
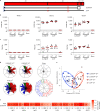
Fig. 3. Humoral immune responses in vaccinated hamsters.
a, SARS-CoV-2 S immunogens with 1) deletion of the transmembrane region and cytoplasmic tail reflecting the soluble ectodomain with a foldon trimerization domain (S.dTM.PP) or 2) full-length S (S.PP), both with mutation of the furin cleavage site and two proline stabilizing mutations. The red X depicts furin cleavage site mutation; red vertical lines depict proline mutations; and the open square depicts the foldon trimerization domain. S1 and S2 represent the first and second domain of the S protein; TM depicts the transmembrane region; and CT depicts the cytoplasmic domain. Hamsters were vaccinated with 1010 vp or 109 vp of Ad26-S.dTM.PP or Ad26-S.PP or sham controls (n = 10 per group). Humoral immune responses were assessed at weeks 0, 2 and 4 by b) RBD-specific binding antibody ELISA and c) pseudovirus neutralization assays. Red bars reflect median responses. Dotted lines reflect assay limit of quantitation. d, S- and RBD-specific IgG subclass, FcγR and ADCD responses at week 4 are shown as radar plots. The size and color intensity of the wedges indicate the median of the feature for the corresponding group (antibody subclass, red; FcγR binding, blue; ADCD, green). e, PCA plot showing the multivariate antibody profiles across vaccination groups. Each dot represents an animal; the color of the dot denotes the group; and the ellipses show the distribution of the groups as 70% confidence levels assuming a multivariate normal distribution. f, The heat map shows the differences in the means of z-scored features between vaccine groups S.PP and S.dTM.PP. The two groups were compared by two-sided Mann–Whitney tests, and stars indicate the Benjamini–Hochberg-corrected q values (*q < 0.05, **q < 0.01 and ***q < 0.001).
Fig. 4
Fig. 4. Clinical disease in hamsters after high-dose SARS-CoV-2 challenge.
a, Median percent weight change after challenge. b, Percent weight change after challenge in individual animals. Median weight loss is depicted in red. Asterisks indicate mortality. Gray lines indicate animals with scheduled necropsies on day 4. c, Maximal weight loss in the combined Ad26-S.dTM.PP (n = 14), Ad26-S.PP (n = 14) and sham control (n = 7) groups, excluding the animals that were necropsied on day 4. P values indicate two-sided Mann–Whitney tests. n reflects all animals that were followed for weight loss and were not necropsied on day 4. d, Quantification of percent lung area positive for anti-sense vRNA in tissue sections from Ad26-S.dTM.PP and Ad26-S.PP vaccinated hamsters as compared to control hamsters on day 4 after challenge. P values represent two-sided Mann–Whitney tests.
Extended Data Fig. 1
Extended Data Fig. 1. Longitudinal quantitative image analysis of viral replication and associated inflammation in lungs.
a, Percent lung area positive for anti-sense SARS-CoV-2 viral RNA (vRNA) by RNAscope ISH. b, Percentage of total cells positive for SARS-CoV-N protein (nuclear or cytoplasmic) by IHC. c, Iba-1 positive cells per unit area by IHC. d, CD3 positive cells per unit area. e, MPO positive cells per unit area. f, Percentage of MX1 positive lung tissue as a proportion of total lung area. ISH, in situ hybridization; IHC, immunohistochemistry; SARS-N, SARS-CoV nucleocapsid; MPO, myeloperoxidase; MX1, myxovirus protein 1 (a type 1 interferon inducible gene). Each dot represents one animal.
Extended Data Fig. 2
Extended Data Fig. 2. Lung viral dynamics and ACE2 receptor expression patterns.
Hamsters were necropsied before (SARS-CoV-2 Negative) or after high-dose SARS-CoV-2 challenge on day 2 (D2), day 4 (D4), day 7 (D7), and day 14 (D14) following challenge. Serial sections of lung tissue were stained for vRNA anti-sense RNAscope a-e, for vRNA sense RNAscope f-j, and ACE2 IHC k-o. Anti-sense RNAscope used a sense probe; sense RNAscope used an anti-sense probe. IHC, immunohistochemistry. Representative sections are shown. Experiments were repeated at least 3 times with similar results. Scale bars = 100 μm.
Extended Data Fig. 3
Extended Data Fig. 3. Extrapulmonary pathology.
a, Anti-sense SARS-CoV-2 viral RNA (vRNA) in brainstem on day 2 following challenge. b, Higher magnification showing cytoplasmic vRNA staining in neurons in the absence of inflammation and pathology. c, Anti-sense SARS-CoV-2 vRNA staining in the lamina propria of small intestinal villus on day 2 following challenge. d, Higher magnification showing cytoplasmic and nuclear vRNA staining in an individual mononuclear cell in the absence of inflammation and tissue pathology. e, Anti-sense SARS-CoV-2 vRNA staining within the myocardium and along the epicardial surface of the heart on day 4 following challenge. f, Higher magnification showing staining of inflammatory mononuclear cell infiltrates consistent with focal myocarditis. g, Pulmonary vessel showing endothelialitis day 4 (d4) following challenge. h, Pulmonary vessel showing CD3+ T lymphocyte staining by IHC adhered to endothelium and within vessel wall, d4 following challenge. i, Pulmonary vessel showing Iba-1+ staining by IHC of macrophages along endothelium and perivascularly, d4. j, Pulmonary vessel showing minimal vascular staining for SARS-CoV-N by IHC, d4. k, Heart from (e, f) showing focal lymphocytic myocarditis as confirmed by CD3+ T lymphocyte staining l, of cells by IHC, d4. Representative sections are shown. Experiments were repeated at least 3 times with similar results. Scale bars = 500 μm (a, c, e); 100 μm (b, d, f, g-l).
Extended Data Fig. 4
Extended Data Fig. 4. SARS-CoV-2 in blood mononuclear cells and bone marrow.
a-c, SARS-CoV-2 anti-sense vRNA staining within mononuclear cells within lung thrombus on day 2 following challenge. d, Bone marrow from the nasal turbinate 4 days following challenge showing e, hematopoetic cells (H&E) that show f, positive staining for SARS-CoV-N IHC. vRNA, viral RNA; H&E, hematoxylin and eosin; IHC, immunohistochemistry. Representative sections are shown. Experiments were repeated at least 3 times with similar results. Scale bars = 500 μm (a); 200 μm (d); 100 μm (b, c, e, f).
Extended Data Fig. 5
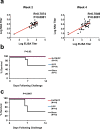
Extended Data Fig. 5. Correlation of antibody titers and survival curves.
a, Correlations of binding ELISA titers and pseudovirus NAb titers at week 2 and week 4. Red lines reflect the best linear fit relationship between these variables. P and R values reflect two-sided Spearman rank-correlation tests. b, Survival curve for the vaccine study. P values indicate two-sided Fisher’s exact tests. N denotes number of animals in each group. c, Combined analysis of the two hamster studies involving all animals that received the 5x10⁵ TCID50 challenge dose and were followed longitudinally. P values indicate two-sided Fisher’s exact tests. N denotes number of animals in each group.
Extended Data Fig. 6
Extended Data Fig. 6. Antibody correlates of clinical protection.
Correlations of a, binding ELISA titers and b, pseudovirus NAb titers at week 2 and week 4 with maximum percent weight loss following challenge. Red lines reflect the best linear fit relationship between these variables. P and R values reflect two-sided Spearman rank-correlation tests.
Extended Data Fig. 7
Extended Data Fig. 7. Tissue viral loads on day 4 and day 14.
Tissue viral loads as measured by a, log10 subgenomic RNA copies per gram tissue (limit of quantification 100 copies/g) and b, log10 infectious virus TCID50 titers per gram tissue (limit of quantification 100 TCID50/g) on day 4 (N=6 reflects both dose groups for each vaccine) and c, log10 subgenomic RNA copies per gram tissue on day 14 (N=14 reflects both dose groups for each vaccine) following challenge. Red lines reflect median values. Each dot represents one animal.
Extended Data Fig. 8
Extended Data Fig. 8. Antibody correlates of protection.
Correlations of a, c, binding ELISA titers and b, d, pseudovirus NAb titers at week 2 and week 4 with log10 RNA copies per gram (a, b) lung and (c, d) nasal turbinate tissue in the animals that were necropsied on day 4. Red lines reflect the best linear fit relationship between these variables. P and R values reflect two-sided Spearman rank-correlation tests.
Extended Data Fig. 9
Extended Data Fig. 9. Antibody correlates of protection and anamnestic responses.
a, The heatmaps show the Spearman rank correlation between antibody features and weight loss (N=35), lung viral loads (N=12), and nasal turbinate viral loads (N=12). N reflects all animals that were followed for weight loss or that were necropsied for lung or nasal turbinate viral loads. Significant correlations are indicated by stars after multiple testing correction using the Benjamini-Hochberg procedure (*q < 0.05, ** q < 0.01, *** q < 0.001). b, ELISA and NAb responses in surviving hamsters on day 14 following SARS-CoV-2 challenge.
Extended Data Fig. 10
Extended Data Fig. 10. Ad26 vaccination protects against SARS-CoV-2 pathology.
Histopathological H&E evaluation of a–e, k–n, sham controls and f–j, o–r, Ad26-S.PP vaccinated hamsters shows in sham controls (a) severe consolidation of lung parenchyma and infiltrates of inflammatory cells, (b) bronchiolar epithelial syncytia and necrosis, (c) SARS-CoV-N positive (IHC) bronchiolar epithelial cells, (d) peribronchiolar CD3+ T lymphocyte infiltrates, and (e) peribronchiolar macrophage infiltrates (Iba-1; IHC), and (f-j) minimal to no corresponding pathology in Ad26-S.PP vaccinated animals. SARS-CoV-2 anti-sense RNAscope ISH in (k), interstitial CD3+ T lymphocytes l) MPO staining by IHC, and MX1 staining by IHC n) in sham controls compared to similar regions in Ad26-S.PP vaccinated animals o-r) on day 4 following challenge. Representative sections are shown. Experiments were repeated at least 3 times with similar results. Scale bars = 20 μm (b, c, g–i); 50 μm (a, d, e, j); 100 μm (f, k–r).

References

    1. Li Q, et al. Early transmission dynamics in Wuhan, China, of novel coronavirus-infected pneumonia. N. Engl. J. Med. 2020;382:1199–1207. doi: 10.1056/NEJMoa2001316. - DOI - PMC - PubMed
    1. Zhu N, et al. A novel coronavirus from patients with pneumonia in China, 2019. N. Engl. J. Med. 2020;382:727–733. doi: 10.1056/NEJMoa2001017. - DOI - PMC - PubMed
    1. Chen N, et al. Epidemiological and clinical characteristics of 99 cases of 2019 novel coronavirus pneumonia in Wuhan, China: a descriptive study. Lancet. 2020;395:507–513. doi: 10.1016/S0140-6736(20)30211-7. - DOI - PMC - PubMed
    1. Huang C, et al. Clinical features of patients infected with 2019 novel coronavirus in Wuhan, China. Lancet. 2020;395:497–506. doi: 10.1016/S0140-6736(20)30183-5. - DOI - PMC - PubMed
    1. Chan, J. F. et al. Simulation of the clinical and pathological manifestations of Coronavirus Disease 2019 (COVID-19) in golden Syrian hamster model: implications for disease pathogenesis and transmissibility. Clin. Infect. Dis.10.1093/cid/ciaa325 (2020). - PMC - PubMed

Publication types

MeSH terms