. 2020 Jul 1;4(3):611-636.
doi: 10.1162/netn_a_00139. eCollection 2020.

Reconfigurations within resonating communities of brain regions following TMS reveal different scales of processing

Affiliations

Reconfigurations within resonating communities of brain regions following TMS reveal different scales of processing

Javier O Garcia et al. Netw Neurosci. .

Abstract

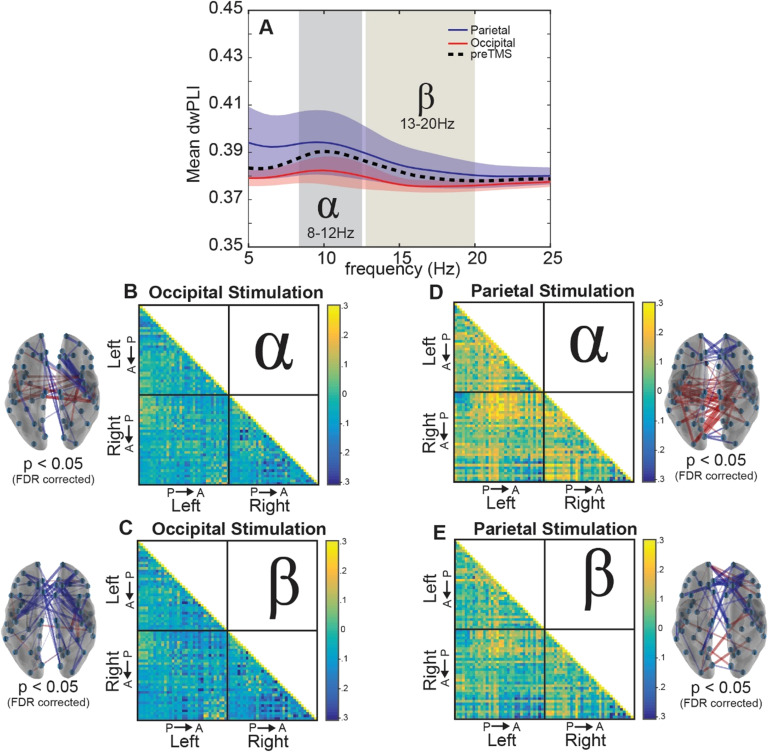
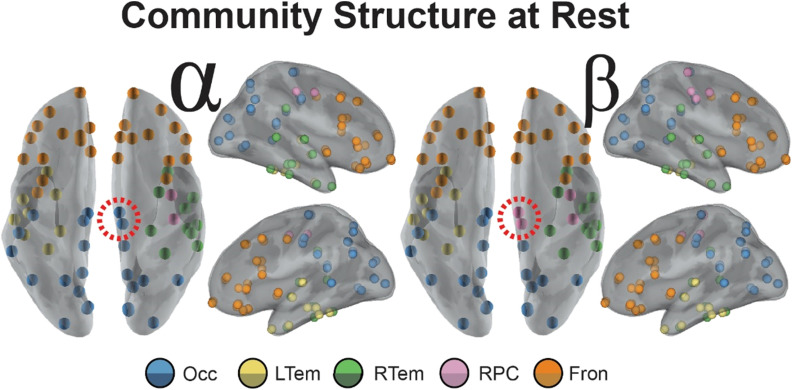
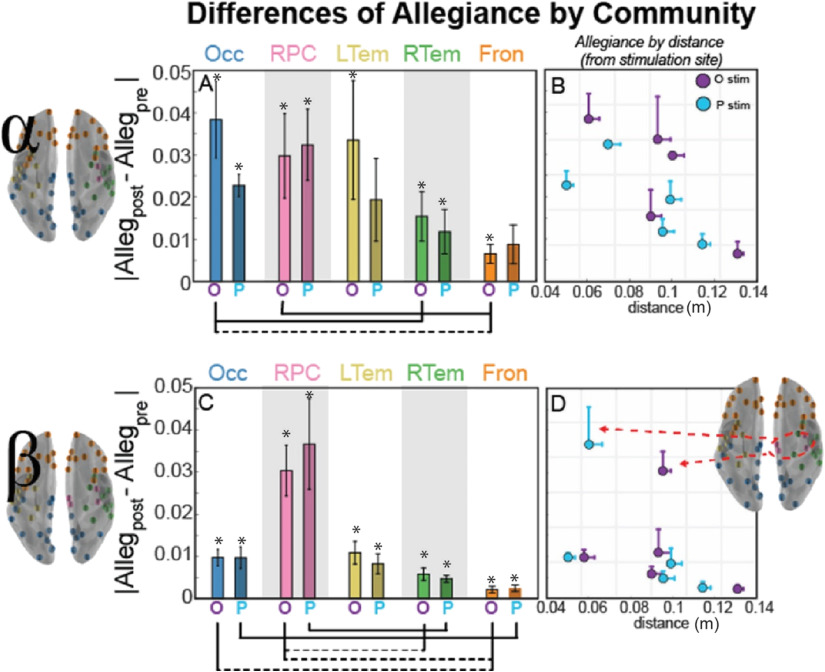
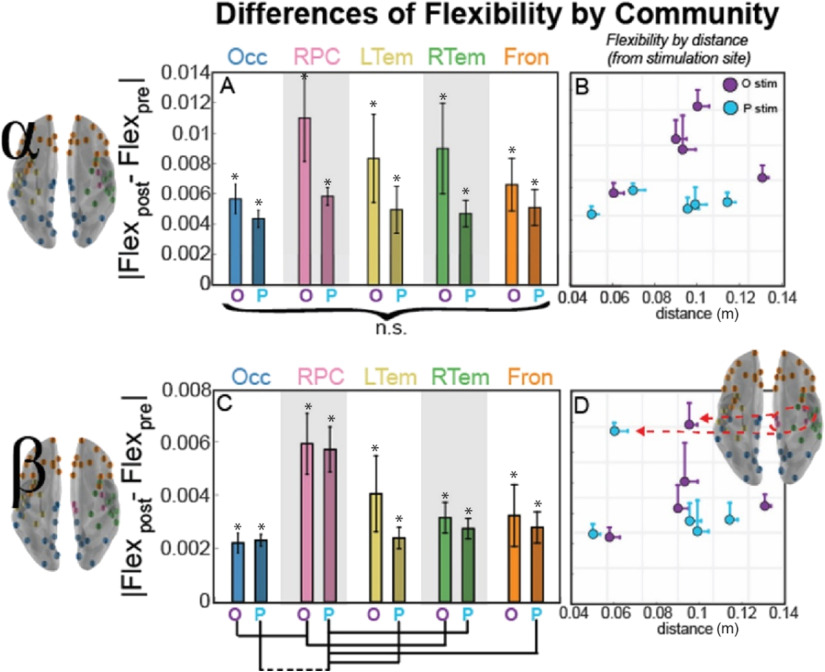
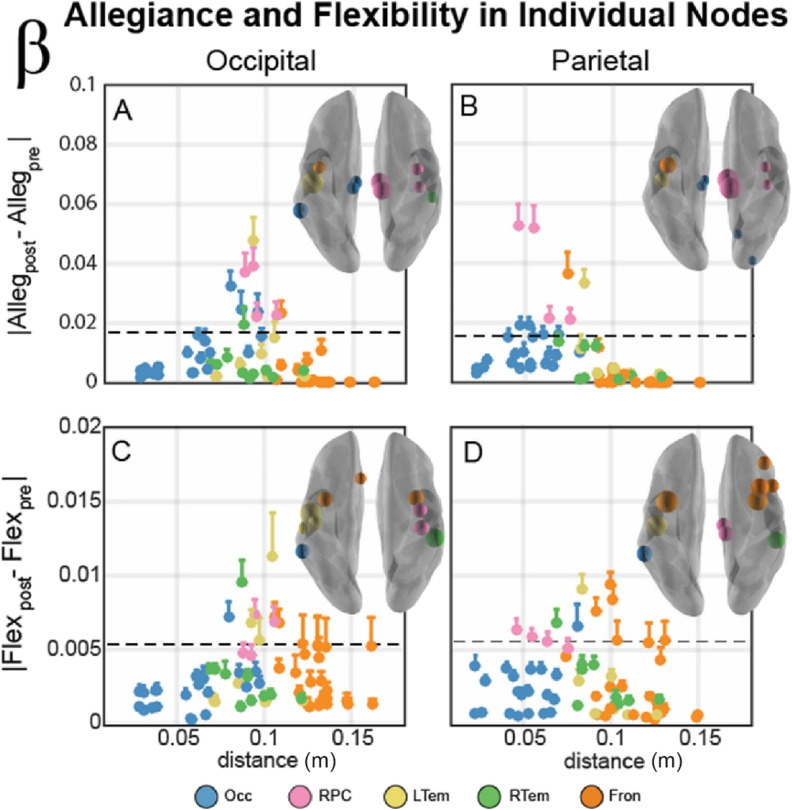
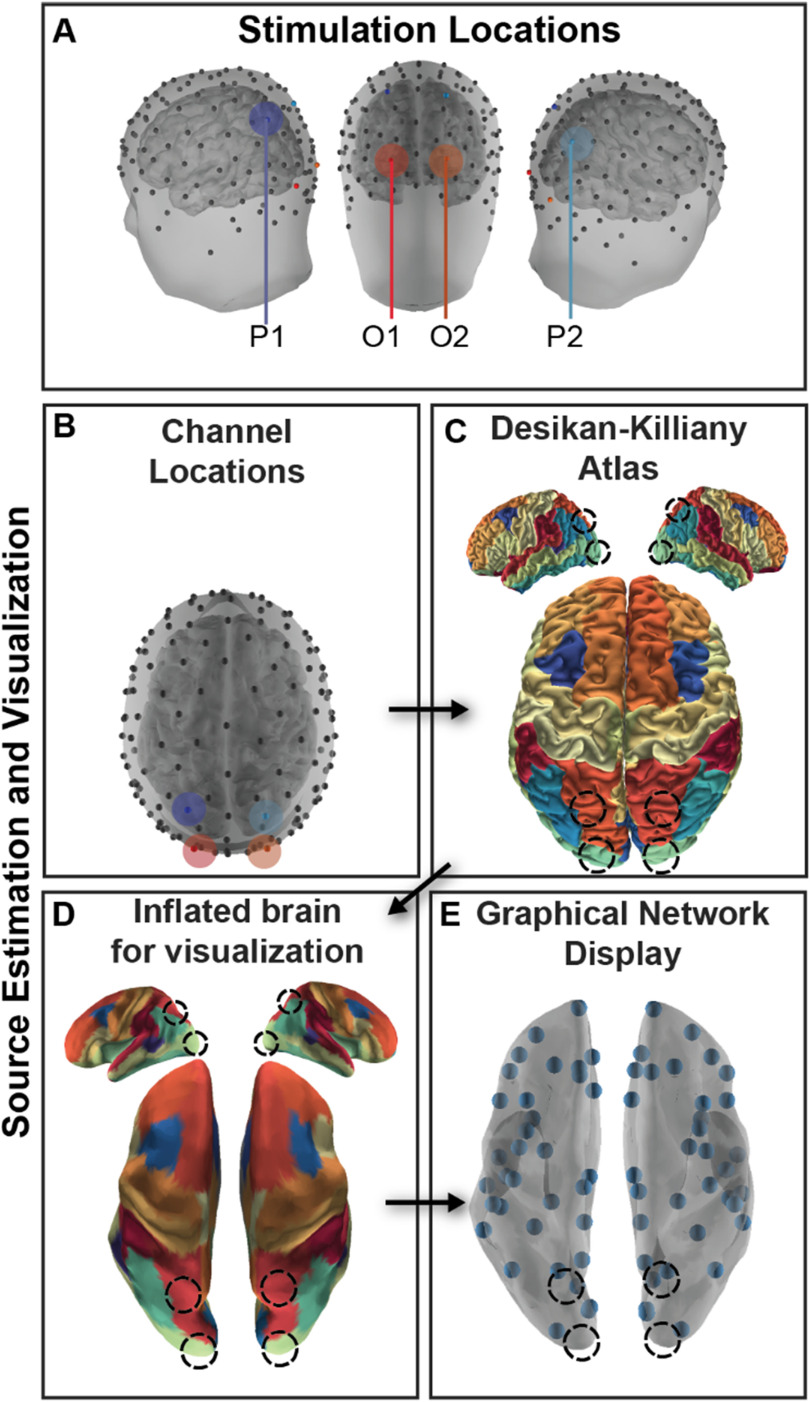
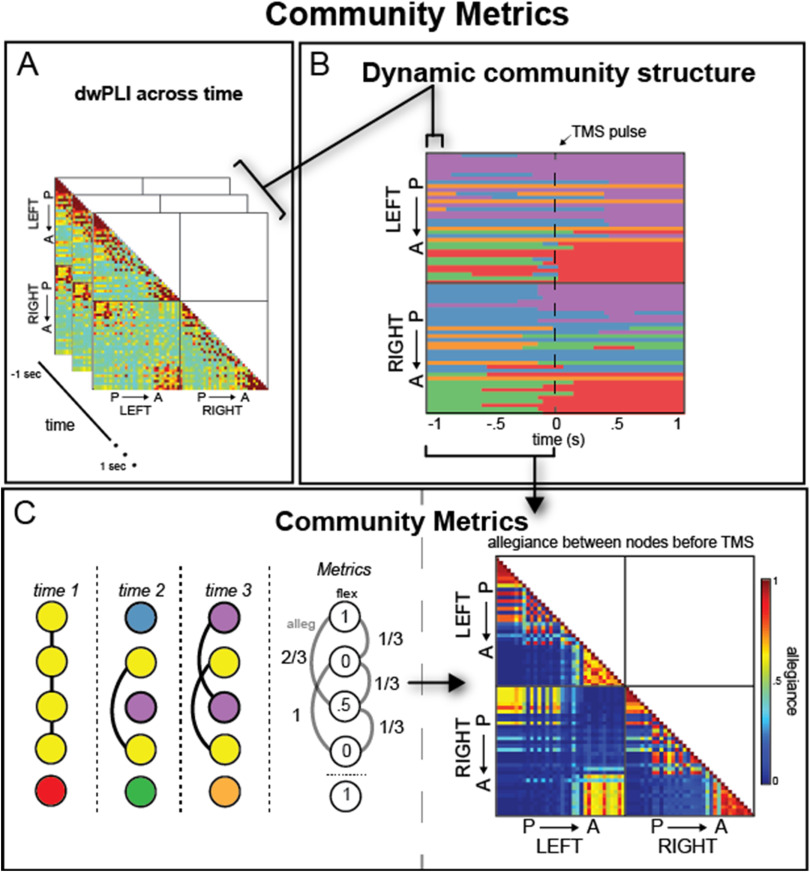
An overarching goal of neuroscience research is to understand how heterogeneous neuronal ensembles cohere into networks of coordinated activity to support cognition. To investigate how local activity harmonizes with global signals, we measured electroencephalography (EEG) while single pulses of transcranial magnetic stimulation (TMS) perturbed occipital and parietal cortices. We estimate the rapid network reconfigurations in dynamic network communities within specific frequency bands of the EEG, and characterize two distinct features of network reconfiguration, flexibility and allegiance, among spatially distributed neural sources following TMS. Using distance from the stimulation site to infer local and global effects, we find that alpha activity (8-12 Hz) reflects concurrent local and global effects on network dynamics. Pairwise allegiance of brain regions to communities on average increased near the stimulation site, whereas TMS-induced changes to flexibility were generally invariant to distance and stimulation site. In contrast, communities within the beta (13-20 Hz) band demonstrated a high level of spatial specificity, particularly within a cluster comprising paracentral areas. Together, these results suggest that focal magnetic neurostimulation to distinct cortical sites can help identify both local and global effects on brain network dynamics, and highlight fundamental differences in the manifestation of network reconfigurations within alpha and beta frequency bands.

Keywords: EEG; Local-global processing; Network allegiance; Network flexibility; Neuroimaging; TMS.


Figures

<b>Figure 1.</b>
Figure 1.
Whole-brain connectivity changes following stimulation. (A) Average dwPLI across the brain between 5 Hz and 25 Hz. (B, C) Debiased weighted phase lag index (dwPLI) differences between the second after TMS (post-TMS) and the second before TMS (pre-TMS) intervals across trials averaged for occipital stimulation within the alpha band (B) and beta band (C). (D, E) Results similar to Panels B and C, but for parietal stimulation. Brain insets display the significant connections (p < 0.05, FDR adjusted) across the brain, providing a topographical illustration of the connectivity matrices where red lines indicate increased connectivity following stimulation and blue lines indicate decreased connectivity following stimulation.
<b>Figure 2.</b>
Figure 2.
Communities derived from the interregional allegiance matrix in the pre-TMS interval for the alpha and beta bands. Inflated mesh visualizations of brain regions colored by community organization. Orbs are plotted at the centroid of the regions of interest. Community organization was found independently for the alpha band (left) and beta band (right) before stimulation with TMS. Dotted lines surrounding nodes near medial portion of the brains indicate the only two nodes unique to the different frequency bands.
<b>Figure 3.</b>
Figure 3.
Community allegiance changes within alpha (top) and beta (bottom) band network as a function of distance from the stimulation site. (A, C) Bar plot of the mean magnitude change (SEM across subjects) from the pre-TMS interval in pairwise allegiance from the stimulation site, with the bar labeled O for occipital stimulation and P for parietal stimulation. For paired t test between communities, dotted lines connecting communities indicate uncorrected significance (p < 0.05), while solid lines indicate significance corrected for multiple comparisons (Bonferroni, p < 0.05). (B, D) Scatter visualization of the mean magnitude allegiance change from the pre-TMS interval shown in Panels A and C, but now plotted as a function of distance from the stimulation site. Error bars indicate SEM across subjects (allegiance) or nodes within the community (distance), and the color of the marker indicates stimulation site (occipital in purple and parietal in blue). Asterisk (*) indicates a significant difference from 0, indicating a change from the pre-TMS interval (p < 0.05, uncorrected). Brain inset for the beta band shows the nodes of the RPC community that are most affected by TMS regardless of stimulation site.
<b>Figure 4.</b>
Figure 4.
Community flexibility changes within alpha (top) and beta (bottom) band network as a function of distance from the stimulation site. (A, C) Bar plot of the mean magnitude change (SEM across subjects) from the pre-TMS interval in flexibility as a function of the distance from the stimulation site, with the bar labeled O for occipital stimulation and P for parietal stimulation. For paired t test between communities, dotted lines connecting communities indicate uncorrected significance (p < 0.05), while solid lines indicate significance corrected for multiple comparisons (Bonferroni, p < 0.05). (B, D) Scatterplot of the mean change in flexibility from the pre-TMS interval shown in Panels A and C, but now plotted as a function of distance from the stimulation site. Error bars indicate SEM across subjects (flexibility) or nodes within the community (distance), and the color of the marker indicates stimulation site (occipital in purple and parietal in blue). Asterisk (*) indicates a significant difference from 0, indicating a change from the pre-TMS interval (p < 0.05, uncorrected). Brain inset shows the nodes of the RPC community that are most affected by TMS regardless of stimulation site.
<b>Figure 5.</b>
Figure 5.
Individual node allegiance (A, B) and flexibility (C, D) changes within the beta band network. (A, B) Individual nodes module allegiance difference (Allegpost − Allegpre) plotted as a function of distance from the stimulation site for occipital (A) and parietal (B) stimulation sites. Color of node describes the community affiliation, and error bars indicate the standard error of the mean. Brain insets display the 85th percentile of module allegiance across all nodes, with nodes scaled by the relative magnitude of this allegiance change. The absolute magnitude of this percentile is also indicated by a horizontal dotted line in each plot. (C, D) Individual nodes flexibility difference (Flexpost − Flexpre) plotted as a function of distance from the stimulation site for occipital (A) and parietal (B) stimulation sites. Color of nodes, error bars, and brain inset display the same properties as above, but in this panel with flexibility rather than allegiance.
<b>Figure 6.</b>
Figure 6.
Experimental design and analysis. (A) Participants received stimulation in symmetric regions in occipital (O1, O2) and parietal (P1, P2) cortex. (B) High-density EEG recorded from 128 channels was submitted to a cLORETA source analysis, and current source density (CSD) was estimated for each vertex of a high-resolution mesh. (C) CSD was then averaged within a parcellation of cortex following the Desikan-Killiany atlas parcellation to estimate regional brain activity. (D) The cortex was inflated for visualization. (E) Each centroid of the region is plotted as a small orb. Stimulation locations marked in each visualization with a shaded region or a dotted line.
<b>Figure 7.</b>
Figure 7.
Overview of analysis method and natural brain architecture. (A) DwPLI was estimated across trials in 40-ms windows across the 2-s epoch, including 1 s before and 1 s after the TMS onset (P: posterior, A: anterior nodes). (B) Dynamic network communities from a sample subject derived from the dwPLI estimate for each window. Each color marks a different community label. (C, left) From Panel B, community metrics were calculated that represent how often a node changes over time (flexibility) or how often each node pair is in the same community over time (allegiance). The cartoon networks show five hypothetical nodes that change communities over time (three time windows shown). Connections are marked as black lines and metrics are given in the final column, showing a range of flexibility and allegiance values. These metrics are used in subsequent analyses. (C, right) Summary allegiance matrix for a sample subject for the period before TMS onset, indicating the natural architecture of connectivity within the alpha band.

Similar articles

Cited by

References

    1. Achard S., Salvador R., Whitcher B., Suckling J., & Bullmore E. (2006). A resilient, low-frequency, small-world human brain functional network with highly connected association cortical hubs. Journal of Neuroscience, 26, 63–72. 10.1523/jneurosci.3874-05.2006 - DOI - PMC - PubMed
    1. Adrian E. D., & Matthews B. H. C. (1934). The interpretation of potential waves in the cortex. Journal of Physiology, 81, 440–471. - PMC - PubMed
    1. Alivisatos A. P., Chun M., Church G. M., Greenspan R. J., Roukes M. L., & Yuste R. (2012). The Brain Activity Map Project and the challenge of functional connectomics. Neuron, 74, 970–974. 10.1016/j.neuron.2012.06.006 - DOI - PMC - PubMed
    1. Amico E., Bodart O., Rosanova M., Gosseries O., Heine L., Van Mierlo P., …, Laureys S. (2017). Tracking dynamic interactions between structural and functional connectivity: A TMS/EEG-dMRI study. Brain Connectivity, 7, 84–97. 10.1089/brain.2016.0462 - DOI - PubMed
    1. Ashourvan A., Gu S., Mattar M. G., Vettel J. M., & Bassett D. S. (2017). The energy landscape underpinning module dynamics in the human brain connectome. NeuroImage, 157, 364–380. 10.1016/j.neuroimage.2017.05.067 - DOI - PMC - PubMed