. 2020 May 8;1(2):100014.
doi: 10.1016/j.patter.2020.100014. Epub 2020 Apr 23.

Patterns of Reliability: Assessing the Reproducibility and Integrity of DNA Methylation Measurement

Affiliations

Patterns of Reliability: Assessing the Reproducibility and Integrity of DNA Methylation Measurement

Karen Sugden et al. Patterns (N Y). .

Abstract

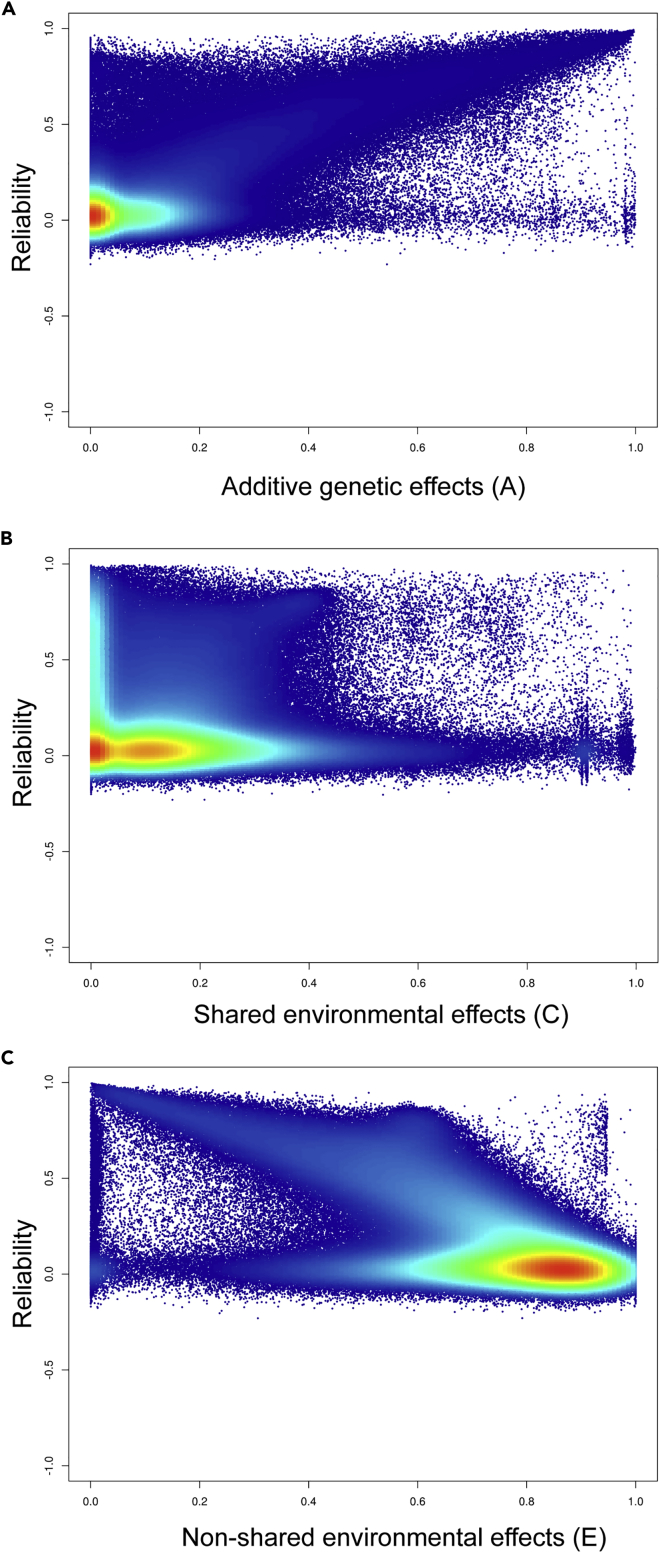
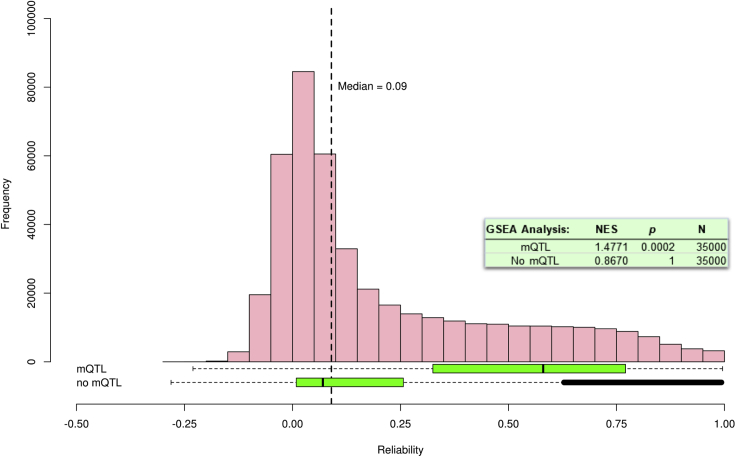
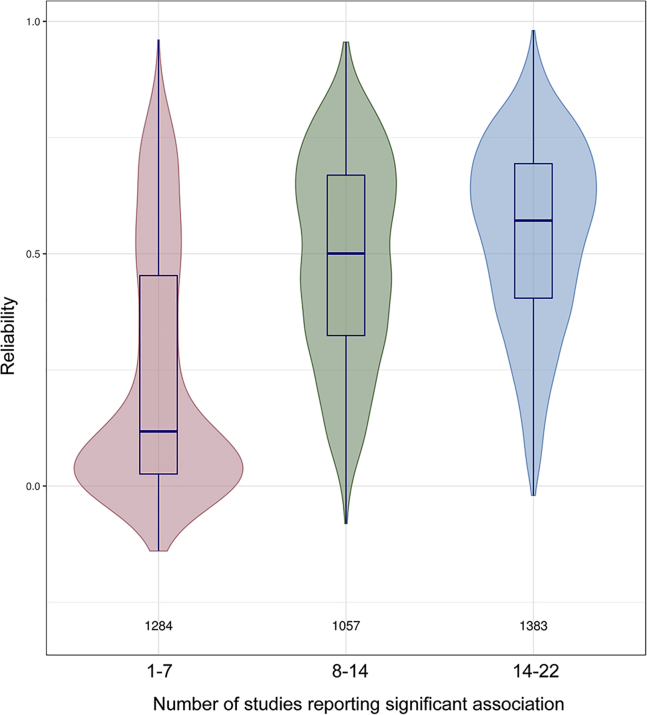
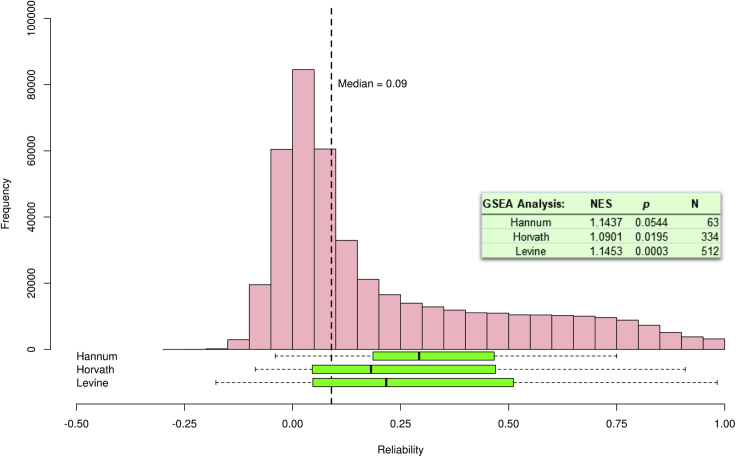
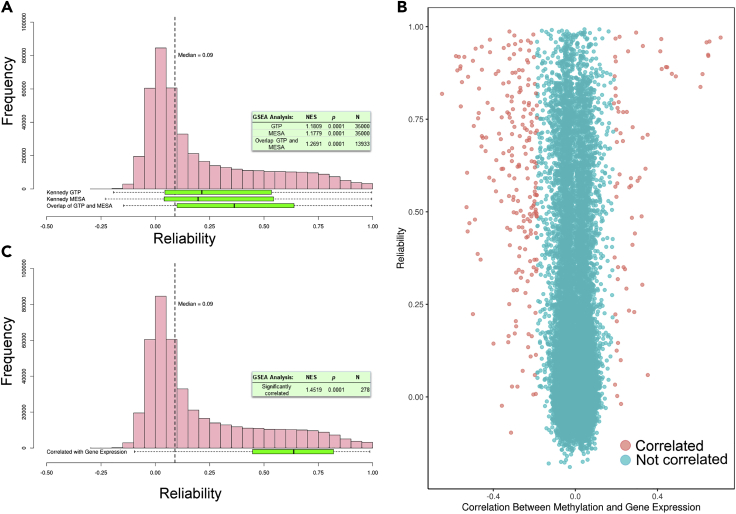
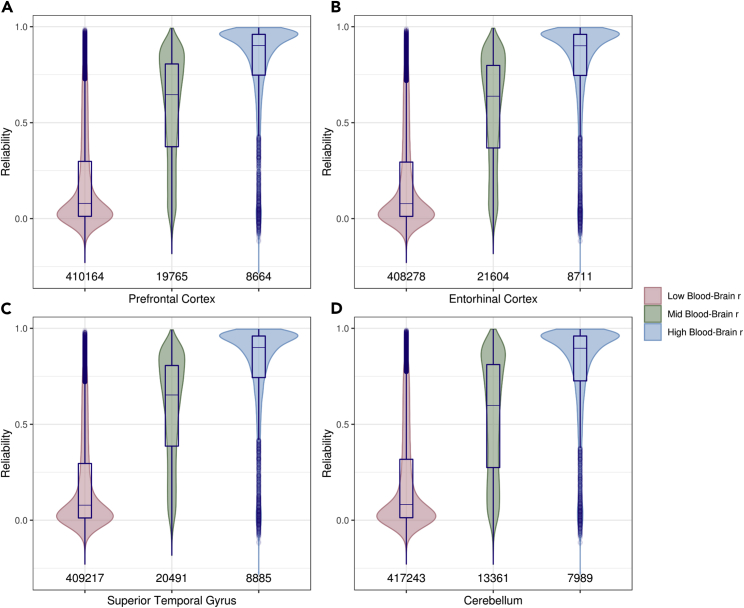
DNA methylation plays an important role in both normal human development and risk of disease. The most utilized method of assessing DNA methylation uses BeadChips, generating an epigenome-wide "snapshot" of >450,000 observations (probe measurements) per assay. However, the reliability of each of these measurements is not equal, and little consideration is paid to consequences for research. We correlated repeat measurements of the same DNA samples using the Illumina HumanMethylation450K and the Infinium MethylationEPIC BeadChips in 350 blood DNA samples. Probes that were reliably measured were more heritable and showed consistent associations with environmental exposures, gene expression, and greater cross-tissue concordance. Unreliable probes were less replicable and generated an unknown volume of false negatives. This serves as a lesson for working with DNA methylation data, but the lessons are equally applicable to working with other data: as we advance toward generating increasingly greater volumes of data, failure to document reliability risks harming reproducibility.


Conflict of interest statement

Declaration of Interests The authors declare no competing interests.

Figures

Figure 1
Figure 1
Density Heatmap of Probe Reliability Plotted against Estimates of Genetic and Environmental Effects on DNA Methylation (A) Additive genetic effects (denoted as “A”), (B) shared environmental effects (denoted as “C”), and (C) non-shared (or unique) environmental effects (denoted as “E”). The variance component is plotted on the x axis and the reliability is plotted on the y axis. Probes with the highest reliability have the highest value of A and lowest value of E. Density is depicted on a spectral scale from low (dark blue) to high (red).
Figure 2
Figure 2
The Distribution of Reliabilities of Probes Identified in a Large-Scale mQTL Analysis Compared with Non-mQTL Probes Distributions are depicted as box-and-whisker plots of the reliability coefficients of the probes identified as having mQTLs (“mQTL”) and the remainder not included in the mQTL list (“no mQTL”). Boxes correspond to interquartile range (IQR), and whiskers extend to 1.5 × IQR. Observations beyond the whiskers (outliers) are represented by individual points. As a reference, the distribution (pink bars) and median (vertical dashed line) of all ∼440,000 probe reliabilities in the E-Risk dataset is shown above the box-and-whisker plots. The text box shows the results of gene set enrichment analysis (GSEA; NES, normalized enrichment score; N, number of probes); probes associated with mQTLs are enriched for reliable probes, suggesting that reliable probe measurement is important for uncovering genetic effects on methylation.
Figure 3
Figure 3
Probes Consistently Associated with Smoking across Studies Have Higher Reliabilities Than Probes that Are Not We identified 22 epigenome-wide association studies of smoking and DNA methylation. For ease of visualization, probes have been binned into three groups representing 1–7 replications (pink), 8–14 replications (green), and 15–22 replications (blue). The values above the x axis represent the number of probes per group. In the 1–7 replication bin, the highest density of probes was at the low-reliability end of the distribution, and the median reliability (as depicted by the median line of the box plot within the violin) was the lowest of the three groups. Boxes correspond to IQR and whiskers extend to 1.5 × IQR.
Figure 4
Figure 4
Reliabilities of Probes Included in Established, Publicly Available DNA Methylation Algorithms (“Clocks”) Distributions are depicted as box-and-whisker plots of the reliability coefficients of the probe constituents of the Hannum et al. aging clock (63 probes), Horvath DNAmAge clock (334 probes), and Levine et al. biological aging clock (512 probes). Boxes correspond to IQR and whiskers extend to 1.5 × IQR. Observations beyond the whiskers (outliers) are represented by individual points. As a reference, the distribution (pink bars) and median (vertical dashed line) of all ∼440,000 probe reliabilities in the E-Risk dataset is shown above the box-and-whisker plots. The aging clocks are enriched for reliable probes (values to the right of the figure; NES, normalized enrichment score; N, number of probes). Median reliabilities of probes included in aging clocks are higher than those of the general distribution; however, each algorithm contained many unreliable probes.
Figure 5
Figure 5
Reliabilities of Probes Significantly Correlated with Gene Expression Have Higher Reliabilities Than Non-correlated Probes (A) Distributions of the reliability coefficients of the probes identified as correlated with gene expression by Kennedy et al. in the GTP and MESA cohorts (N probes = 36,485 and 114,536, respectively). Probes that are correlated with gene expression in both cohorts are shown in the bottom-most box-and-whisker plot. Boxes correspond to IQR and whiskers extend to 1.5 × IQR. As a reference, the distribution (pink bars) and median (vertical dashed line) of all ∼440,000 probe reliabilities in the E-Risk dataset is shown above the box-and-whisker plots. The text box shows the results of GSEA for the GTP cohort, MESA cohort, and the intersection of both cohorts (NES, normalized enrichment score; N, number of probes). Each cohort's set of significantly correlated DNA methylation probe-gene expression pairs is enriched for reliable probes; pairs that are significantly correlated in both datasets are further enriched. (B) TSS-localized DNA methylation probe-gene expression probeset correlation (x axis) plotted against DNA methylation probe reliability (y axis) in the Dunedin Study dataset. Probes that were significantly correlated with gene expression are shown in pink (n = 278) and those not correlated are shown in blue. (C) Distribution of reliabilities of these significantly correlated DNA methylation probes as a box-and-whisker plot. The text box shows the results of GSEA (NES, normalized enrichment score; N, number of probes); DNA methylation probes that were significantly correlated with expression probesets are enriched for reliable probes.
Figure 6
Figure 6
Violin Plots of the Distribution of Reliability in Probes with Low (<0.4, Pink), Medium (0.4–0.75, Green), and High (>0.75, Blue) Blood-Brain Correlation in DNA Methylation Distributions are shown across four brain regions: prefrontal cortex (A), entorhinal cortex (B), superior temporal gyrus (C), and cerebellum (D). Number of probes per group is listed above the x axis. Box-and-whisker plots of the distribution are plotted within violin plots. Values below each violin correspond to the number of probes in that group. Probes with high blood-brain concordance are concentrated at the high-reliability end of the distribution. Boxes correspond to IQR and whiskers extend to 1.5 × IQR.

References

    1. Robertson K.D. DNA methylation and human disease. Nat. Rev. Genet. 2005;6:597–610. - PubMed
    1. Schubeler D. Function and information content of DNA methylation. Nature. 2015;517:321–326. - PubMed
    1. Velasco G., Francastel C. Genetics meets DNA methylation in rare diseases. Clin. Genet. 2019;95:210–220. - PubMed
    1. Burggren W.W., Crews D. Epigenetics in comparative biology: why we should pay attention. Integr. Comp. Biol. 2014;54:7–20. - PMC - PubMed
    1. Ruskin H.J., Barat A. Recent advances in computational epigenetics. Adv. Genomics Genet. 2018;8:12.