

Effects of macronutrient intake in obesity: a meta-analysis of low-carbohydrate and low-fat diets on markers of the metabolic syndrome
- PMID: 32885229
- PMCID: PMC7947787
- DOI: 10.1093/nutrit/nuaa044
Effects of macronutrient intake in obesity: a meta-analysis of low-carbohydrate and low-fat diets on markers of the metabolic syndrome
Abstract
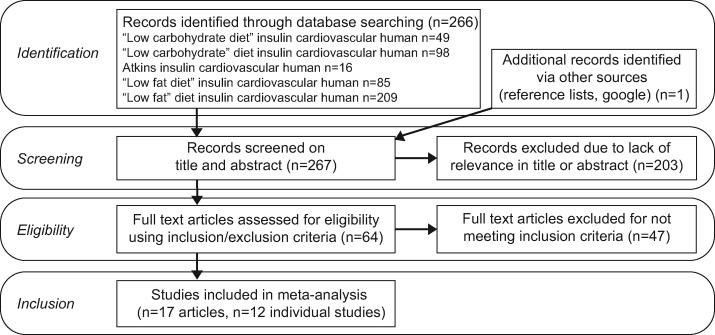
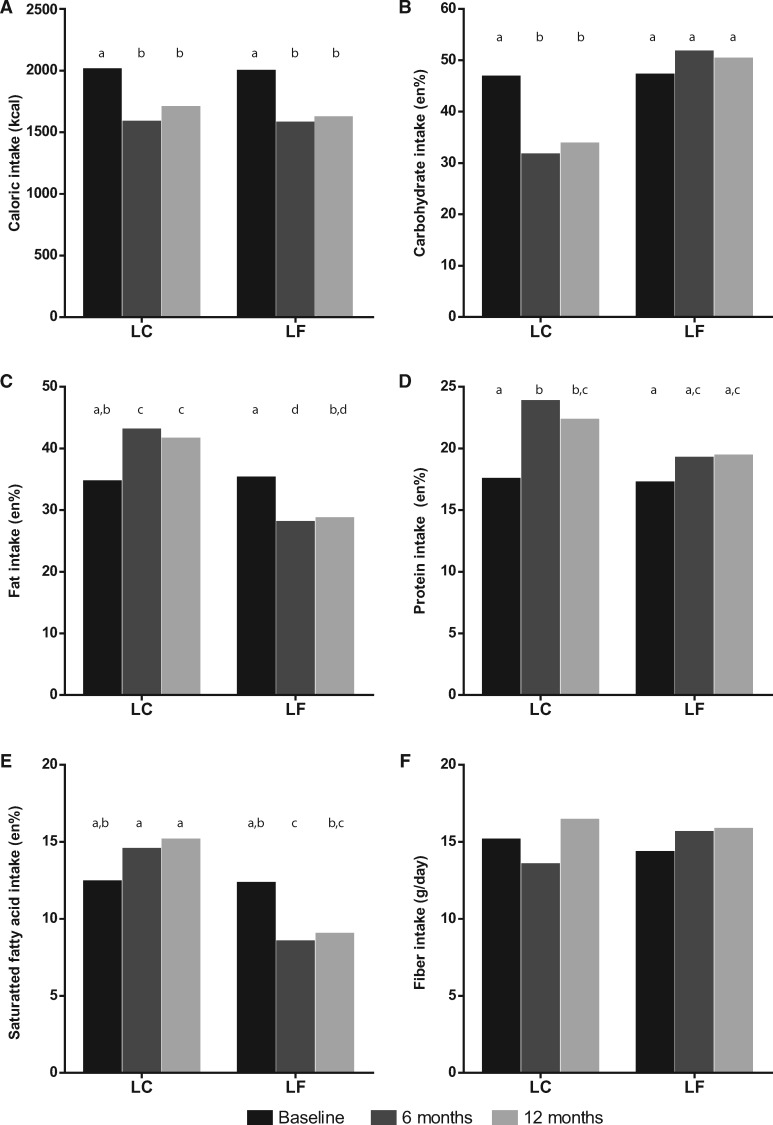
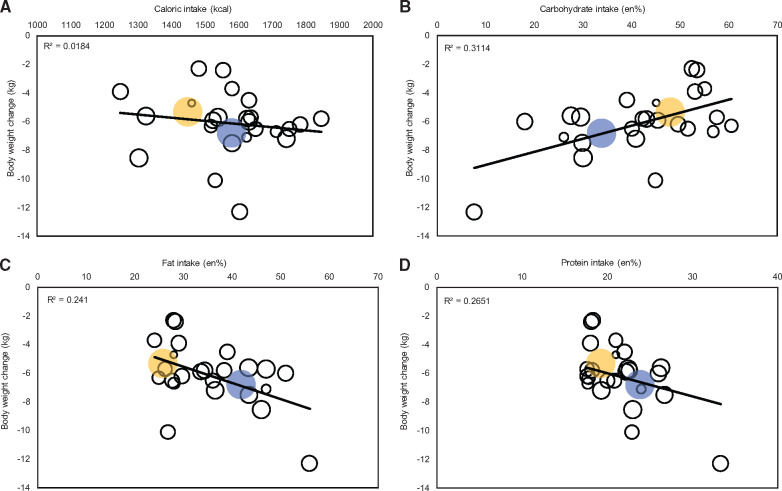
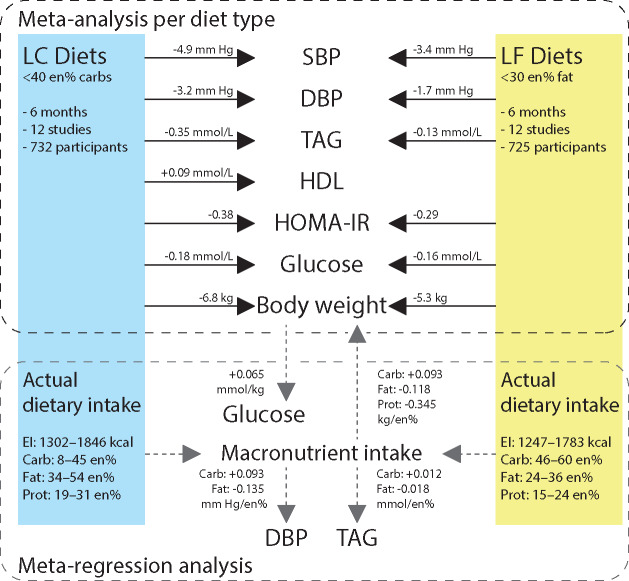
The metabolic syndrome (MetS) comprises cardiometabolic risk factors frequently found in individuals with obesity. Guidelines to prevent or reverse MetS suggest limiting fat intake, however, lowering carbohydrate intake has gained attention too. The aim for this review was to determine to what extent either weight loss, reduction in caloric intake, or changes in macronutrient intake contribute to improvement in markers of MetS in persons with obesity without cardiometabolic disease. A meta-analysis was performed across a spectrum of studies applying low-carbohydrate (LC) and low-fat (LF) diets. PubMed searches yielded 17 articles describing 12 separate intervention studies assessing changes in MetS markers of persons with obesity assigned to LC (<40% energy from carbohydrates) or LF (<30% energy from fat) diets. Both diets could lead to weight loss and improve markers of MetS. Meta-regression revealed that weight loss most efficaciously reduced fasting glucose levels independent of macronutrient intake at the end of the study. Actual carbohydrate intake and actual fat intake at the end of the study, but not the percent changes in intake of these macronutrients, improved diastolic blood pressure and circulating triglyceride levels, without an effect of weight loss. The homeostatic model assessment of insulin resistance improved with both diets, whereas high-density lipoprotein cholesterol only improved in the LC diet, both irrespective of aforementioned factors. Remarkably, changes in caloric intake did not play a primary role in altering MetS markers. Taken together, these data suggest that, beyond the general effects of the LC and LF diet categories to improve MetS markers, there are also specific roles for weight loss, LC and HF intake, but not reduced caloric intake, that improve markers of MetS irrespective of diet categorization. On the basis of the results from this meta-analysis, guidelines to prevent MetS may need to be re-evaluated.
Keywords: low-carbohydrate diet; low-fat diet; macronutrients; metabolic syndrome; weight loss.
© The Author(s) 2020. Published by Oxford University Press on behalf of the International Life Sciences Institute.
Figures
References
-
- Seshadri P, Iqbal N, Stern L, et al. A randomized study comparing the effects of a low-carbohydrate diet and a conventional diet on lipoprotein subfractions and C-reactive protein levels in patients with severe obesity. Am J Med. 2004;117:398–405. - PubMed
-
- Festa A, D'Agostino R, Mykkanen L, et al. LDL particle size in relation to insulin, proinsulin, and insulin sensitivity. The Insulin Resistance Atherosclerosis Study. Diabetes Care. 1999;22:1688–1693. - PubMed
-
- Kang H-S, Gutin B, Barbeau P, et al. Low-density lipoprotein particle size, central obesity, cardiovascular fitness, and insulin resistance syndrome markers in obese youths. Int J Obes. 2002;26:1030–1035. - PubMed
-
- International Diabetes Federation. The IDF consensus worldwide definition of the metabolic syndrome Part 1: Worldwide definition for use in clinical practice. Available at: https://www.idf.org/e-library/consensus-statements/60-idfconsensus-world.... Accessed September 9, 2018.
-
- Prasad H, Ryan DA, Celzo MF, et al. Metabolic syndrome: definition and therapeutic implications. Postgrad Med. 2012;124:21–30. - PubMed
Publication types
MeSH terms
LinkOut - more resources
Full Text Sources
Medical
Research Materials
Miscellaneous
