. 2021 May 17;37(7):968-975.
doi: 10.1093/bioinformatics/btaa769.

Identifying signaling genes in spatial single-cell expression data

Affiliations

Identifying signaling genes in spatial single-cell expression data

Dongshunyi Li et al. Bioinformatics. .

Abstract

Motivation: Recent technological advances enable the profiling of spatial single-cell expression data. Such data present a unique opportunity to study cell-cell interactions and the signaling genes that mediate them. However, most current methods for the analysis of these data focus on unsupervised descriptive modeling, making it hard to identify key signaling genes and quantitatively assess their impact.

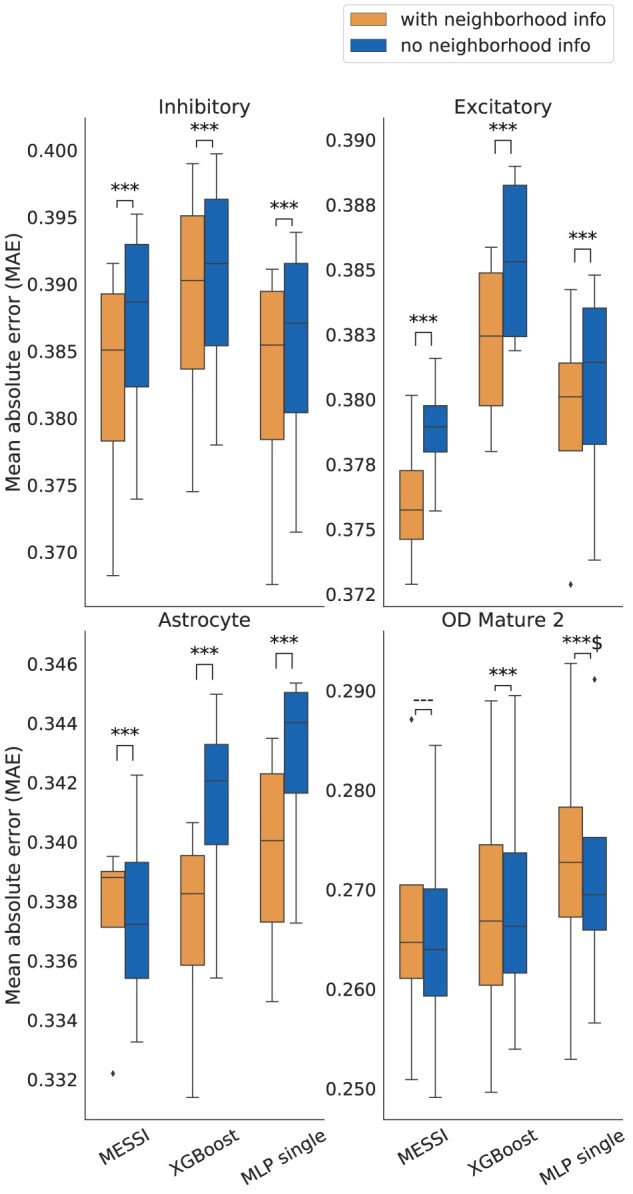
Results: We developed a Mixture of Experts for Spatial Signaling genes Identification (MESSI) method to identify active signaling genes within and between cells. The mixture of experts strategy enables MESSI to subdivide cells into subtypes. MESSI relies on multi-task learning using information from neighboring cells to improve the prediction of response genes within a cell. Applying the methods to three spatial single-cell expression datasets, we show that MESSI accurately predicts the levels of response genes, improving upon prior methods and provides useful biological insights about key signaling genes and subtypes of excitatory neuron cells.

Availability and implementation: MESSI is available at: https://github.com/doraadong/MESSI.

Supplementary information: Supplementary data are available at Bioinformatics online.


Figures

Fig. 1.
Fig. 1.
MESSI framework. Cell neighbors are determined by applying Delaunay triangulation to the cell spatial coordinates. Next, expression levels of signaling genes in the cell and its neighbors, the cell’s spatial location, and the neighbors’ cell types, are used to probabilistically assign the cell to a subtype (expert). Experts then integrate information from intra- and inter-signaling genes to predict the expression of response genes. The final output is then the average of these predictions weighted by the expert likelihood
Fig. 2.
Fig. 2.
Cross-validation results averaged over cell types. MESSI achieved the lowest mean absolute error (MAE) when averaged over eight cell types from the MERFISH hypothalamus data. For all methods, models utilizing neighborhood expression values significantly outperformed those that do not. with neighborhood info: using both intra- and intercellular signaling genes, and other spatial information (see Section 2) as features; no neighborhood info: using only intracellular signaling genes as features. ***: P-value below 1e−3; LR: linear regression; MLP single: MLP with single-node output; MLP multi: MLP with multi-node output; MROTS: Multiple-output Regression with Output and Task Structures
Fig. 3.
Fig. 3.
Advantage of using neighborhood expression values. Using both intra- and inter- (neighborhood) cellular features improved prediction accuracy across most major cell types. Here, the cell types are listed in the order of decreasing sample size. With neighborhood info: using both intra- and intercellular signaling genes, and other spatial information (see Section 2) as features; no neighborhood info: using only intracellular signaling genes as features. ***: P-value below 1e−3 **: P-value larger than 5e−2; : more than half of the CV groups show non-significant improvement when using neighborhood information; MLP single: MLP with single-node output
Fig. 4.
Fig. 4.
Impact of training sample size on accuracy. We down-sampled inhibitory and excitatory cells to compare the performance of methods when using the full data and when using a smaller dataset. While MESSI and MLP single performed better than XGBoost when using all available data, using the reduced dataset for training likely led to overfitting for these two methods. MLP single: MLP with single-node output
Fig. 5.
Fig. 5.
CV results of the MERFISH U-2 OS cell line and the STARmap data. Left: Results for the analysis of the MERFISH U-2 OS cells data. Right: Results for the analysis of the STARmap data. ***: P-value below 1e−3; $: more than half of the CV groups show non-significant improvement when using MESSI; MLP single: MLP with single-node output
Fig. 6.
Fig. 6.
Comparison of naive and behavior models when the behavior is virgin parenting. Results are presented for the four major cell types. Naive model—predictions based on the naive model. Behavior raw—predictions based on learning from the raw values in the corresponding behavioral samples. Behavior change—predictions based on learning from the raw values in the corresponding behavioral samples subtracted by the predictions from the naive model. See Supplementary Material for details. ***: P-value below 1e−3; **: P-value below 1e−2; ---: P-value larger than 5e−2; $: more than half of the CV groups show non-significant improvement when using behavioral models
Fig. 7.
Fig. 7.
MESSI reveals changes in key signaling molecules and relevant signaling networks activated upon experience. Top (a): Coefficients for top signaling molecules in a subset of the MESSI experts of excitatory cells for different conditions (X axis) for several response genes (Y axis). Note the large increase in Oxt coefficients between naive and parenting or virgin parenting models. See Supplementary Material for the selection of top features. Bottom: Cells assigned to specific MESSI experts. (b, c, e): spatial location of the cells on an example bregma; (d): the proportion of interacting partners from each expert as indicated by the expression level of neighboring oxytocin

References

    1. Bayerl D.S. et al. (2019) More than reproduction: central gonadotropin-releasing hormone antagonism decreases maternal aggression in lactating rats. J. Neuroendocrinol., 31, e12709. - PubMed
    1. Bealer S.L. et al. (2010) Oxytocin release in magnocellular nuclei: neurochemical mediators and functional significance during gestation. Am. J. Physiol. Regul. Integr. Comp. Physiol., 299, R452–R458. - PMC - PubMed
    1. Cabello-Aguilar S. et al. (2020) SingleCellSignalR: inference of intercellular networks from single-cell transcriptomics. Nucleic Acids Res., 48, e55. - PMC - PubMed
    1. Cembrowski M.S. (2019) Single-cell transcriptomics as a framework and roadmap for understanding the brain. J.Neurosci. Methods, 326, 108353. - PubMed
    1. Chen T., Guestrin C. (2016). XGBoost: A scalable tree boosting system. In: Proceedings of the 22nd ACM SIGKDD International Conference on Knowledge Discovery and Data Mining. KDD ’16, p.785–794. ACM, New York, NY, USA.

Publication types