. 2020 Sep 4;15(9):e0238435.
doi: 10.1371/journal.pone.0238435. eCollection 2020.

Loss of the ER membrane protein complex subunit Emc3 leads to retinal bipolar cell degeneration in aged mice

Affiliations

Loss of the ER membrane protein complex subunit Emc3 leads to retinal bipolar cell degeneration in aged mice

Xiong Zhu et al. PLoS One. .

Abstract

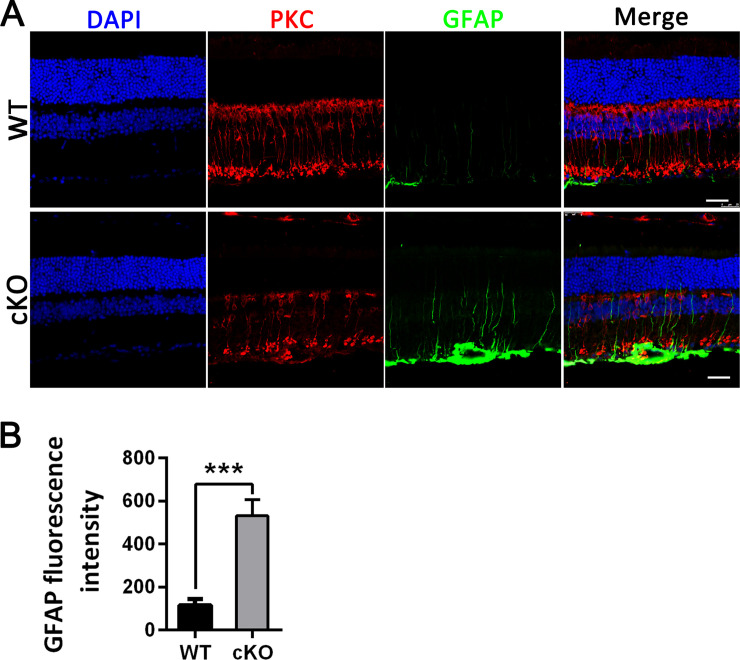
The endoplasmic reticulum (ER) membrane protein complex (EMC) is a conserved protein complex involved in inserting the transmembrane domain of membrane proteins into membranes in the ER. EMC3 is an essential component of EMC and is important for rhodopsin synthesis in photoreceptor cells. However, the in vivo function of Emc3 in bipolar cells (BCs) has not been determined. To explore the role of Emc3 in BCs, we generated a BC-specific Emc3 knockout mouse model (named Emc3 cKO) using the Purkinje cell protein 2 (Pcp2) Cre line. Although normal electroretinography (ERG) b-waves were observed in Emc3 cKO mice at 6 months of age, Emc3 cKO mice exhibited reduced b-wave amplitudes at 12 months of age, as determined by scotopic and photopic ERG, and progressive death of BCs, whereas the ERG a-wave amplitudes were preserved. PKCa staining of retinal cryosections from Emc3 cKO mice revealed death of rod BCs. Loss of Emc3 led to the presence of the synaptic protein mGLuR6 in the outer nuclear layer (ONL). Immunostaining analysis of presynaptic protein postsynaptic density protein 95 (PSD95) revealed rod terminals retracted to the ONL in Emc3 cKO mice at 12 months of age. In addition, deletion of Emc3 resulted in elevated glial fibrillary acidic protein, indicating reactive gliosis in the retina. Our data demonstrate that loss of Emc3 in BCs leads to decreased ERG response, increased astrogliosis and disruption of the retinal inner nuclear layer in mice of 12 months of age. Taken together, our studies indicate that Emc3 is not required for the development of BCs but is important for long-term survival of BCs.


Conflict of interest statement

The authors have declared that no competing interests exist.

Figures

Fig 1
Fig 1. Emc3 expression levels were reduced in Emc3 cKO mice.
(A) Verification of Pcp2-Cre specification using tdTomato reporter mice. Td-Tomato reporter mice were crossed with Pcp2-Cre mice, and Cre expression was monitored (red). Rod bipolar cells were stained with PKCα (green). Nuclei were stained with DAPI (blue). Td-tomato-expressing cells were significantly associated with rod bipolar cells, indicating specific expression of Pcp2-Cre. The sample size was n = 4 for both control and Emc3 cKO mice. (B) RT-PCR analysis showed a 45% reduction in Emc3 expression in Emc3 cKO mice compared to that of controls. A t-test was performed. The sample size was n = 4 for both control and Emc3 cKO mice. *** p < 0.001; Error bars represent SD.
Fig 2
Fig 2. Representative ERG test trace in Emc3 cKO mice at 6 and 12 months of age.
(A) Representative electroretinogram (ERG) traces corresponding to responses elicited by scotopic conditions at flash intensities from 0.003 to 20 cd sec/m2 in mice at 6 months and 12 months of age. (B) OP peak amplitudes under scotopic reaction conditions with a flash intensity of 0.003 to 20 cd sec/m2 in mice at 6 months and 12-months of age.
Fig 3
Fig 3. Reduced scotopic ERG b-wave amplitudes in Emc3 cKO mice at 12 months of age.
ANOVA tests were performed for the amplitudes of a-wave, b-wave and OPs of mice at 6 months and 12 months of age. Post-hoc tests were performed for b-wave and OPs. At 6 months of age, there was no significant difference in the amplitude of the scotopic a-wave and b-wave. However, at 12 months of age, the amplitudes of the photopic and scotopic ERG b-waves were significantly reduced, while the amplitudes of the a-wave were preserved. The OP values of the Emc3 cKO group were lower than those of the control group. The sample size was n = 4 for both the control and cKO groups. * * p < 0.01; * * * p < 0.001. Error bars represent SD.
Fig 4
Fig 4. Reduced photopic ERG b-wave amplitudes in Emc3 cKO mice at 12 months of age.
Representative electroretinograms (ERG) traces corresponding to responses elicited by photopic conditions at flash intensities from 0.3 and 20 cd sec/m2 in mice at 12 months of age. ANOVA tests were performed for the amplitudes of b-wave at 12 months of age. A post-hoc test was performed. T-test was performed for photopic flicker. * * p < 0.01; * p < 0.05. Error bars represent SD.
Fig 5
Fig 5. Emc3 cKO mice exhibited degeneration of rod bipolar cells.
(A) Representative immunostaining of retinal sections of control (WT) and Emc3 cKO retinas at 12 months old using anti-PKCα (green). Nuclei were counterstained with DAPI (blue). Scale bar, 25 μm. (B) Quantification of PKCα-positive cells per 100 μm of section in the same position. A t-test was performed. The number of PKCα-positive cells clearly declined in 12-month-old cKO mice. The sample size was n = 6 for both WT and cKO mice. n = number of independent biological replicates. * ** p < 0.001; Error bars represent SD.
Fig 6
Fig 6. Progressive degeneration of bipolar cells.
(A) No visible degeneration in Emc3 cKO mice at 3 months of age. Representative H&E stained retinal sections of control and Emc3 cKO mice at 3 months of age, oriented with the inferior pole to the left and superior pole to the right. High magnification images are displayed on the lower panel of each image. Scale bar, 25 μm. The sample size was n = 4 for both controls and Emc3 cKO mice. (B and C) Quantification of inner nuclear layer (INL) and outer nuclear layer (ONL) thickness at specified distances from the optic nerve head of the control and Emc3 cKO retina. No difference was observed in the thickness of the INL and ONL when comparing control and Emc3 cKO mice. (D) Degeneration in middle retinas in Emc3 cKO mice at 6 months of age. Representative H&E stained retinal sections of control and Emc3 cKO mice at 6 months of age, oriented with the inferior pole to the left and superior pole to the right. High magnification images are displayed on the lower panel of each image. Scale bar, 25 μm. The sample size was n = 4 for both control and Emc3 cKO mice. (E and F) Quantification of inner nuclear layer (INL) and outer nuclear layer (ONL) thickness at specified distances from the optic nerve head of the control and Emc3 cKO retina. The thickness of the INL was reduced in Emc3 cKO mice. Two-tailed t-test. *, p<0.05. (G) Representative H&E stained retinal sections of control (WT) and Emc3 cKO retinas in mice at 12 months of age, oriented with the inferior pole to the left and superior pole to the right. Higher magnification images are shown in the lower panel of each image. Scale bar, 25 μm. (H and I) Quantification of the outer nuclear layer (ONL) (D) and inner nuclear layer (INL) (E) thickness at specified distances from the optic nerve head of the WT and Emc3 cKO mouse retinas at 12 months of age. The sample size was n = 6 for both WT and cKO mice groups. n = number of independent biological replicates. ANOVA tests were performed for the INL thickness measurement of 3, 6 and 12 months of age. A post-hoc test was performed for the measurement of 12 months of age. * p < 0.05; * * p < 0.01; and * * * p < 0.001. Error bars, SEM.
Fig 7
Fig 7. Changed mGluR6 and PSD95 expression patterns of bipolar cells in Emc3 cKO retinas at 12 months of age.
(A) Retinal sections from both WT and cKO mice at 12 months old were labeled with PKCα (red) and mGluR6 (green). Nuclei were counterstained with DAPI (blue). Scale bar, 25 μm. High magnification images are displayed in the lower panel of each image. Scale bar, 10 μm. In control mice, mGluR6-labeled synaptic dendritic processes (green) are confined in the outer plexiform layer (OPL) of control retinas. In contrast, dendritic processes (green) are misplaced (arrows) in the outer nuclear layer (ONL) of Emc3 cKO retinas. Arrows indicate abnormal dendrite sprouting. (B) Quantification of mGluR6-labeled synaptic dendritic processes in the ONL per 100 μm of sections in the same position. Kolmogorov–Smirnov test indicated that the data set was not normally distributed and a non-parametric Mann–Whitney U test was performed. Z = -2.99; p = 0.003. The number of mGluR6-positive processes increased in 12-month-old cKO mice. The sample size was n = 7 for both WT and cKO mice. n = number of independent biological replicates. * p < 0.05; * * p < 0.01; and * * * p < 0.001. Error bars, SEM. (C) Retinal sections from both WT and cKO mice at 12 months of age were labeled with PKCα (red) and PSD95 (green). Nuclei were counterstained with DAPI (blue). Scale bar, 25 μm. High magnification images are displayed in the lower panel of each image. Scale bar, 10 μm. In control mice, PSD95-labeled synaptic dendritic processes (green) from rods are confined in the outer plexiform layer (OPL) in control retinas. In contrast, rod dendritic processes (green) were retracted into the outer nuclear layer (ONL) in Emc3 cKO retinas (arrows). Arrows indicate abnormal retracted dendrite sprouting. (D) Quantification of PSD95-labeled synaptic dendritic processes in the ONL per 100 μm of section in the same position. Kolmogorov–Smirnov test indicated that the data set was not normally distributed and a non-parametric Mann–Whitney U test was performed. Z = -2.99; p = 0.003. The number of PSD95-positive processes significantly increased in 12-month-old cKO mice. The sample size was n = 6 for both WT and cKO mice. n = number of independent biological replicates. * p < 0.05; * * p < 0.01; and * * * p < 0.001. Error bars, SEM.
Fig 8
Fig 8. Activation of astrogliosis in Emc3 cKO retinas.
(A) Representative immunostained retinal sections of WT and cKO mice stained with PKCα (red) and GFAP (green) at 12 months of age. Nuclei were counterstained with DAPI (blue). Scale bar, 25 μm. (B) Quantification of the fluorescence intensity of GFAP staining of retinal cryosections in WT and Emc3 cKO retains. Kolmogorov–Smirnov test indicated that the data set was not normally distributed and a non-parametric Mann–Whitney U test was performed. Z = -3.24; p = 0.0003. The intensity of GFAP staining significantly increased in 12-month-old cKO mice. The sample size was n = 5 for both WT and cKO mice. n = number of independent biological replicates. *** p < 0.001. Error bars, SEM.

Similar articles

Cited by

References

    1. Jonikas M.C., Collins S.R., Denic V., Oh E., Quan E.M., Schmid V., et al., Comprehensive characterization of genes required for protein folding in the endoplasmic reticulum, Science (New York, N.Y.) 323 (2009) 1693–1697. 10.1126/science.1167983 - DOI - PMC - PubMed
    1. Christianson J.C., Olzmann J.A., Shaler T.A., Sowa M.E., Bennett E.J., Richter C.M., et al. Defining human ERAD networks through an integrative mapping strategy, Nat Cell Biol 14 (2011) 93–105. 10.1038/ncb2383 - DOI - PMC - PubMed
    1. Christianson J.C., Olzmann J.A., Shaler T.A., Sowa M.E., Bennett E.J., Richter C.M., et al. Defining human ERAD networks through an integrative mapping strategy, Nature cell biology 14 (2012) 93–105. 10.1038/ncb2383 - DOI - PMC - PubMed
    1. Martin S.R.C., Jonikas C., Vladimir Denic, Eugene Oh, Erin M. Quan, Volker Schmid, et al. Comprehensive Characterization of Genes Required for Protein Folding in the Endoplasmic Reticulum, Science 323 (2009) 1693–1697. 10.1126/science.1167983 - DOI - PMC - PubMed
    1. Shen X., Kan S., Hu J., Li M., Lu G., Zhang M., et al. EMC6/TMEM93 suppresses glioblastoma proliferation by modulating autophagy, Cell Death Dis 7 (2016) e2043 10.1038/cddis.2015.408 - DOI - PMC - PubMed

Publication types

Substances