. 2020 Sep 4;15(9):e0238559.
doi: 10.1371/journal.pone.0238559. eCollection 2020.

Modeling the spread of COVID-19 in Germany: Early assessment and possible scenarios

Affiliations

Modeling the spread of COVID-19 in Germany: Early assessment and possible scenarios

Maria Vittoria Barbarossa et al. PLoS One. .

Abstract

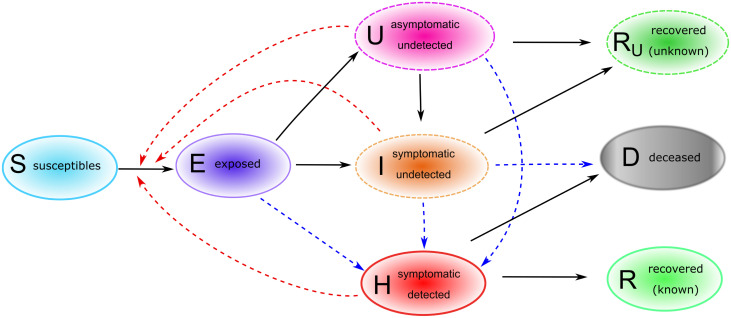
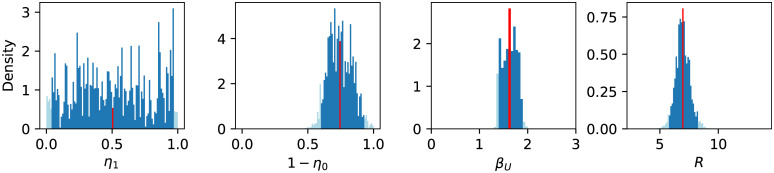
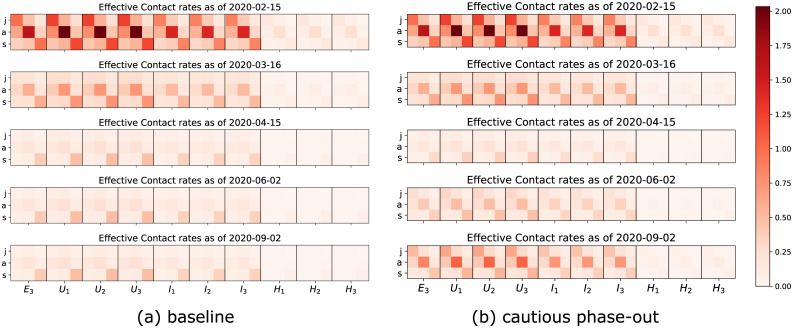
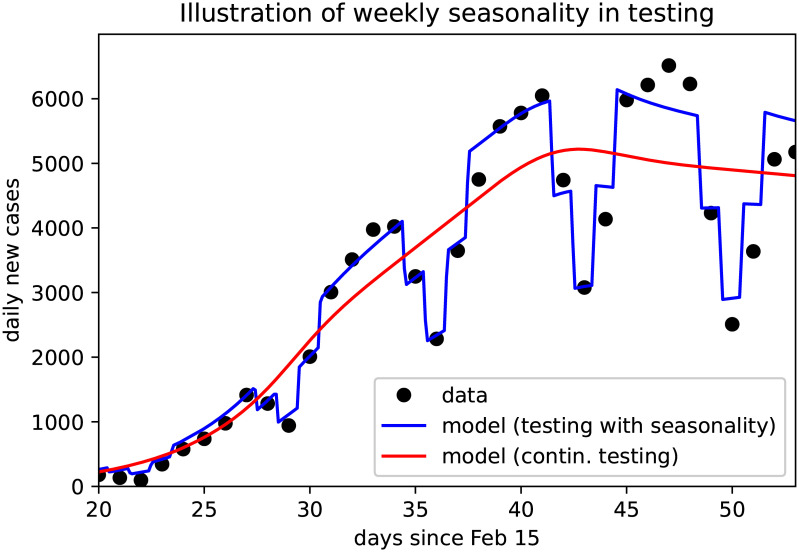
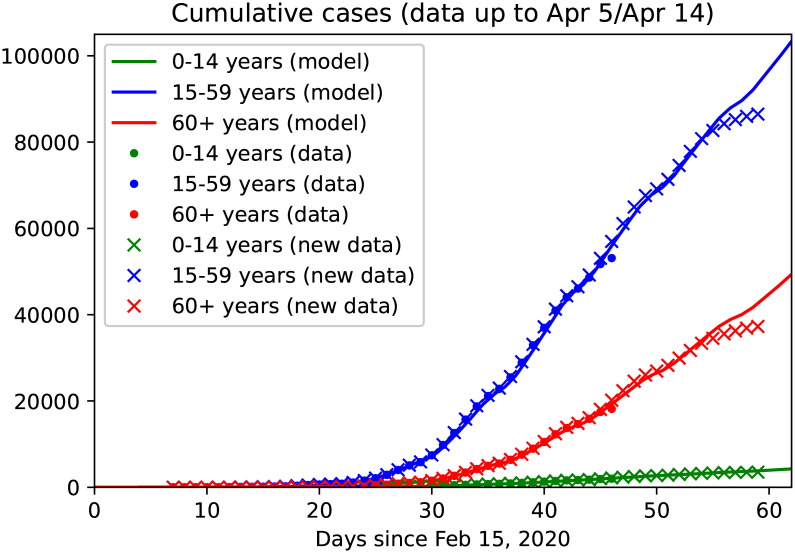
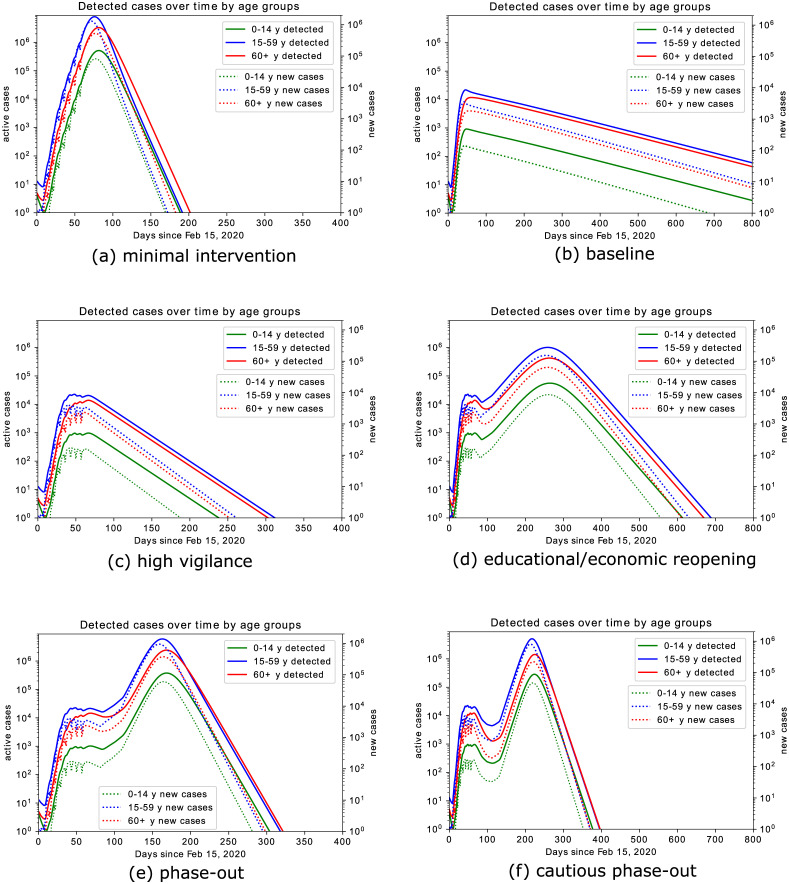
The novel coronavirus (SARS-CoV-2), identified in China at the end of December 2019 and causing the disease COVID-19, has meanwhile led to outbreaks all over the globe with about 2.2 million confirmed cases and more than 150,000 deaths as of April 17, 2020. In this work, mathematical models are used to reproduce data of the early evolution of the COVID-19 outbreak in Germany, taking into account the effect of actual and hypothetical non-pharmaceutical interventions. Systems of differential equations of SEIR type are extended to account for undetected infections, stages of infection, and age groups. The models are calibrated on data until April 5. Data from April 6 to 14 are used for model validation. We simulate different possible strategies for the mitigation of the current outbreak, slowing down the spread of the virus and thus reducing the peak in daily diagnosed cases, the demand for hospitalization or intensive care units admissions, and eventually the number of fatalities. Our results suggest that a partial (and gradual) lifting of introduced control measures could soon be possible if accompanied by further increased testing activity, strict isolation of detected cases, and reduced contact to risk groups.


Conflict of interest statement

The authors have declared that no competing interests exist. The affiliation of some of the authors with the Forschungszentrum Jülich GmbH does not alter our adherence to PLOS ONE policies on sharing data and materials.

Figures

Fig 1
Fig 1. Core model structure for COVID-19 outbreak in Germany.
Solid arrows indicate transition from one compartment to another, red dashed arrows indicate virus transmission due to contact with infectives, blue dashed arrows indicate detection of infections due to testing activities. Upon infection with SARS-CoV-2, susceptible (S) individuals enter a latent phase (E), in which they are not yet infectious nor symptomatic. After the latent phase, individuals become infectious, may develop symptoms and may be detected as COVID-19 cases. We distinguish between asymptomatic undetected (U), symptomatic undetected (I) and symptomatic detected (H) infections. Infected individuals who recovered from a detected (R) or an undetected (RU) infection, as well as patients who died (D) upon infections, are removed from the chain of transmission.
Fig 2
Fig 2. Weighted histograms of η1, 1 − η0, βU, and R (from left to right) based on stochastic variation of η1, 1 − η0, and βU.
Each sample contributes with its Akaike weight, which is based on a fit to the data from February 28 to March 11, 2020, to the histogram (see Eq (4)). Dark blue bins lie within the 95% confidence interval, light blue bins lie outside. Apparently, η1 cannot be well identified using these data. The red bin indicates the mean value (of 1 − η0 = 0.74 (0.59–0.92), of βU = 1.63 (1.39–1.88), and of R=6.95 (5.76–8.25)).
Fig 3
Fig 3. The evolution in time of contacts between juvenile (j), adult (a) and senior (s) susceptible individuals (columns) and infectious individuals in the late latent phase (E3) or one of the infected phases (I1, …H3).
(a) In baseline scenario control measures will be maintained over time, hence contacts and transmission of the virus will remain low, whereas (b) a lift of all control measures (cautious phase-out scenario) after April 15 will slowly lead to a new increase in contacts and virus transmission.
Fig 4
Fig 4. The weekend effect accounting for fluctuations in case detection and reporting.
Black dots denote daily reported new cases, continuous curves show the model solutions with (blue) and without (red) time-depending testing rates.
Fig 5
Fig 5. Age and stage structured model: Data fit and predictions.
Continuous curves show model solutions, dots are reported data up to March 25 (as used in our previous work [24]), cross denotes reported data as of April 15. The model is calibrated on collected data up to April 5 (day 50), data from April 6 to 14 are used for validation. Colors denote the three different age groups: juveniles (0-14y, green), adults (15-59y, blue) and seniors (60y and older, red). It should be noted that the most recent data tend to be lower than expected since not all cases detected on these days have been reported to the RKI, yet.
Fig 6
Fig 6. Model prediction for simulated scenarios.
(a) minimal intervention: increased awareness, quarantine of known or suspected cases, testing of patients with symptoms and contact history; (b) baseline scenario: minimal intervention scenario increased with school closure, high reduction in economical activities, contact limitation, high testing activity; (c) high vigilance: baseline scenario enriched by isolation of detected cases, combined with increased testing activity; (d) educational/economic reopening: reintroducing in three phases contacts at schools, workplaces, public transportation service; (e) phase-out: rollback of all introduced control measures, up to minimal interventions, accompanied by increased testing also of asymptomatic individuals and strict isolation of identified cases; (f) cautious phase-out: similar to (e), but with slower rollback to regular activities, accompanied by strongly increased testing also of asymptomatic individuals, strict isolation of identified cases, and reduced contacts with elderly and risk groups. Solutions are shown in logarithmic scale for both new and active cases, in order to make peak heights in different orders of magnitude visible. Oscillations up to day 60 are due to the weekend-effect (Fig 4), which is relaxed for long term projections.
Fig 7
Fig 7. Model fit results and extrapolation.
The left panel shows the fits in the 3 periods, clearly indicating the ability of the model to capture the dynamics. The open circles are data points not used for the fit. Due to the inherent latency of the reporting in Germany, these points are not reliable, yet. The inset shows in addition the prediction for the sum of reported cases. Without intervention the number of infections could have surpassed ten million cases by mid April. The bands around the lines indicate the 95% confidence level of the fit based on stochastic variation of the parameters (cf. Fig 2). The right plot shows the number of individuals that require hospitalization either in the low care ward (15-20% of identified cases) indicated by the blue band or ICU (2-5% of identified cases) indicated by the orange colored band.
Fig 8
Fig 8. Evolution in time of the dominant eigenvalue of linearization of the age and stage structured model at the disease free equilibrium (DFE).
The dominant eigenvalue crossing the zero axis corresponds to the reproduction number crossing the threshold value 1.
Fig 9
Fig 9. Statistical comparison of model output for the baseline (BSL) scenario and the considered possible alternatives.
(a) Peak shifting (in days) compared to BSL; (b) Differences in reported cases (factor) at the day of the peak; (c) Differences in total detected cases (factor); (d) Differences in total deaths (factor). For all rollback scenarios, results refer to the second peak of the outbreak.

References

    1. ECDC COVID-19 European Center for Disease Prevention and Control 2020. Available online: https://www.ecdc.europa.eu/en/covid-19-pandemic (last accessed on April 2, 2020)
    1. WHO Coronavirus disease 2019 (COVID-19) Situation Report—73 World Health Organisation 2020. Available online: https://www.who.int/docs/default-source/coronaviruse/situation-reports/2...
    1. Johns Hopkins University Coronavirus Resouce Center. Johns Hopkins Center for Systems Science and Engineering 2020. Available online: https://coronavirus.jhu.edu/#covid-19-basics (last accessed on April 2, 2020)
    1. RKI Coronavirus SARS-CoV-2—dedicated homepage of the Robert Koch-Institute, Berlin, Germany 2020. Available online: https://www.rki.de/DE/Content/InfAZ/N/Neuartiges_Coronavirus/nCoV_node.html (last accessed on April 2, 2020)
    1. WHO Team Modes of transmission of virus causing COVID-19:implications for IPC precaution recommendations World Health Organisation—Department of Communication 2020. Available online: WHO Reference Number: WHO/2019-nCoV/Sci_Brief/Transmission_modes/2020.2 (last accessed on April 2, 2020)

Publication types

MeSH terms