

New label-free methods for protein relative quantification applied to the investigation of an animal model of Huntington Disease
- PMID: 32886703
- PMCID: PMC7473538
- DOI: 10.1371/journal.pone.0238037
New label-free methods for protein relative quantification applied to the investigation of an animal model of Huntington Disease
Abstract
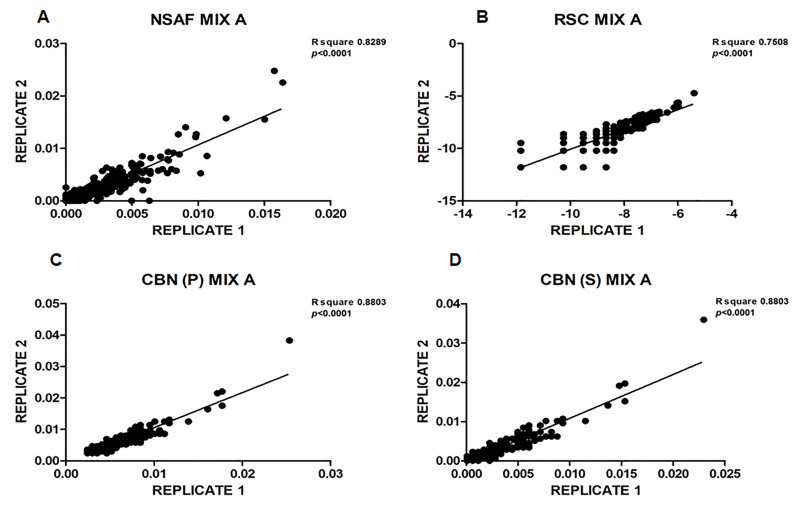
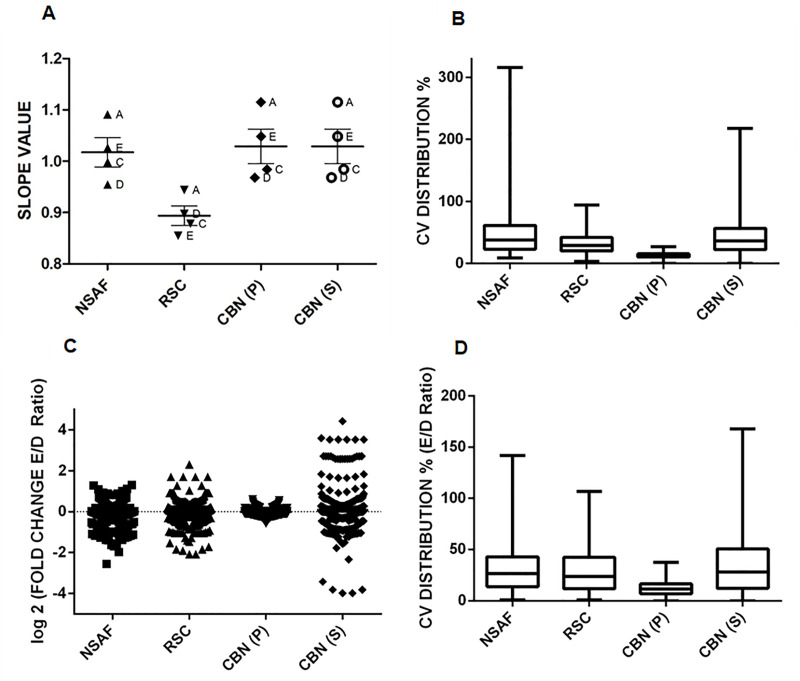
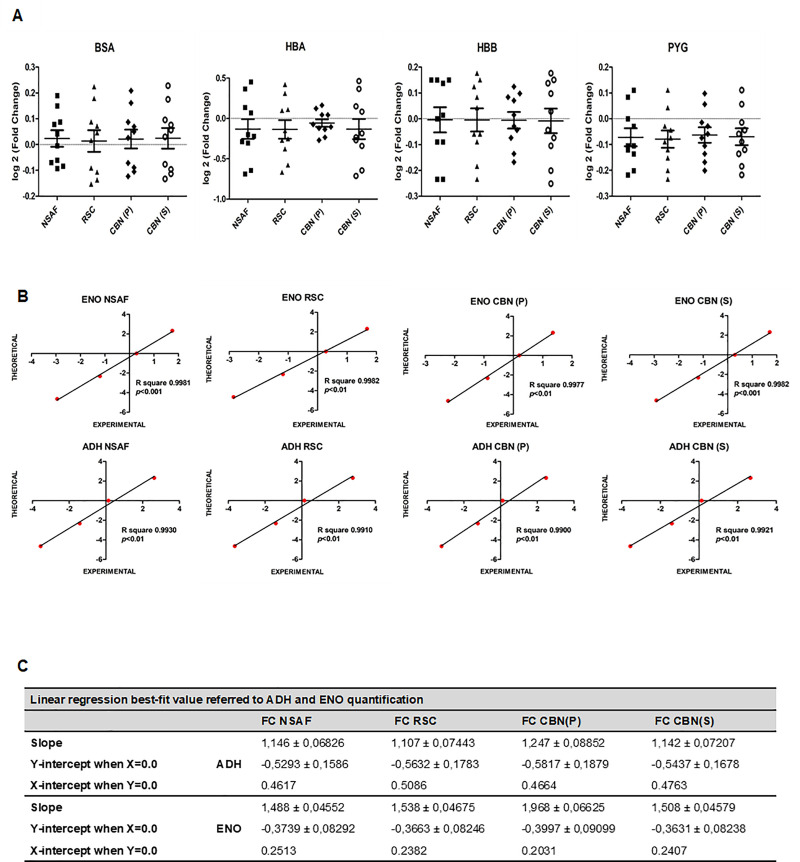
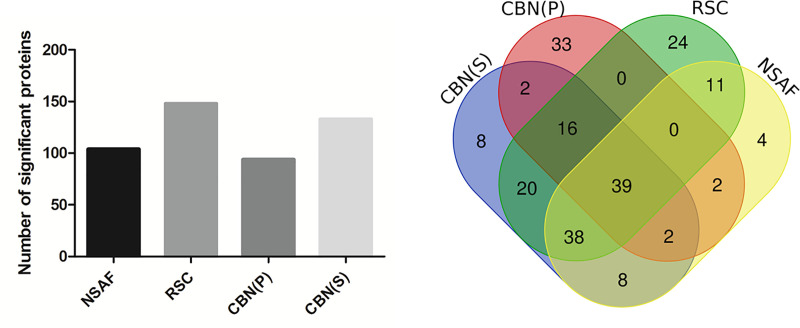
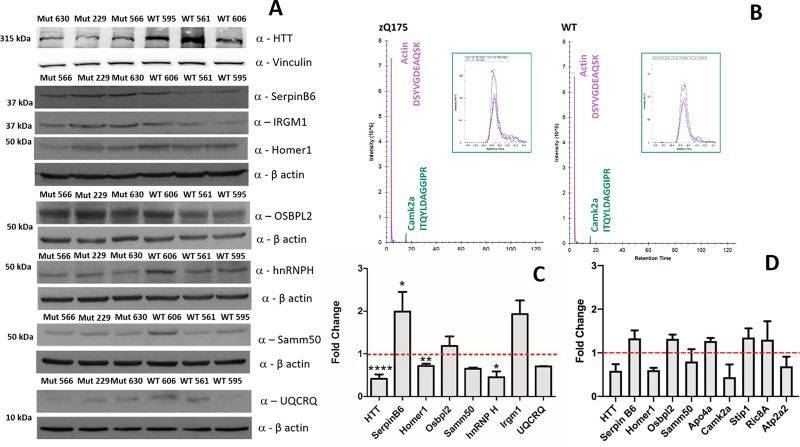
Spectral Counts approaches (SpCs) are largely employed for the comparison of protein expression profiles in label-free (LF) differential proteomics applications. Similarly, to other comparative methods, also SpCs based approaches require a normalization procedure before Fold Changes (FC) calculation. Here, we propose new Complexity Based Normalization (CBN) methods that introduced a variable adjustment factor (f), related to the complexity of the sample, both in terms of total number of identified proteins (CBN(P)) and as total number of spectral counts (CBN(S)). Both these new methods were compared with the Normalized Spectral Abundance Factor (NSAF) and the Spectral Counts log Ratio (Rsc), by using standard protein mixtures. Finally, to test the robustness and the effectiveness of the CBNs methods, they were employed for the comparative analysis of cortical protein extract from zQ175 mouse brains, model of Huntington Disease (HD), and control animals (raw data available via ProteomeXchange with identifier PXD017471). LF data were also validated by western blot and MRM based experiments. On standard mixtures, both CBN methods showed an excellent behavior in terms of reproducibility and coefficients of variation (CVs) in comparison to the other SpCs approaches. Overall, the CBN(P) method was demonstrated to be the most reliable and sensitive in detecting small differences in protein amounts when applied to biological samples.
Conflict of interest statement
The authors have declared that no competing interests exist.
Figures
Similar articles
-
Evaluation of normalization methods on GeLC-MS/MS label-free spectral counting data to correct for variation during proteomic workflows.J Am Soc Mass Spectrom. 2011 Dec;22(12):2199-208. doi: 10.1007/s13361-011-0237-2. Epub 2011 Sep 24. J Am Soc Mass Spectrom. 2011. PMID: 21952779
-
Longitudinal Small-Animal PET Imaging of the zQ175 Mouse Model of Huntington Disease Shows In Vivo Changes of Molecular Targets in the Striatum and Cerebral Cortex.J Nucl Med. 2017 Apr;58(4):617-622. doi: 10.2967/jnumed.116.180497. Epub 2016 Nov 10. J Nucl Med. 2017. PMID: 27856625
-
NSI and NSMT: usages of MS/MS fragment ion intensity for sensitive differential proteome detection and accurate protein fold change calculation in relative label-free proteome quantification.Analyst. 2012 Jul 7;137(13):3146-53. doi: 10.1039/c2an35173k. Epub 2012 May 14. Analyst. 2012. PMID: 22582177
-
The proteomic advantage: label-free quantification of proteins expressed in bovine milk during experimentally induced coliform mastitis.Vet Immunol Immunopathol. 2010 Dec 15;138(4):252-66. doi: 10.1016/j.vetimm.2010.10.004. Epub 2010 Oct 14. Vet Immunol Immunopathol. 2010. PMID: 21067814 Review.
-
Standardization approaches in absolute quantitative proteomics with mass spectrometry.Mass Spectrom Rev. 2018 Nov;37(6):715-737. doi: 10.1002/mas.21542. Epub 2017 Jul 31. Mass Spectrom Rev. 2018. PMID: 28758227 Review.
Cited by
-
Wheat Proteomics for Abiotic Stress Tolerance and Root System Architecture: Current Status and Future Prospects.Proteomes. 2022 May 22;10(2):17. doi: 10.3390/proteomes10020017. Proteomes. 2022. PMID: 35645375 Free PMC article. Review.
-
Preliminary evaluation of the proteomic profiling in the hippocampus of aged grazing cattle.Front Aging Neurosci. 2023 Oct 27;15:1274073. doi: 10.3389/fnagi.2023.1274073. eCollection 2023. Front Aging Neurosci. 2023. PMID: 37965495 Free PMC article.
-
Oncogenic Proteomics Approaches for Translational Research and HIV-Associated Malignancy Mechanisms.Proteomes. 2023 Jul 4;11(3):22. doi: 10.3390/proteomes11030022. Proteomes. 2023. PMID: 37489388 Free PMC article. Review.
-
What Antarctic Plants Can Tell Us about Climate Changes: Temperature as a Driver for Metabolic Reprogramming.Biomolecules. 2021 Jul 23;11(8):1094. doi: 10.3390/biom11081094. Biomolecules. 2021. PMID: 34439761 Free PMC article.
-
A new versatile peroxidase with extremophilic traits over-produced in MicroTom cell cultures.Sci Rep. 2023 Sep 15;13(1):15338. doi: 10.1038/s41598-023-42597-x. Sci Rep. 2023. PMID: 37714949 Free PMC article.
