. 2020 Sep 8;4(17):4180-4194.
doi: 10.1182/bloodadvances.2020002565.

AMG 701 induces cytotoxicity of multiple myeloma cells and depletes plasma cells in cynomolgus monkeys

Affiliations

AMG 701 induces cytotoxicity of multiple myeloma cells and depletes plasma cells in cynomolgus monkeys

Rebecca L Goldstein et al. Blood Adv. .

Abstract

Multiple myeloma (MM) is a hematologic malignancy that is characterized by the accumulation of abnormal plasma cells (PCs) in the bone marrow (BM). Patient outcome may be improved with BiTE (bispecific T-cell engager) molecules, which redirect T cells to lyse tumor cells. B-cell maturation antigen (BCMA) supports PC survival and is highly expressed on MM cells. A half-life extended anti-BCMA BiTE molecule (AMG 701) induced selective cytotoxicity against BCMA-expressing MM cells (average half-maximal effective concentration, 18.8 ± 14.8 pM), T-cell activation, and cytokine release in vitro. In a subcutaneous mouse xenograft model, at all doses tested, AMG 701 completely inhibited tumor formation (P < .001), as well as inhibited growth of established tumors (P ≤ .001) and extended survival in an orthotopic MM model (P ≤ .01). To evaluate AMG 701 bioactivity in cynomolgus monkeys, a PC surface phenotype and specific genes were defined to enable a quantitative digital droplet polymerase chain reaction assay (sensitivity, 0.1%). Dose-dependent pharmacokinetic and pharmacodynamic behavior was observed, with depletion of PC-specific genes reaching 93% in blood and 85% in BM. Combination with a programmed cell death protein 1 (PD-1)-blocking antibody significantly increased AMG 701 potency in vitro. A model of AMG 701 binding to BCMA and CD3 indicates that the distance between the T-cell and target cell membranes (ie, the immunological synapse) is similar to that of the major histocompatibility complex class I molecule binding to a T-cell receptor and suggests that the synapse would not be disrupted by the half-life extending Fc domain. These data support the clinical development of AMG 701.


Conflict of interest statement

Conflict-of-interest disclosure: R.L.G., C.-M.L., P.D., P.B., A. Sternjak, O.T., M.K., J.W., M. Friedrich, B.R., E.L., X.M., A. Sudom, M. Farshbaf, A.C., and T.A. are employed by Amgen Inc. or Amgen GmbH and are Amgen stockholders. A.G. and M.B. are former employees of Amgen Inc.

Figures

None
Graphical abstract
Figure 1.
Figure 1.
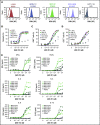
AMG 701 induced TDCC against MM cell lines in vitro. (A) Flow cytometry histograms depicting BCMA cell surface protein expression on cancer cell lines. Open graphs represent isotype staining; filled graphs represent BCMA protein staining. Numbers represent the number of BCMA molecules per cell. (B) Specific cytotoxicity of TDCC assays with BCMA protein-positive cell lines (L-363, MM1.R, MOLP-2, NCI-H929) or the BCMA protein-negative cell line (HCT-116) cocultured with human PBMCs at a 5:1 E:T ratio and increasing concentrations of AMG 701 for 48 hours. Data are mean ± standard deviation (SD) for 2 technical replicates. Curves are representative of 4 PBMC donors. Expression of CD69 (C) and CD25 (D) on T cells from TDCC assays of BCMA+ or BCMA cell lines or no target cells (PBMC), as described in panel B. Data are mean ± SD of 2 technical replicates representative of 4 PBMC donors. (E) Concentration of cytokines in supernatants of TDCC assays at the times indicated. Data represent 1 technical replicate from 1 PBMC donor. IFNγ, interferon-γ; IL-2, interleukin-2; MFI, mean fluorescence intensity; ND, not detectable; TNFα, tumor necrosis factor-α.
Figure 2.
Figure 2.
AMG 701 demonstrated antitumor activity in mouse xenograft models. (A) Tumor volumes of NOD/SCID mice injected subcutaneously with a mixture of NCI-H929 tumor cells and human PBMCs (1:2 E:T ratio) and treated with vehicle or AMG 701 (2, 0.2, and 0.02 mg/kg) on days 3, 8, and 13. Data are mean ± standard error of the mean (SEM) (n = 5, vehicle group; n = 10, all other groups). P < .001 for all dose levels from day 10 until day 23 vs vehicle + PBMC group, 1-way ANOVA with the Dunnett post hoc test. (B) PK profile of AMG 701 in mouse serum at the times indicated after the last administration on day 13. Data are mean ± SEM (n = 3). (C) Kaplan-Meier survival analysis of NOD/SCID mice orthotopically transplanted with L-363 MM cells, injected intraperitoneally with human T cells on day 5 (except for vehicle-only control), and treated with AMG 701 (0.5, 0.05, and 0.005 mg/kg) or vehicle every 5 days for 6 administrations, starting on day 9. Arrows indicate days of treatment (n = 5, vehicle group; n = 10, all other groups). **P = .007, ***P < .001 vs vehicle + T-cell group, Kaplan-Meier estimator with Mantel-Cox log-rank test. (D) Tumor volumes of SCID mice injected subcutaneously with NCI-H929 tumor cells (5E6) on day 1, intraperitoneally injected with human T cells (1.2E7) on day 8, and treated with vehicle or AMG 701 (0.25, 0.05, or 0.01 mg/kg) on days 15 and 22. Data are mean ± SEM (n = 5, vehicle group; n = 8, all other groups). ****P < .0001, ***P = .0002, 1-way ANOVA with the Dunnett post hoc test.
Figure 3.
Figure 3.
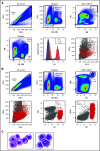
Identification of cynomolgus monkey plasma cell surface phenotype allows cell sorting. (A) Intracellular and cell surface flow cytometry analysis of cynomolgus monkey BM. PCs: CD3CD20 singlets positive for intracellular p63 and IgM (upper panels). Gating strategy to identify BM T and B lineage cells in cynomolgus monkey BM (lower left panel). Flow cytometry graphs depicting CS1 expression on PCs (red), T cells (orange), and B cells (steel blue) from cynomolgus monkey BM (lower middle panel). Forward and side scatter properties of cynomolgus monkey BM PCs (red) backgated onto the singlets (gray, lower right panel). (B) Cell surface flow cytometry analysis of CS1 and CD38 expression on cynomolgus monkey BM PCs (upper panels). Backgating of PCs (red) onto singlets depicting shape, as well as CD27, CS1, and CD138 expression (lower panels). (C) Wright Giemsa staining of a cytospin preparation of flow-sorted cynomolgus monkey PCs from 2 donors. Images taken at original magnification ×100.
Figure 4.
Figure 4.
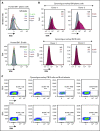
BCMA is expressed on human and cynomolgus monkey BM plasma cells but not on B cells. Flow cytometry histogramsdepicting cell surface BCMA expression levels on plasma cells and CD20+ B lineage cells from human (A) and cynomolgus monkey (B) BM. Concentrations of anti-BCMA antibody tested and corresponding mean fluorescence intensity (MFI) values are indicated. (C) Flow cytometry pseudocolor plots representing BCMA expression on cynomolgus monkey PB total B cells (TotB), naive B cells (NB), resting memory B cells (RMB), and activated memory B cells (AMB), stained with isotype control (upper panels) or BCMA antibody (lower panels). Plots are representative of 2 donors. (D) T-cell activation shown as CD69+ percentage of CD8+ cells (left panel) and autologous depletion of CD40+ B cells shown as percentage of control (right panel) in cynomolgus monkey whole blood incubated with a negative control HLE BiTE molecule, tool CD20 BiTE molecule, or AMG 701 for 48 hours. Each line represents 1 donor.
Figure 4.
Figure 4.
BCMA is expressed on human and cynomolgus monkey BM plasma cells but not on B cells. Flow cytometry histogramsdepicting cell surface BCMA expression levels on plasma cells and CD20+ B lineage cells from human (A) and cynomolgus monkey (B) BM. Concentrations of anti-BCMA antibody tested and corresponding mean fluorescence intensity (MFI) values are indicated. (C) Flow cytometry pseudocolor plots representing BCMA expression on cynomolgus monkey PB total B cells (TotB), naive B cells (NB), resting memory B cells (RMB), and activated memory B cells (AMB), stained with isotype control (upper panels) or BCMA antibody (lower panels). Plots are representative of 2 donors. (D) T-cell activation shown as CD69+ percentage of CD8+ cells (left panel) and autologous depletion of CD40+ B cells shown as percentage of control (right panel) in cynomolgus monkey whole blood incubated with a negative control HLE BiTE molecule, tool CD20 BiTE molecule, or AMG 701 for 48 hours. Each line represents 1 donor.
Figure 5.
Figure 5.
Robust depletion of BCMA mRNA indicates effective AMG 701–mediated elimination of BCMA+ cells in blood and BM of cynomolgus monkeys in vivo. (A) Mean (± standard deviation) exposure of AMG 701 in cynomolgus monkeys (n = 3 per group), represented as area under the concentration-time curve (AUC), calculated as nanomolar AMG 701 administered per day times 12 days of administration. (B) Absolute number of BCMA and J-chain mRNA transcripts in blood and BM per nanogram of RNA quantified by ddPCR predose (Pre) and on days 6 (D 6) and day 12 (D 12) postdose in cynomolgus monkeys, treated as in panel A. Numbers indicate mean percentage of depletion relative to predose. T-cell activation shown as CD69+ percentage of CD3+ cells (C) and serum concentration of interferon-γ (IFNγ; left panel) and MCP-1 (right panel) (D) over time in cynomolgus monkeys, treated as in panel A.
Figure 6.
Figure 6.
Combination with as PD-1–blocking antibody increases AMG 701 cytotoxicity in vitro. (A) Expression of PD-1 on CD3+ T cells from TDCC assays with cell lines and E:T ratios as indicated, assessed by flow cytometry at different times. Data are mean ± standard deviation (SD) of 2 technical replicates. Curves are representative of 2 human pan T-cell donors. (B) Specific cytotoxicity against KMS12BM_PDL1 (left panel) and U266B1_PDL1 (right panel) cultured for 24 hours 1:1 with CD3/CD28-activated human pan T cells and increasing concentrations of AMG 701, with (closed triangles with dark-shaded curves; mustard or magenta) or without (open triangles with light-shaded curves; yellow or lavender) 10 µg/mL PD-1–blocking antibody. Data are mean ± SD of 2 technical replicates. Curves are representative of 5 pan T-cell donors. (C) EC50 of AMG 701, with or without anti–PD-1–blocking antibody, calculated in panel B, n = 5 T-cell donors, KMS12BM_PDL1 (P = .01); U266B1_PDL1 (P = .0008); paired Student t test. Data are mean ± SD. (D) Specific cytotoxicity against KMS12BM_PDL1 and U266B1_PDL1 cultured for 96 hours at 1:5 E:T ratio with resting T cells and increasing concentrations of AMG 701, with (closed triangles with dark-shaded curves; mustard or magenta) or without (open triangles with light-shaded curves; yellow or lavender) 10 µg/mL PD-1–blocking antibody. Data are mean ± SD of 2 technical replicates, representing 1 of 2 assays. (E) Concentration of IFN-γ in supernatants collected from panel D at 72 hours, quantified by an enzyme-linked immunosorbent assay.
Figure 7.
Figure 7.
Computational model of extracellular BCMA domain in complex with AMG 701. All proteins are shown in surface representation. BCMA, orange; CD3, magenta and pink; anti-BCMA scFv, blue; anti-CD3 scFv, cyan; Fc, gray; MHC class I, dark cyan and light green; TCR, yellow and salmon. The transmembrane anchor is shown as a ribbon.

References

    1. Dimopoulos MA, Richardson PG, Moreau P, Anderson KC. Current treatment landscape for relapsed and/or refractory multiple myeloma. Nat Rev Clin Oncol. 2015;12(1):42-54. - PubMed
    1. Siegel RL, Miller KD, Jemal A. Cancer Statistics, 2017. CA Cancer J Clin. 2017;67(1):7-30. - PubMed
    1. Howlader N, Noone AM, Krapcho M, Miller D, et al. In: Cronin KA, eds. SEER Cancer Statistics Review, 1975-2016. Bethesda, MD: National Cancer Institute. (Based on November 2018 SEER data submission, posted to the SEER Web site, April 2019.) https://seercancergov/csr/1975_2016/. Accessed August 2020.
    1. Brischwein K, Schlereth B, Guller B, et al. . MT110: a novel bispecific single-chain antibody construct with high efficacy in eradicating established tumors. Mol Immunol. 2006;43(8):1129-1143. - PubMed
    1. Curran E, Stock W. Taking a “BiTE out of ALL”: blinatumomab approval for MRD-positive ALL. Blood. 2019;133(16):1715-1719. - PMC - PubMed

Publication types