. 2020 Dec 7;217(12):e20200872.
doi: 10.1084/jem.20200872.

Phenotypical and functional alteration of unconventional T cells in severe COVID-19 patients

Affiliations

Phenotypical and functional alteration of unconventional T cells in severe COVID-19 patients

Youenn Jouan et al. J Exp Med. .

Abstract

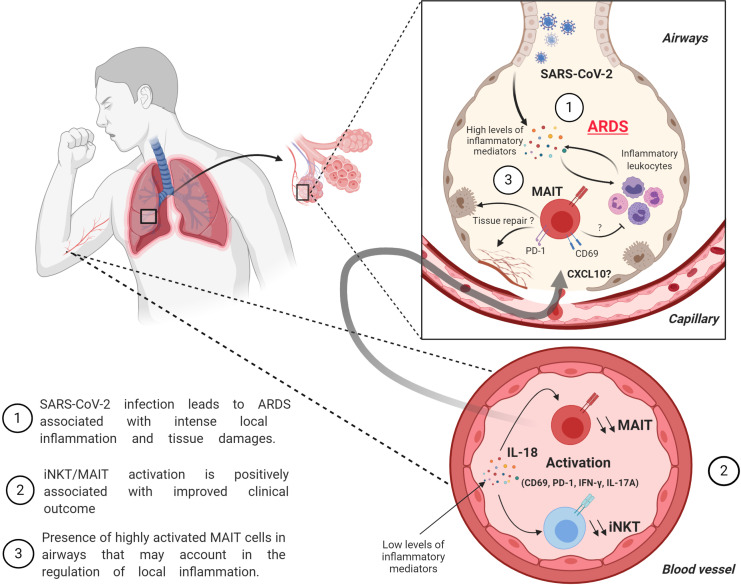
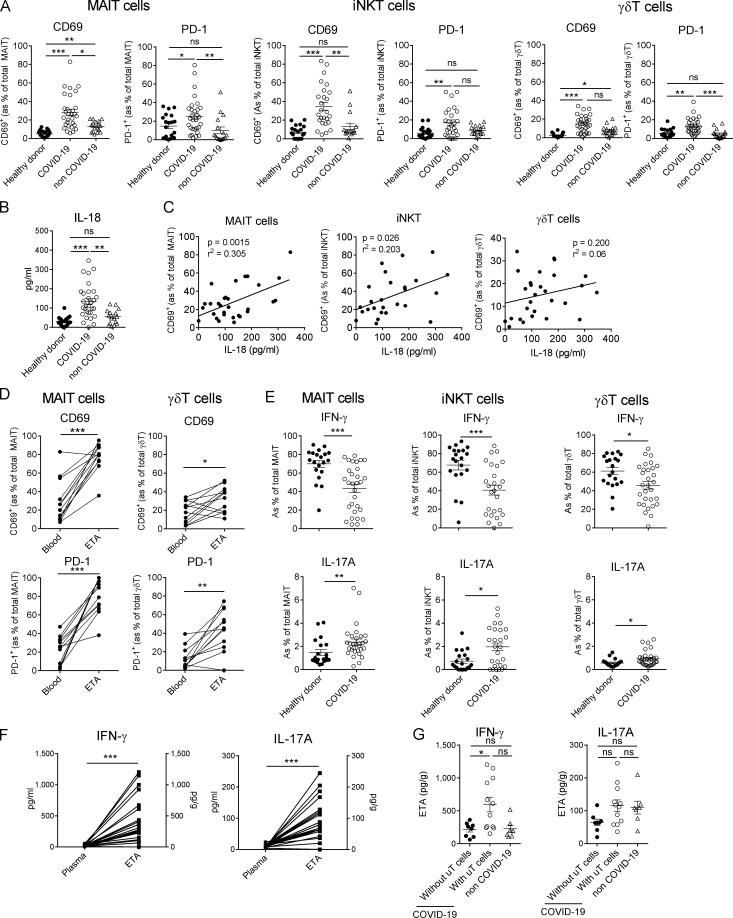
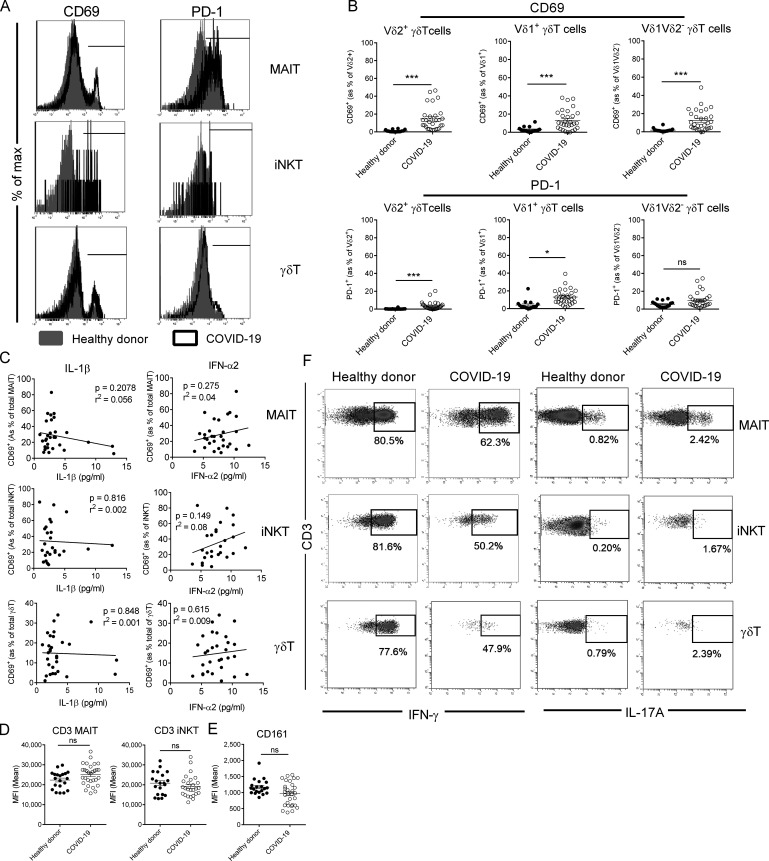
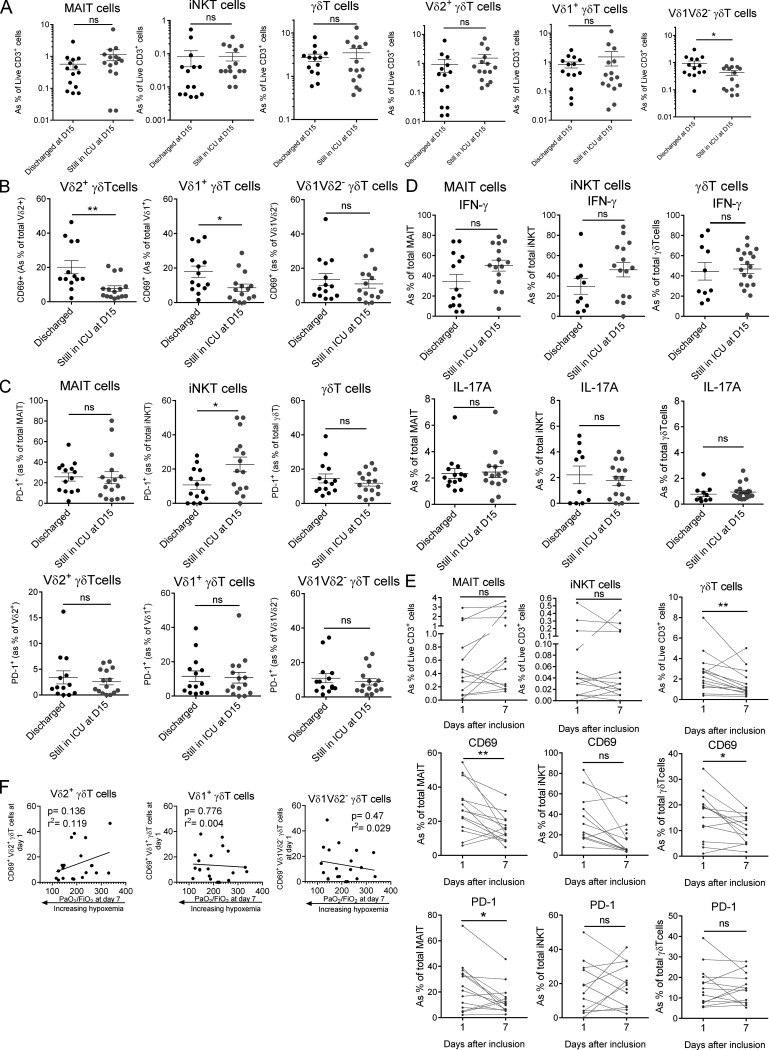
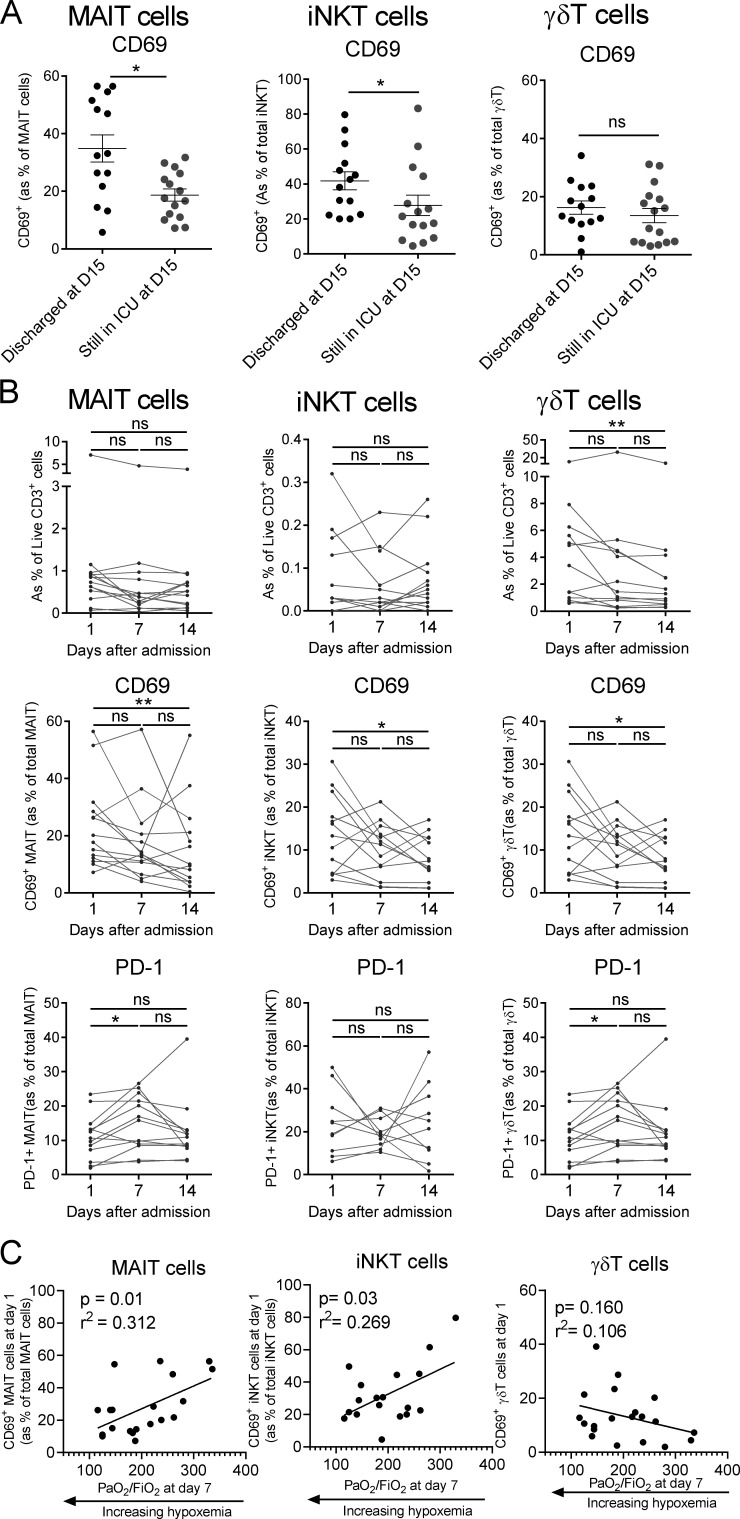
COVID-19 includes lung infection ranging from mild pneumonia to life-threatening acute respiratory distress syndrome (ARDS). Dysregulated host immune response in the lung is a key feature in ARDS pathophysiology. However, cellular actors involved in COVID-19-driven ARDS are poorly understood. Here, in blood and airways of severe COVID-19 patients, we serially analyzed unconventional T cells, a heterogeneous class of T lymphocytes (MAIT, γδT, and iNKT cells) with potent antimicrobial and regulatory functions. Circulating unconventional T cells of COVID-19 patients presented with a profound and persistent phenotypic alteration. In the airways, highly activated unconventional T cells were detected, suggesting a potential contribution in the regulation of local inflammation. Finally, expression of the CD69 activation marker on blood iNKT and MAIT cells of COVID-19 patients on admission was predictive of clinical course and disease severity. Thus, COVID-19 patients present with an altered unconventional T cell biology, and further investigations will be required to precisely assess their functions during SARS-CoV-2-driven ARDS.


Conflict of interest statement

Disclosures: S. Ehrmann reported personal fees from Aerogen, grants from Fisher & Paykel, grants from Hamilton Medical, and personal fees from La Diffusion Technique Française outside the submitted work. M. Si-Tahar reported personal fees from Cynbiose Respiratory outside the submitted work. No other disclosures were reported.

Figures

None
Graphical abstract
Figure 1.
Figure 1.
Inflammatory status of study patients. (A) Lymphocyte count in whole blood from severe COVID-19 (n = 30) and non–COVID-19 patients (n = 16; the lymphocyte count of one patient was not determined) on day 1 after admission. Individuals and means ± SEM are depicted. Dashed line represents the threshold for lymphopenia. Mann–Whitney U test. (B) SOFA score of COVID-19 (n = 30) and non–COVID-19 (n = 17) patients. Individuals and means ± SEM are shown. Mann–Whitney U test. (C) Spearman’s rank correlation of SOFA and lymphocyte counts in COVID-19 patients. (D) Levels of IL-1β, IL-6, IL-1RA, and IFN-α2 in the plasma of healthy donors (n = 20) and COVID-19 (n = 30) and non–COVID-19 (n = 16) patients. Individuals and means ± SEM are shown. Kruskal–Wallis test with Dunn's multiple comparisons test. (E) Levels of IL-1β, IL-6, IL-1RA, and IFN-α2 in the plasma and ETA supernatants of matched COVID-19 patients (n = 20). Paired individual values are shown. Wilcoxon matched-pairs signed rank test. (F) Comparison of airway levels of IL-1β, IL-6, IL-1RA, and IFN-α2 in ETA supernatants of COVID-19 (n = 20) and non–COVID-19 (n = 7) patients. Mann–Whitney U test. *, P < 0.05; **, P < 0.01; ***, P < 0.001.
Figure S1.
Figure S1.
Frequency, confounding effects, and TCR levels of T cell subsets in COVID-19 patients. (A) Frequency of circulating conventional T cells (within the lymphocyte gate) in healthy controls (n = 20) and COVID-19 (n = 30) and non–COVID-19 (n = 17) patients. Individuals and means ± SEM are shown. Kruskal–Wallis test with Dunn's multiple comparisons test. (B) Spearman’s rank correlation of age of COVID-19 patients and the frequency of blood MAIT (left panel) or iNKT (right panel) cells (n = 30). (C) Comparative analyses of MAIT and iNKT frequencies regarding the obese status (BMI > 30) of patients. Individuals and means ± SEM are shown. Mann–Whitney U test. (D) Mean intensity fluorescence (MFI) of TCR expression on MAIT and iNKT cells from controls (n = 20) or COVID-19 patients (n = 30) based on TCR Vα7.2 and PBS57-CD1d tetramer staining, respectively. Individuals and means ± SEM are shown. Mann–Whitney U test. (E and F) Comparative analysis of T cells in blood and ETA of COVID-19 (n = 20; E) or non–COVID-19 (n = 7; F) patients. Individuals and means ± SEM are shown. Wilcoxon matched-pairs signed rank test. ns, not significant; *, P < 0.05; **, P < 0.01.
Figure 2.
Figure 2.
Relative proportion of uT cells in PBMCs and ETA of COVID-19 patients. (A) Flow cytometry analyses of uT cells in the blood of healthy donors (n = 20) and COVID-19 (n = 30) and non–COVID-19 (n = 17) patients. Representative dot plots of MAIT, iNKT, and γδT cells of the three groups are shown in the left panel as percentage of CD3+ live cells. Individuals and means ± SEM are shown in the right panel. Of note, iNKT cells could not be detected in four COVID-19 patients and one non–COVID-19 patient. Kruskal–Wallis test followed by a Dunn's multiple comparisons test. (B) Proportion of γδT subsets in the blood of healthy donors (n = 20) and COVID-19 (n = 30) patients. Representative dot plots of γδT subsets are shown in the left panel. Individuals as percentage of CD3+ live cells and means ± SEM are shown in the right panel. Mann–Whitney U test. (C) Comparative analysis of MAIT and γδT cell subsets in blood and ETA of COVID-19 patients with detected uT cells in ETA. Representative dot plots are shown in the left panel. Individuals and means ± SEM are shown in the right panel. Wilcoxon matched-pairs signed rank test. (D) Levels of CXCL10 and CXCL12 in ETA supernatants of COVID-19 patients (n = 20), according to the presence (n = 12) or not (n = 8) of uT cells, and non–COVID-19 (n = 7) patients. Individuals and means ± SEM are shown. Mann–Whitney U test. *, P < 0.05; **, P < 0.01; ***, P < 0.001. ns, not significant.
Figure 3.
Figure 3.
Functional analysis of uT cells during severe COVID-19. (A) Flow cytometry analyses of CD69 and PD-1 expression on MAIT, γδT, and iNKT cells in the blood of healthy donors (n = 20) and COVID-19 (n = 30) and non–COVID-19 (n = 17) patients. Individuals and means ± SEM are shown. Kruskal–Wallis test followed by a Dunn's multiple comparisons test. (B) Levels of IL-18 in the plasma of healthy donors (n = 20) and COVID-19 (n = 30) and non–COVID-19 (n = 17) patients. Individuals and means ± SEM are shown. Kruskal–Wallis test followed by a Dunn's multiple comparisons test. (C) Spearman’s rank correlation of CD69 expression on blood uT cells and levels of IL-18 in COVID-19 patients. (D) Relative proportions of CD69+ and PD-1+ MAIT and γδT cells in the blood and ETA of matched patients. Paired individual values are shown. Wilcoxon matched-pairs signed-rank test. (E) Intracellular staining for IFN-γ and IL-17A of PMA/ionomycin-activated PBMCs. Individuals and means ± SEM are shown. Mann–Whitney U test. (F) Levels of IFN-γ and IL-17A in the plasma and ETA supernatants of matched patients. Paired individual values are shown. Wilcoxon matched-pairs signed rank test. (G) Levels of IFN-γ and IL-17A in the ETA supernatants of COVID-19 patients, according to the presence (n = 12) or not (n = 8) of uT cells, and non–COVID-19 patients. Kruskal–Wallis test followed by a Dunn's multiple comparisons test. *, P < 0.05; **, P < 0.01; ***, P < 0.001. ns, not significant.
Figure S2.
Figure S2.
Phenotype and cytokine production of blood uT cells in COVID-19 patients. (A) Representative histogram plots of CD69 and PD-1 expression on uT cell subsets in healthy controls and COVID-19 patients. (B) Flow cytometry analyses of CD69 (upper panel) and PD-1 (lower panel) expression on γδT subsets in the blood of healthy donors (n = 20) and COVID-19 patients (n = 30). Individuals and means ± SEM are shown. Mann–Whitney U test. (C) Spearman’s rank correlation of CD69 expression on blood uT cells and levels of IL-1β or IFN-α2 in COVID-19 patients. (D) Mean intensity fluorescence (MFI) of CD3 expression on MAIT and iNKT cells from healthy controls (n = 20) and COVID-19 patients (n = 30). Individuals and means ± SEM are shown. Mann–Whitney U test. (E) Mean intensity fluorescence of CD161 expression on MAIT cells from healthy controls (n = 20) and COVID-19 patients (n = 30). Individuals and means ± SEM are shown. Mann–Whitney U test. (F) Representative dot plots of intracellular staining for IFN-γ (left panel) and IL-17A (right panel) of blood iT cells from healthy donors and COVID-19 patients following PMA/ionomycin activation. *, P < 0.05; ***, P < 0.001. ns, not significant.
Figure S3.
Figure S3.
Analysis of uT cell biological parameters regarding the clinical evolution of COVID-19 patients. (A) Comparative analyses of the frequencies of blood MAIT, iNKT, and γδT subsets in COVID-19 patients who were discharged (n = 14) or not discharged (n = 15) from ICU at day 14. Individuals and means ± SEM are shown. Mann–Whitney U test. (B) Comparative analyses of the CD69 expression of blood γδT subsets in COVID-19 patients who were discharged (n = 14) or not discharged (n = 15) from ICU at day 14. Individuals and means ± SEM are shown. Mann–Whitney U test. (C) Comparative analyses of PD-1 expression on blood MAIT, iNKT, and γδT subsets in COVID-19 patients who were discharged (n = 14) or not discharged (n = 15) from ICU at day 14. Individuals and means ± SEM are shown. Mann–Whitney U test. (D) Comparative analysis of IFN-γ and IL-17A production by uT cells in COVID-19 patients who were discharged (n = 14) or not discharged (n = 15) from ICU at day 14. Individuals and means ± SEM are shown. Mann–Whitney U test. (E) Kinetics plots showing individual values of uT cell frequency and phenotype for each rapidly discharged (before day 15) patients (n = 14) at days 1 and 7 after admission. Wilcoxon matched-pairs signed rank test. (F) Spearman’s rank correlation of CD69 expression on blood γδT subsets on admission and hypoxemia levels at day 7 in COVID-19 patients (n = 20). *, P < 0.05; **, P < 0.01. ns, not significant.
Figure 4.
Figure 4.
Predictive role and kinetics analysis of uT cell parameters in the clinical course of COVID-19. (A) Comparative analyses of CD69 expression on blood MAIT, γδT, and iNKT cells in COVID-19 patients who were discharged (n = 14) or not discharged (n = 15) from ICU at day 14. Individuals and means ± SEM are shown. Mann–Whitney U test. (B) Kinetics plots showing individual values of uT cell frequency and phenotype at days 1, 7, and 14 after admission for each patient still in critical condition at day 14 (n = 13). One-way ANOVA (Friedman test) with Dunn’s multiple comparison. (C) Spearman’s rank correlation of CD69 expression on blood uT cells on admission and hypoxemia levels at day 7 in COVID-19 patients (n = 20). *, P < 0.05; **, P < 0.01; ***, P < 0.001. ns, not significant.

Comment in

References

    1. Bonneville M., O’Brien R.L., and Born W.K.. 2010. Gammadelta T cell effector functions: a blend of innate programming and acquired plasticity. Nat. Rev. Immunol. 10:467–478. 10.1038/nri2781 - DOI - PubMed
    1. Chen G., Wu D., Guo W., Cao Y., Huang D., Wang H., Wang T., Zhang X., Chen H., Yu H., et al. . 2020. Clinical and immunological features of severe and moderate coronavirus disease 2019. J. Clin. Invest. 130:2620–2629. 10.1172/JCI137244 - DOI - PMC - PubMed
    1. Constantinides M.G., Link V.M., Tamoutounour S., Wong A.C., Perez-Chaparro P.J., Han S.J., Chen Y.E., Li K., Farhat S., Weckel A., et al. . 2019. MAIT cells are imprinted by the microbiota in early life and promote tissue repair. Science. 366 eaax6624 10.1126/science.aax6624 - DOI - PMC - PubMed
    1. Crosby C.M., and Kronenberg M.. 2016. Invariant natural killer T cells: front line fighters in the war against pathogenic microbes. Immunogenetics. 68:639–648. 10.1007/s00251-016-0933-y - DOI - PMC - PubMed
    1. Crosby C.M., and Kronenberg M.. 2018. Tissue-specific functions of invariant natural killer T cells. Nat. Rev. Immunol. 18:559–574. 10.1038/s41577-018-0034-2 - DOI - PMC - PubMed

Publication types

MeSH terms