. 2021 Apr 1;31(3):243-259.
doi: 10.1093/glycob/cwaa086.

A phylogenetic view and functional annotation of the animal β1,3-glycosyltransferases of the GT31 CAZy family

Affiliations

A phylogenetic view and functional annotation of the animal β1,3-glycosyltransferases of the GT31 CAZy family

Daniel Petit et al. Glycobiology. .

Abstract

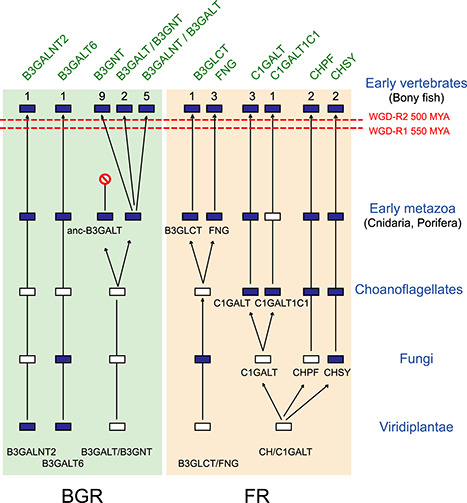
The formation of β1,3-linkages on animal glycoconjugates is catalyzed by a subset of β1,3-glycosyltransferases grouped in the Carbohydrate-Active enZYmes family glycosyltransferase-31 (GT31). This family represents an extremely diverse set of β1,3-N-acetylglucosaminyltransferases [B3GNTs and Fringe β1,3-N-acetylglucosaminyltransferases], β1,3-N-acetylgalactosaminyltransferases (B3GALNTs), β1,3-galactosyltransferases [B3GALTs and core 1 β1,3-galactosyltransferases (C1GALTs)], β1,3-glucosyltransferase (B3GLCT) and β1,3-glucuronyl acid transferases (B3GLCATs or CHs). The mammalian enzymes were particularly well studied and shown to use a large variety of sugar donors and acceptor substrates leading to the formation of β1,3-linkages in various glycosylation pathways. In contrast, there are only a few studies related to other metazoan and lower vertebrates GT31 enzymes and the evolutionary relationships of these divergent sequences remain obscure. In this study, we used bioinformatics approaches to identify more than 920 of putative GT31 sequences in Metazoa, Fungi and Choanoflagellata revealing their deep ancestry. Sequence-based analysis shed light on conserved motifs and structural features that are signatures of all the GT31. We leverage pieces of evidence from gene structure, phylogenetic and sequence-based analyses to identify two major subgroups of GT31 named Fringe-related and B3GALT-related and demonstrate the existence of 10 orthologue groups in the Urmetazoa, the hypothetical last common ancestor of all animals. Finally, synteny and paralogy analysis unveiled the existence of 30 subfamilies in vertebrates, among which 5 are new and were named C1GALT2, C1GALT3, B3GALT8, B3GNT10 and B3GNT11. Altogether, these various approaches enabled us to propose the first comprehensive analysis of the metazoan GT31 disentangling their evolutionary relationships.

Keywords: evolution; functional genomics; molecular phylogeny; motifs; β1,3-glycosyltransferases.


Figures

Fig. 1
Fig. 1
Glycan structures and pathways involving B3GTs of the CAZy family GT31. GT31-related enzymes indicated in green letters are involved in various glycosylation pathways: (A) glycolipid core extension, (B) O-glycosylproteins core extension and (C) elongation of glycoconjugates. The glycan structures formed are represented using the symbol nomenclature for graphical representation of glycans (SNFG) (Neelamegham et al. 2019) with DrawGlycan-SNFG (Cheng et al. 2017) and their names are indicated in red.
Fig. 2
Fig. 2
Schematic depicting the genomic organization of the 30 GT31 vertebrate genes. The exon/intron organization of the 26 human (capital letters) and 4 additional vertebrate (lower case letters) B3GT genes is represented. The B3GNT10-P is found in the human genome on chromosome 9q33.2 but is likely not translated in an active enzyme. Family name is indicated on the left side. Coding exons are represented by rectangles according to their relative sizes. The gray boxes denote the presence of inserted exons in B3GALNT2 and presence of additional protein domain in B3GLCT (FRINGE-domain) and CH (CHGN domain)-related proteins. The five conserved peptide motifs characteristic of all the GT31-related proteins are represented by black lines above the boxes. The location of nonconserved GT31 signatures is indicated by gray lines above the boxes. Each subfamily name is indicated on the right side. In addition, chromosome location in the human genome and human protein length are given on the right side of the figure; when the human gene and/or protein is absent, its closest vertebrate relative is represented in blue. The inactive proteins, e.g., chaperone C1GALT1C1, CHPF and CHPF2, are indicated in green. A similar genomic organization is found in each orthologue group, and it is conserved in all the vertebrate species with the exception of B3GNT3 genes split into two exons in Amniotes genome.
Fig. 3
Fig. 3
Schematic representation of the 5 conserved motifs of the GT31 sequences. (A) The vertebrate GT31 protein sequences used are those mentioned in Supplemental Figure 2 and Supplemental Figure 3. Briefly, 170 GT31 vertebrate sequences were selected and aligned using the multiple sequence alignment tool Clustal W in MEGA 7.0 (Kumar et al. 2016) (Supplemental Data 2). Identification of the five signature motifs among GT31 homologues and a graphical representation of aa residue conservation at each position of the multiple alignments were obtained using the Berkeley WebLogo tool (Crooks et al. 2004). The letter size is proportional to the degree of aa conservation. The relative position of the 5 motifs noted I, II, III, IV and V is schematized below. (B) Structural representation of known and predicted sequence motifs. Ribbon representation of the mouse MFNG structure (PDB: 2J0A) with sequence motifs shown in colors: I (red), II (blue), III (green), IV (violet) and V (orange). The UDP molecule is shown in black in stick representation. Molecular representation and structural analyses were performed with the UCSF ChimeraX (Goddard et al. 2018).
Fig. 4
Fig. 4
ML phylogenetic tree of 62 GT31-related sequences from Metazoa, Fungi and Viridiplantae. An ML phylogenetic tree was constructed in MEGA 7.0 based on the JTT + G matrix-based model (Kumar et al. 2016). A discrete gamma distribution was used to model evolutionary rate differences among sites [five categories (+G, parameter = 1.9932)]. The rate variation model allowed for some sites to be evolutionarily invariable ([+I], 0.00% sites). Sixty-two GT31 sequences limited to their Galactosyl_T domain (PF01762) or FRINGE domain (PF02434) from the Metazoa Bos taurus (Bostau), Homo sapiens (Homsap), L. chalumnae (Latcha), Mus musculus (Musmus), Pan troglodytes (pantro), from the Viridiplantae A. glauca (Absgla), A. thaliana (Aratha), Morus notabilis (Mornot), P. patens (Phymit), and from the fungi A. wentii (Aspwen), B. meristosporus (Basmer), C. leucostoma (Cytleu), M. verticillata (Morver), R. azygosporus (Rhiazy), R. graminis (Rhogra), S. punctatus (Spipun), S. racemosum (Synrac), T. marneffei (Talmar), W. mellicola (Walmel), Xylaria grammica (Xylgram) and the human B4GALNT2 (GT12), B4GALT1 (GT7), B4GALT2 (GT7), A4GALT or Gb3 synthase (GT32) and bovine GGTA1 (GT6) sequences used as the outgroup were selected for multiple sequence alignments performed with MUSCLE in MEGA vers. 7.0 (Kumar et al. 2016) (Supplemental Data 1 for more sequence information and Supplemental Data 2 for multiple sequence alignment). There were a total of 534 positions in the final dataset. Bootstrap values over 50%, obtained from 500 replicates, were indicated on the corresponding branches. The topology of the ML tree indicates two deeply rooted branches corresponding to the subgroups FR and BGR and several clades previously described (Egelund et al. 2010). Four clades, e.g., clades 1, 7, 10 and 11 are plant specific and seven clades (e.g., clades 2–6 and clades 8–9) gather nonplant sequences. The nine metazoan GT31 orthologue groups are split into two subgroups, the FR subgroup comprised of FNG (clade 3), CHPF and CHSY (clade 4), B3GLCT (clade 2) and C1GALT (clade 5) on one hand, and the BGR comprised of the B3GALT/B3GNT (clade 8), B3GALT6 (clade 7) and B3GALNT2 (clade 10), on the other hand. Two new clades restricted to Viridiplantae, e.g., clade 1b and clade 7b are evidenced in this ML tree. The metazoan B3GALT6 and B3GALNT2 are associated, respectively, to plant clades 7 and 10. Representative domain organizations of the eukaryotic GT31 proteins are schematized. SMART (Letunic and Bork 2018; Letunic et al. 2015) showed that the eukaryotic GT31 proteins are multidomain proteins containing a combination of either a Galactosyl_T domain (PF01762, pink box) or a FRINGE domain (PF02434, pink circle and pentagon) and an additional functional X domain. The X domain coupled to the Galactosyl_T domain can be the DUF4094 domain (PF13334, yellow triangle), the galactose-binding domain Gal-bind_lectin (PF00337, blue triangle) or the N-glycosylation protein domain EOS1 (PF12326, light pink diamond). No X domain is found in the metazoan B3GALT6, B3GALNT2, B3GALT/B3GNT and the plant GALT (clade 10). Two FR domains (PF02434) named here FRINGE1 and FRINGE2 are encountered in GT31 domain architecture. FRINGE1 (pink circle) is associated to an X domain DUF604 (PF04646, red triangle) in the plant GT31clade 1, to another FRINGE1 domain in B3GLCT (clade 2, a and b pink circles) or the X domain can be lost as in FNG and plant GT31 clade 3. FRINGE2 domain (pink pentagon) is associated to a CHGN domain (PF05679, green square) in metazoan CH sequences of clade 4 or the X domain can be lost as in C1GALT (clade 5).
Fig. 5
Fig. 5
Evolutionary scenario of the metazoan GT31 sequences. This schematic depicts a model for the evolution of the eight orthologues groups (CHPF, CHSY, FNG, C1GALT/C1GALT1C1, B3GALT/B3GNT, B3GALT6, B3GALNT2, B3GLCT) of the BGR and FR clusters in the Viridiplantae, Fungi and early metazoan lineages. This model is based on evidences from phylogenetic analysis and it takes into account the two rounds of WGD-2R (WGD-R1 550 MYA and WGD-R2 500 MYA) that took place early in the vertebrate lineage. It suggests the existence of 10 orthologue groups in early metazoans, 9 of which could be identified in extant early metazoan, e.g., Porifera and Cnidaria. The dark blue-colored boxes indicate the presence of the gene, whereas the white-colored boxes represent gene loss. The numbers of vertebrate subfamilies are indicated above boxes.
Fig. 6
Fig. 6
Protein SSN of metazoan GT31 sequence. The full-length protein sequences listed in supplementary data 1 were used to generate the SSN (Atkinson et al. 2009) visualized with Cytoscape. The sequences are represented as nodes colored according to the subfamily to which they belong. The lines between two nodes are drawn if the BLAST E-value is below a given threshold. (A) The network is composed of 990 GT31-related sequences, the E-value threshold = 1E−29, which corresponds to ~ 30% of sequence identity. B3GALNT2 and B3GALT6 sequences are well separated, FNG and B3GLCT sequences form two distinct clusters, whereas C1GALT1C1 and C1GALT on one hand, and CHPF and CHSY on the other are found in the same cluster. Finally, all the B3GNT (dark pink) and B3GALT (dark green) sequences merge in one cluster. This latter B3GNT/B3GALT cluster boxed with dashed lines was further investigated at more stringent thresholds to visualize subfamilies. (B) A subnetwork composed of 485 sequences of B3GNT and B3GALT at E-value threshold = 1E−55 (~35% sequence identity) and a subnetwork at E-value threshold = 1E−75 (~40% sequence identity) (C) are shown. The “B3GNT” cluster (pink) comprises B3GNT sequences of invertebrates and lampreys, and sequences from the subfamilies B3GNT2, B3GNT3, B3GNT4, B3GNT6, B3GNT7, B3GNT8, B3GNT9, B3GNT11. Interestingly, B3GNT5 sequences form a distinct cluster (yellow), whereas B3GNT10 and B3GALT4 sequences are part of the same connected component where three pure clusters are observed (i.e., B3GNT10, five fish B3GALT4 and the rest of B3GALT4 tetrapod sequences forming a sparse cluster). Besides the B3GALT5 (blue), B3GALT8 (orange) and B3GALNT1 (light blue), the “B3GALT” cluster includes B3GALT1 (light yellow) and B3GALT2 (light green) sequences. B3GALT singletons (green disconnected nodes) correspond to invertebrates, fungi and Viridiplantae sequences.
Fig. 7
Fig. 7
Evolutionary relationships of vertebrate C1GALT: (A) Molecular phylogenetic analysis by ML method of the C1GALTs. The evolutionary history was inferred by using the ML method based on the JTT matrix-based model in MEGA 7.0 (Kumar et al. 2016). The ML tree is drawn to scale, with branch lengths measured in the number of substitutions per site. The analysis involved 37-aa sequences (sequence information of the eight invertebrate C1GALT, three vertebrate C1GALT3, two lampreys C1GALTs, 10 C1GALT1, six vertebrate C1GALT2, four Teleost C1GALT2-r1 and four C1GALT2-r2 sequences can be found in Supplementary Data). There were a total of 384 positions in the final dataset. (B) Synteny relationships around the c1galt gene loci in vertebrate genomes. The schematic indicates the chromosome localizations of the c1galt1, c1galt2 and c1galt3 in the human (H. sapiens, Hsa), the mouse (M. musculus, Mmu), the chicken (Gallus gallus, Gga), the lizard (Podarcis muralis, Pmur), the coelacanth (L. chalumnae, Lcha), the spotted gar (Lepisosteus oculatus, Locu), the Japanese medaka (O. latipes, Ola) and the reedfish (Erpetoichthys calabaricus, Erpcal). The c1galt genes (e.g., c1galt1, c1galt2 and c1galt3) are indicated in red when present on the chromosome or in gray when lost from the genomic region. The putative orthologues were retrieved from the NCBI and ENSEMBL servers using chromosome walking and reciprocal tblastn and also the latest ENSEMBL dataset (ENS70) at the synteny database site (http://teleost.cs.uoregon.edu/synteny_db/) (Catchen et al. 2009) and they were visualized using the Genomicus 93.01 website (Louis et al. 2012). Conserved neighboring gene loci are indicated in black and those loci in the vicinity of c1galt genes belonging to fish-specific paralogons are indicated in green.
Fig. 8
Fig. 8
Scenario illustrating the evolutionary history of BGRb cluster in vertebrates. For each subcluster (BGRb1: B3GALT2, B3GALT8, B3GALNT1, B3GALT5 and B3GALT1; BGRb2: B3GNT10 and B3GALT4; BGRb3: B3GNT4, B3GNT9, B3GNT7, B3GNT11, B3GNT2, B3GNT8, B3GNT6, B3GNT3 and B3GNT5), the duplication events are localized relatively to the two rounds of WGD-2R that occurred in early vertebrates and the one specific to teleost fishes (TGD). The presence (full dark blue boxes) or loss (full white boxes) of genes in the major vertebrate branches is indicated. In addition, B3GT genes present in some vertebrate species but not all are indicated by dashed light blue boxes. Association of BGRb subfamilies to the ancestral protochromosomes of vertebrates VAC A and VAC F are indicated above in purple letters. In Bilateria and in Deuterostoma, tandem duplications that likely occurred before the WGD-2R events are boxed, whereas the remaining duplication events are of unknown origin.

References

    1. Altschul SF, Madden TL, Schaffer AA, Zhang J, Zhang Z, Miller W, Lipman DJ. 1997. Gapped BLAST and PSI-BLAST: A new generation of protein database search programs. Nucleic Acids Res. 25:3389–3402. - PMC - PubMed
    1. Amado M, Almeida R, Carneiro F, Levery SB, Holmes EH, Nomoto M, Hollingsworth MA, Hassan H, Schwientek T, Nielsen PA et al. 1998. A family of human β3-galactosyltransferases: Characterization of four members of a UDP-galactose:β-N-acetyl-glucosamine/β-N-acetyl-galactosamine β-1,3-galactosyltransferase family. J Biol Chem. 273:12770–12778. - PubMed
    1. Amores A, Force A, Yan YL, Joly L, Amemiya C, Fritz A, Ho RK, Langeland J, Prince V, Wang YL et al. 1998. Zebrafish hox clusters and vertebrate genome evolution. Science. 282:1711–1714. - PubMed
    1. Aryal RP, Ju T, Cummings RD. 2014. Identification of a novel protein binding motif within the T-synthase for the molecular chaperone Cosmc. J Biol Chem. 289:11630–11641. - PMC - PubMed
    1. Atkinson HJ, Morris JH, Ferrin TE, Babbitt PC. 2009. Using sequence similarity networks for visualization of relationships across diverse protein superfamilies. PLoS One. 4:e4345. - PMC - PubMed

Publication types

Substances