An Experimentally Defined Hypoxia Gene Signature in Glioblastoma and Its Modulation by Metformin
- PMID: 32887267
- PMCID: PMC7563149
- DOI: 10.3390/biology9090264
An Experimentally Defined Hypoxia Gene Signature in Glioblastoma and Its Modulation by Metformin
Abstract
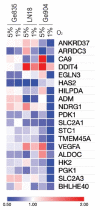
Glioblastoma multiforme (GBM) is the most common and aggressive primary brain tumor, characterized by a high degree of intertumoral heterogeneity. However, a common feature of the GBM microenvironment is hypoxia, which can promote radio- and chemotherapy resistance, immunosuppression, angiogenesis, and stemness. We experimentally defined common GBM adaptations to physiologically relevant oxygen gradients, and we assessed their modulation by the metabolic drug metformin. We directly exposed human GBM cell lines to hypoxia (1% O2) and to physioxia (5% O2). We then performed transcriptional profiling and compared our in vitro findings to predicted hypoxic areas in vivo using in silico analyses. We observed a heterogenous hypoxia response, but also a common gene signature that was induced by a physiologically relevant change in oxygenation from 5% O2 to 1% O2. In silico analyses showed that this hypoxia signature was highly correlated with a perinecrotic localization in GBM tumors, expression of certain glycolytic and immune-related genes, and poor prognosis of GBM patients. Metformin treatment of GBM cell lines under hypoxia and physioxia reduced viable cell number, oxygen consumption rate, and partially reversed the hypoxia gene signature, supporting further exploration of targeting tumor metabolism as a treatment component for hypoxic GBM.
Keywords: glioblastoma; glioblastoma microenvironment; hypoxia; hypoxia gene signature; metformin; physioxia.
Conflict of interest statement
The authors declare no conflict of interest. The funders had no role in the design of the study; in the collection, analyses, or interpretation of data; in the writing of the manuscript, or in the decision to publish the results.
Figures


References
-
- Louis D.N., Perry A., Reifenberger G., von Deimling A., Figarella-Branger D., Cavenee W.K., Ohgaki H., Wiestler O.D., Kleihues P., Ellison D.W. The 2016 World Health Organization Classification of Tumors of the Central Nervous System: A summary. Acta Neuropathol. 2016;131:803–820. doi: 10.1007/s00401-016-1545-1. - DOI - PubMed
-
- Verhaak R.G., Hoadley K.A., Purdom E., Wang V., Qi Y., Wilkerson M.D., Miller C.R., Ding L., Golub T., Mesirov J.P., et al. Integrated genomic analysis identifies clinically relevant subtypes of glioblastoma characterized by abnormalities in PDGFRA, IDH1, EGFR, and NF1. Cancer Cell. 2010;17:98–110. doi: 10.1016/j.ccr.2009.12.020. - DOI - PMC - PubMed
-
- Phillips H.S., Kharbanda S., Chen R., Forrest W.F., Soriano R.H., Wu T.D., Misra A., Nigro J.M., Colman H., Soroceanu L., et al. Molecular subclasses of high-grade glioma predict prognosis, delineate a pattern of disease progression, and resemble stages in neurogenesis. Cancer Cell. 2006;9:157–173. doi: 10.1016/j.ccr.2006.02.019. - DOI - PubMed
Grants and funding
LinkOut - more resources
Full Text Sources

