

In-Service Detection and Quantification of Railway Wheel Flat by the Reflective Optical Position Sensor
- PMID: 32887346
- PMCID: PMC7506649
- DOI: 10.3390/s20174969
In-Service Detection and Quantification of Railway Wheel Flat by the Reflective Optical Position Sensor
Abstract
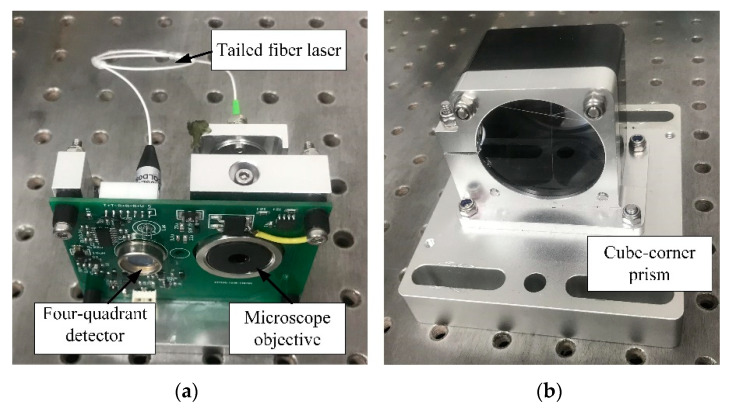
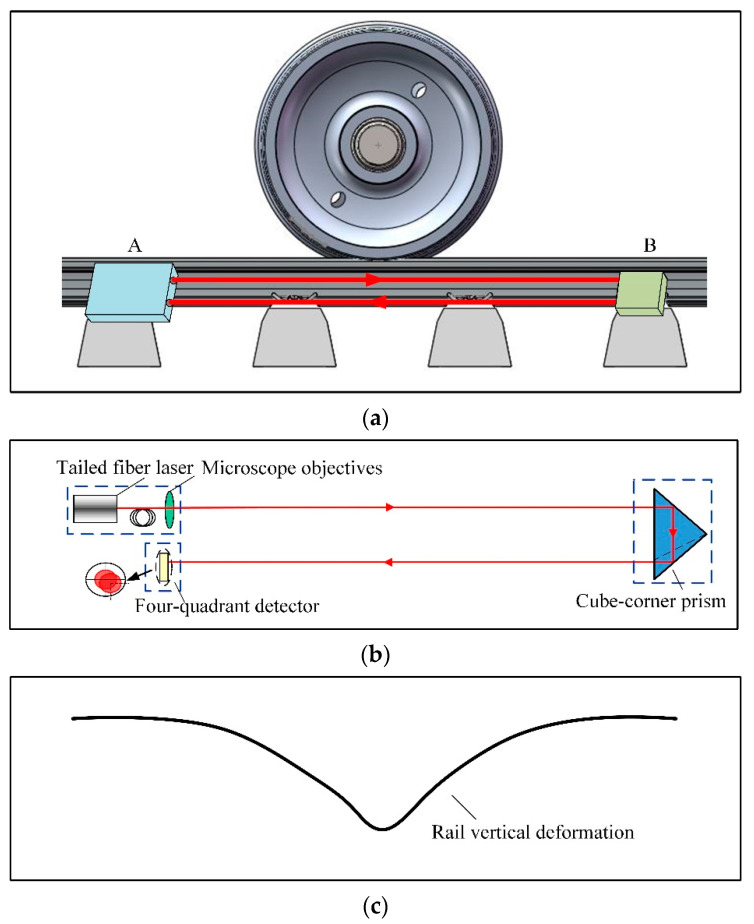
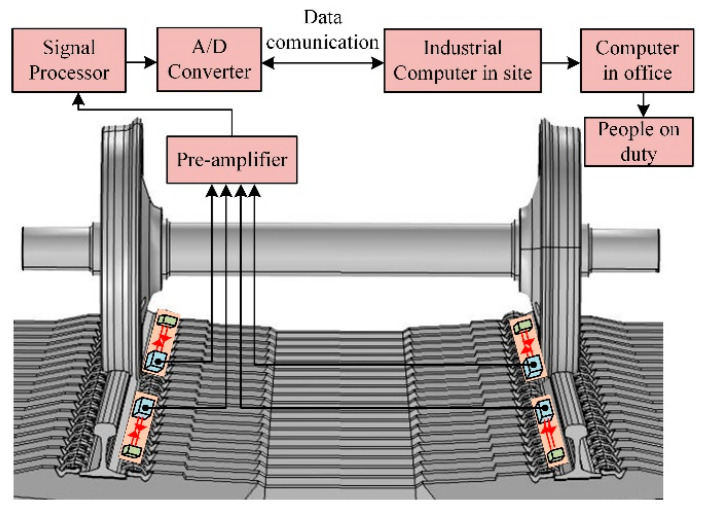
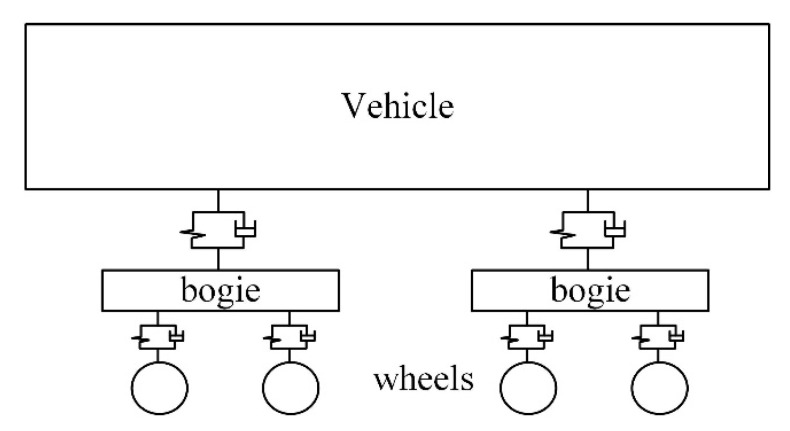
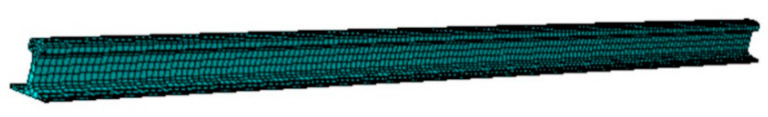
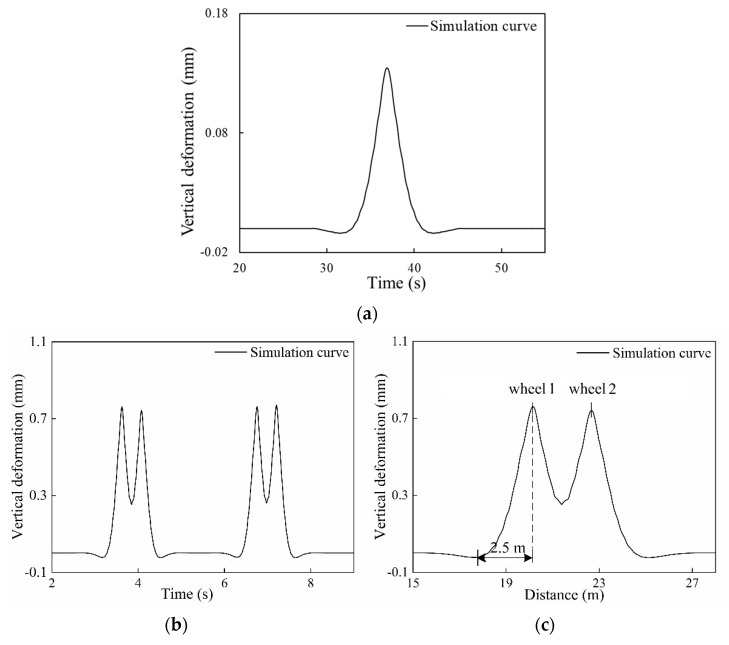
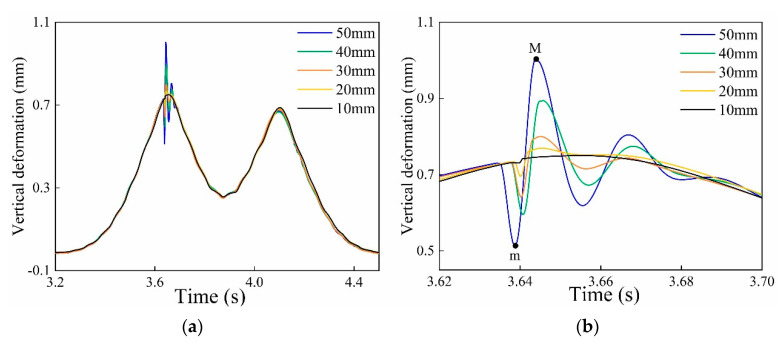
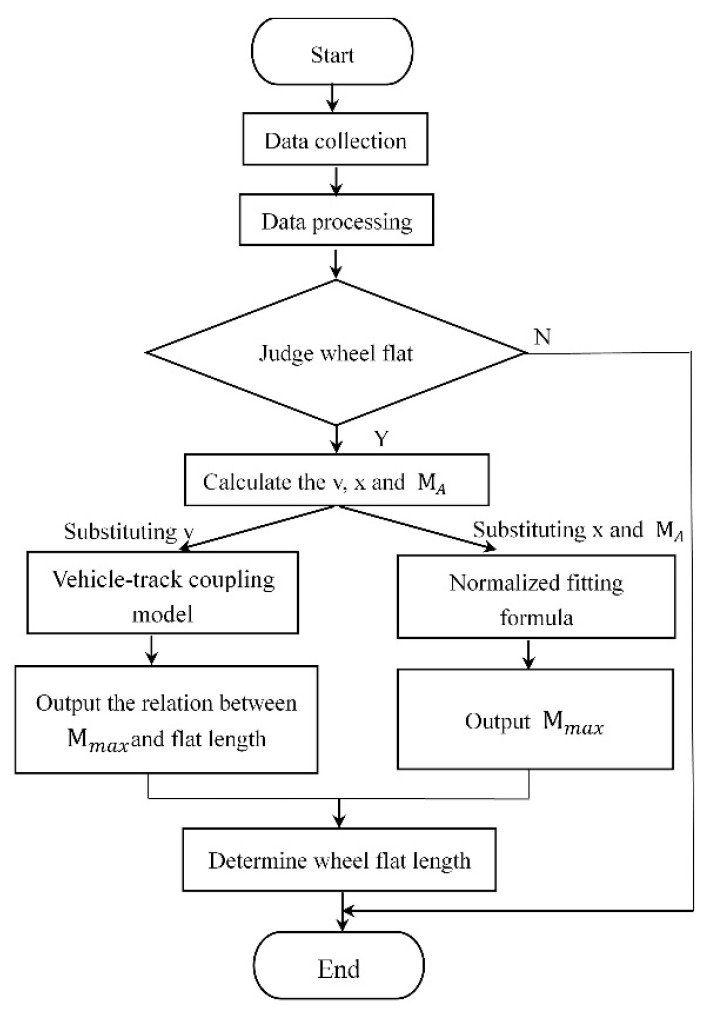
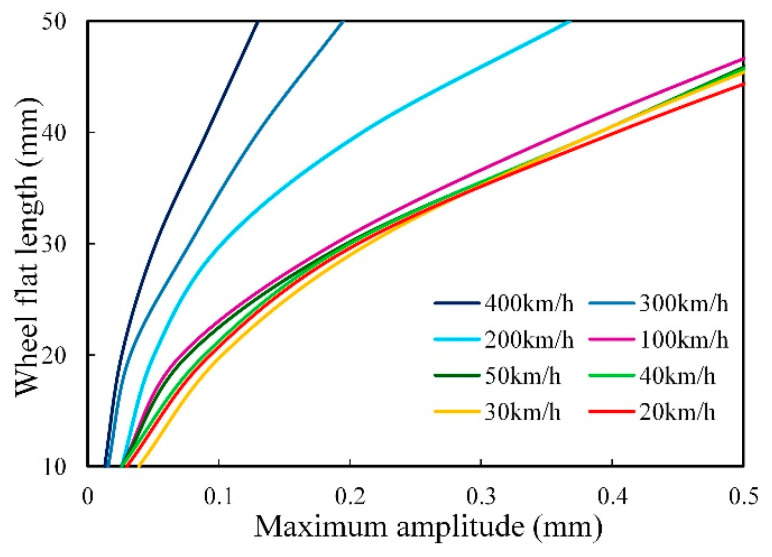
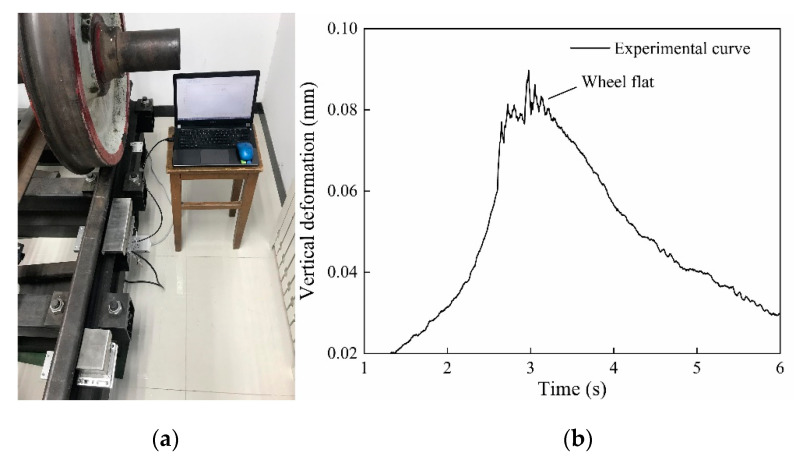
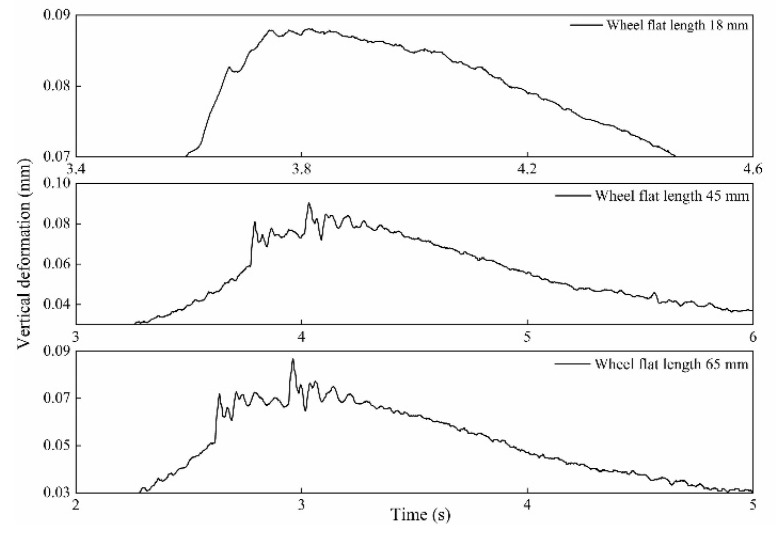
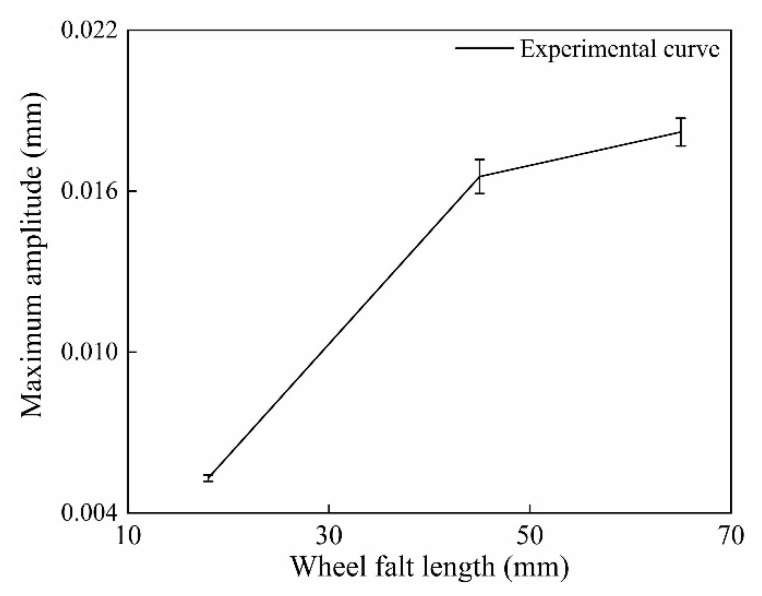
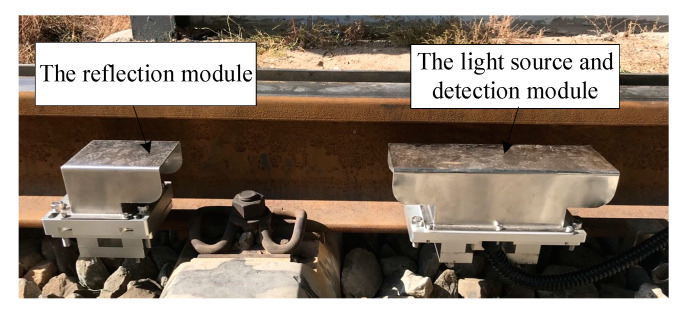
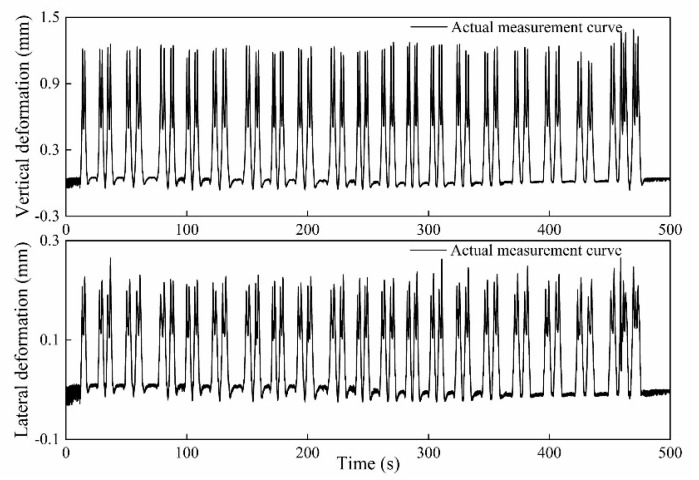
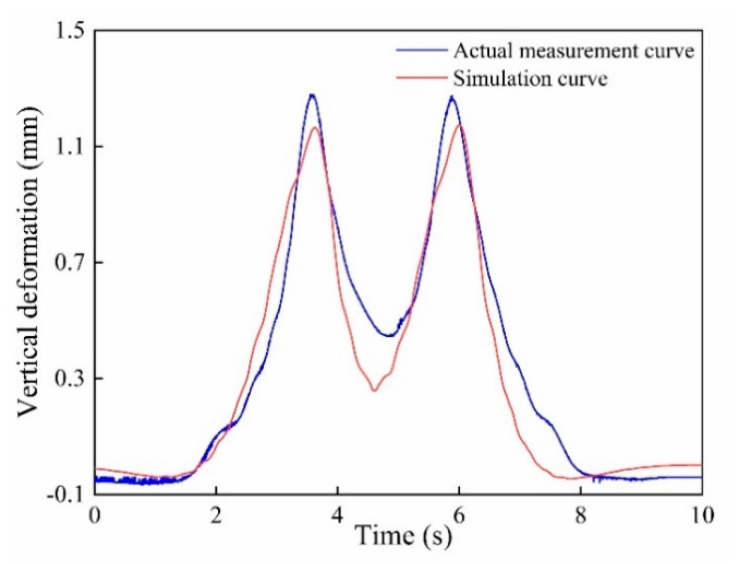
Railway wheel tread flat is one of the main faults of railway wheels, which brings great harm to the safety of vehicle operation. In order to detect wheel flats dynamically and quantitatively when trains are running at high speed, a new wheel flat detection system based on the self-developed reflective optical position sensor is demonstrated in this paper. In this system, two sensors were mounted along each rail to measure the wheel-rail impact force of the entire circumference by detecting the displacement of the collimated laser spot. In order to establish a quantitative relationship between the sensor signal and the wheel flat length, a vehicle-track coupling dynamics analysis model was developed using the finite element method and multi-body dynamics method. The effects of train speed, load, wheel flat lengths, as well as the impact positions on impact forces were simulated and evaluated, and the measured data can be normalized according to the simulation results. The system was assessed through simulation and laboratory investigation, and real field tests were conducted to certify its validity and correctness. The system can determine the position of the flat wheel and can realize the quantification of the detected wheel flat, which has extensive application prospects.
Keywords: condition monitoring; laser collimation; railway wheel; wayside measurement.
Conflict of interest statement
The authors declare no conflict of interest.
Figures
Similar articles
-
Recent Advances in Wayside Railway Wheel Flat Detection Techniques: A Review.Sensors (Basel). 2023 Apr 12;23(8):3916. doi: 10.3390/s23083916. Sensors (Basel). 2023. PMID: 37112257 Free PMC article. Review.
-
Wheel Out-of-Roundness Detection Using an Envelope Spectrum Analysis.Sensors (Basel). 2023 Feb 14;23(4):2138. doi: 10.3390/s23042138. Sensors (Basel). 2023. PMID: 36850739 Free PMC article.
-
Railway Wheel Flat Detection System Based on a Parallelogram Mechanism.Sensors (Basel). 2019 Aug 20;19(16):3614. doi: 10.3390/s19163614. Sensors (Basel). 2019. PMID: 31434249 Free PMC article.
-
Reconstruction of an informative railway wheel defect signal from wheel-rail contact signals measured by multiple wayside sensors.Proc Inst Mech Eng F J Rail Rapid Transit. 2019 Jan;233(1):49-62. doi: 10.1177/0954409718784362. Epub 2018 Jul 4. Proc Inst Mech Eng F J Rail Rapid Transit. 2019. PMID: 30662172 Free PMC article.
-
A Survey on Multi-Sensor Fusion Perimeter Intrusion Detection in High-Speed Railways.Sensors (Basel). 2024 Aug 23;24(17):5463. doi: 10.3390/s24175463. Sensors (Basel). 2024. PMID: 39275374 Free PMC article. Review.
Cited by
-
A Methodology of Condition Monitoring System Utilizing Supervised and Semi-Supervised Learning in Railway.Sensors (Basel). 2023 Nov 9;23(22):9075. doi: 10.3390/s23229075. Sensors (Basel). 2023. PMID: 38005464 Free PMC article.
-
Detection of Tram Wheel Faults Using MEMS-Based Sensors.Sensors (Basel). 2022 Aug 24;22(17):6373. doi: 10.3390/s22176373. Sensors (Basel). 2022. PMID: 36080832 Free PMC article.
-
Condition Monitoring of Rail Transport Systems: A Bibliometric Performance Analysis and Systematic Literature Review.Sensors (Basel). 2021 Jul 9;21(14):4710. doi: 10.3390/s21144710. Sensors (Basel). 2021. PMID: 34300450 Free PMC article.
-
Recent Advances in Wayside Railway Wheel Flat Detection Techniques: A Review.Sensors (Basel). 2023 Apr 12;23(8):3916. doi: 10.3390/s23083916. Sensors (Basel). 2023. PMID: 37112257 Free PMC article. Review.
References
-
- Ling L., Cao Y.B., Xiao X.B., Wen Z.F., Jin X.S. Effect of Wheel Flats on the High-speed Wheel-Rail Contact Behavior. J. China Railw. Soc. 2015;37:32–39.
-
- Kumar V., Rastogi V., Pathak P.M. Dynamic analysis of vehicle-track interaction due to wheel flat using bond graph. Proc. Inst. Mech. Eng. Part K J. Multi-Body Dyn. 2018;232:398–412. doi: 10.1177/1464419317739754. - DOI
-
- Brizuela J., Fritsch C., Ibáñez A. Railway wheel-flat detection and measurement by ultrasound. Transp. Res. Part C. 2011;19:975–984. doi: 10.1016/j.trc.2011.04.004. - DOI
-
- Bogdevicius M., Zygiene R., Bureika G., Dailydka S. An analytical mathematical method for calculation of the dynamic wheel–rail impact force caused by wheel flat. Veh. Syst. Dyn. 2016;54:689–705. doi: 10.1080/00423114.2016.1153114. - DOI
-
- Bian J., Gu Y.T., Murray M.H. A dynamic wheel–rail impact analysis of railway track under wheel flat by finite element analysis. Veh. Syst. Dyn. 2013;51:784–797. doi: 10.1080/00423114.2013.774031. - DOI
Grants and funding
LinkOut - more resources
Full Text Sources
