. 2020 Dec;10(12):1912-1933.
doi: 10.1158/2159-8290.CD-19-1448. Epub 2020 Sep 4.

CRISPR-GEMM Pooled Mutagenic Screening Identifies KMT2D as a Major Modulator of Immune Checkpoint Blockade

Affiliations

CRISPR-GEMM Pooled Mutagenic Screening Identifies KMT2D as a Major Modulator of Immune Checkpoint Blockade

Guangchuan Wang et al. Cancer Discov. 2020 Dec.

Abstract

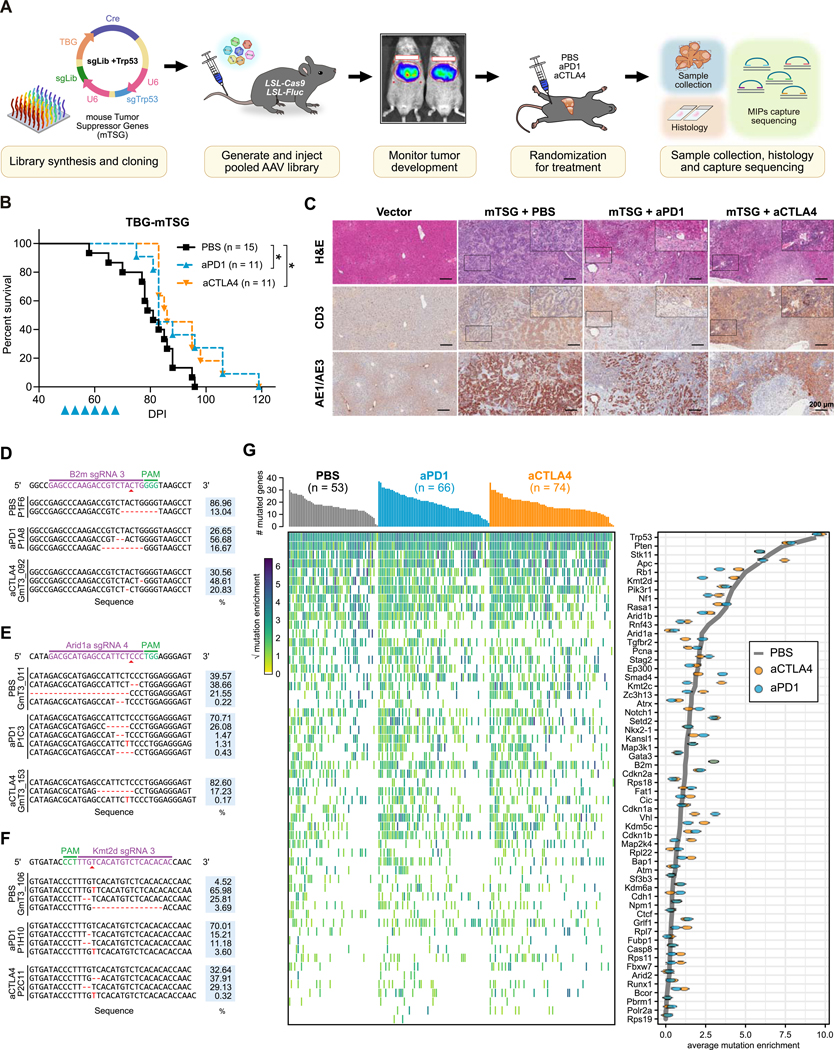
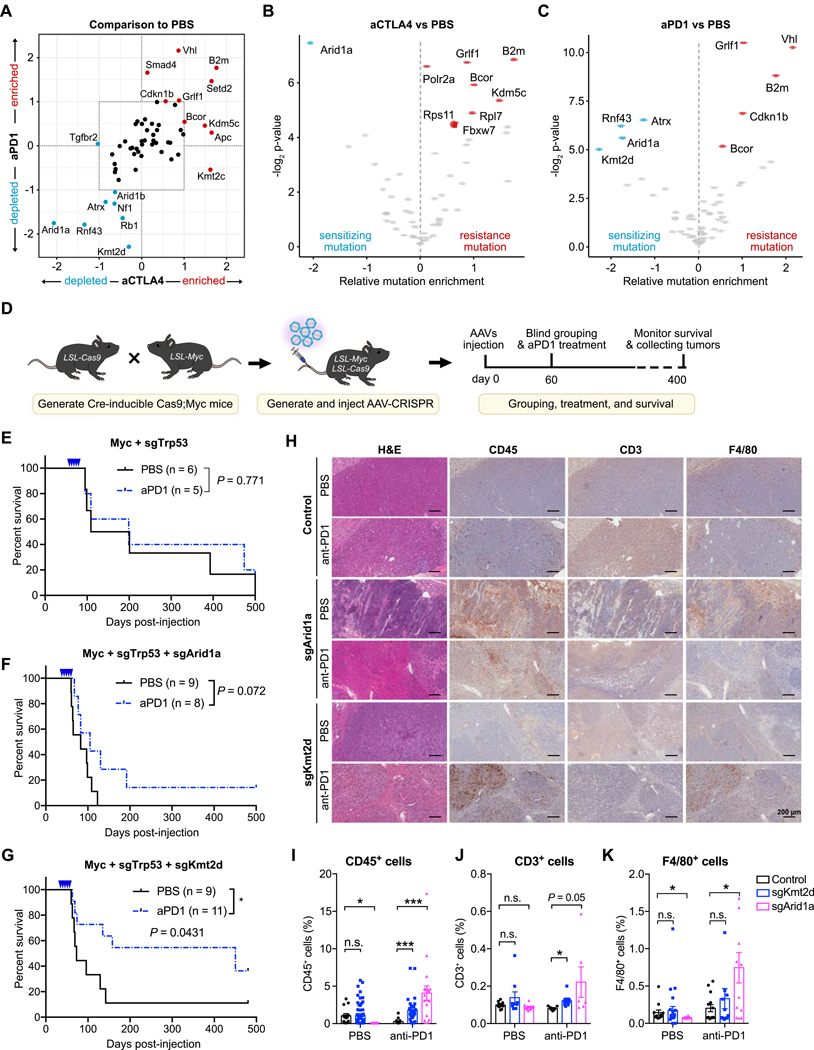
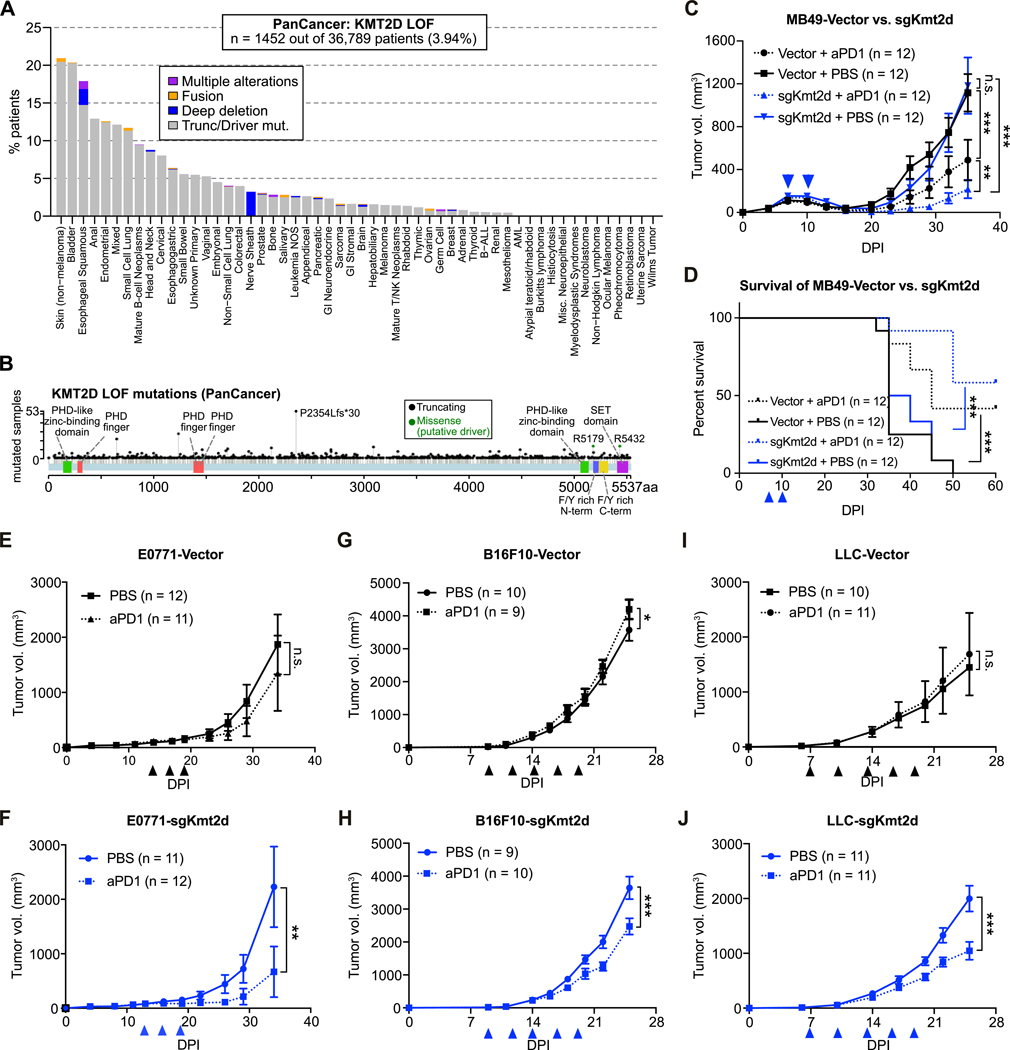
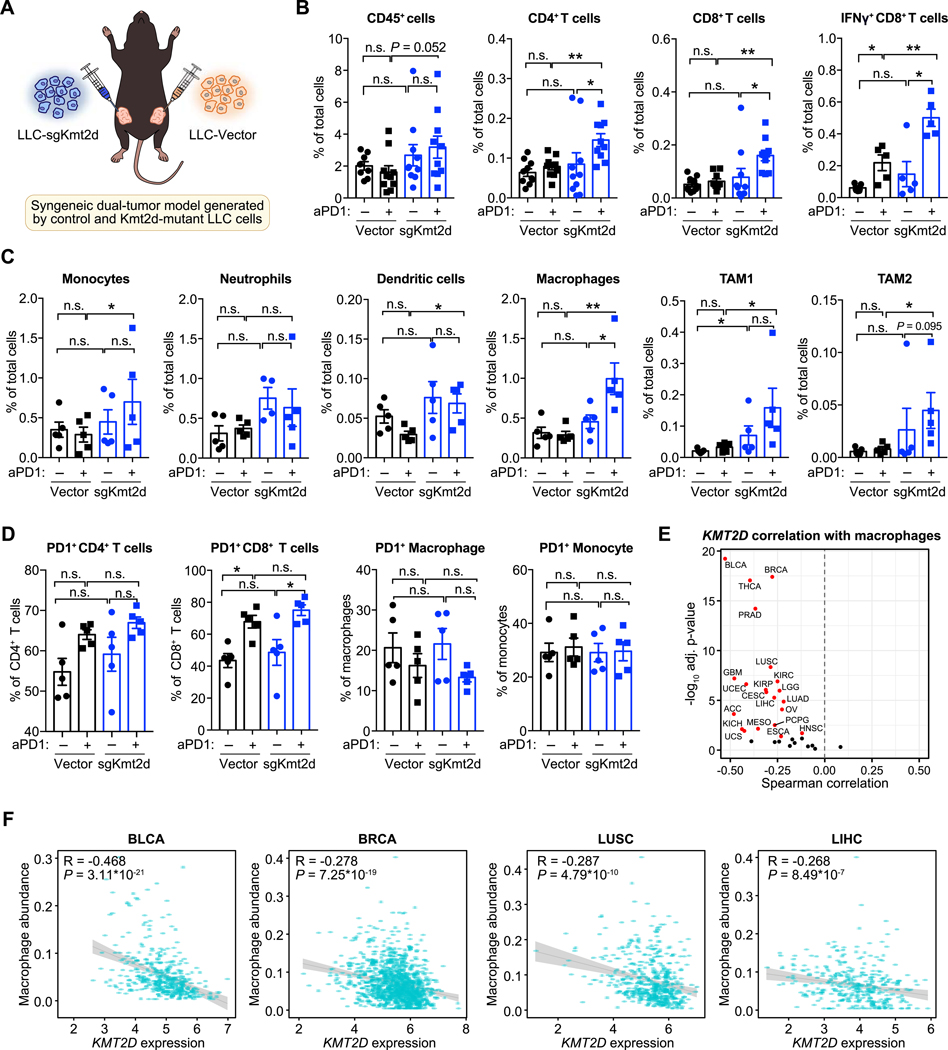
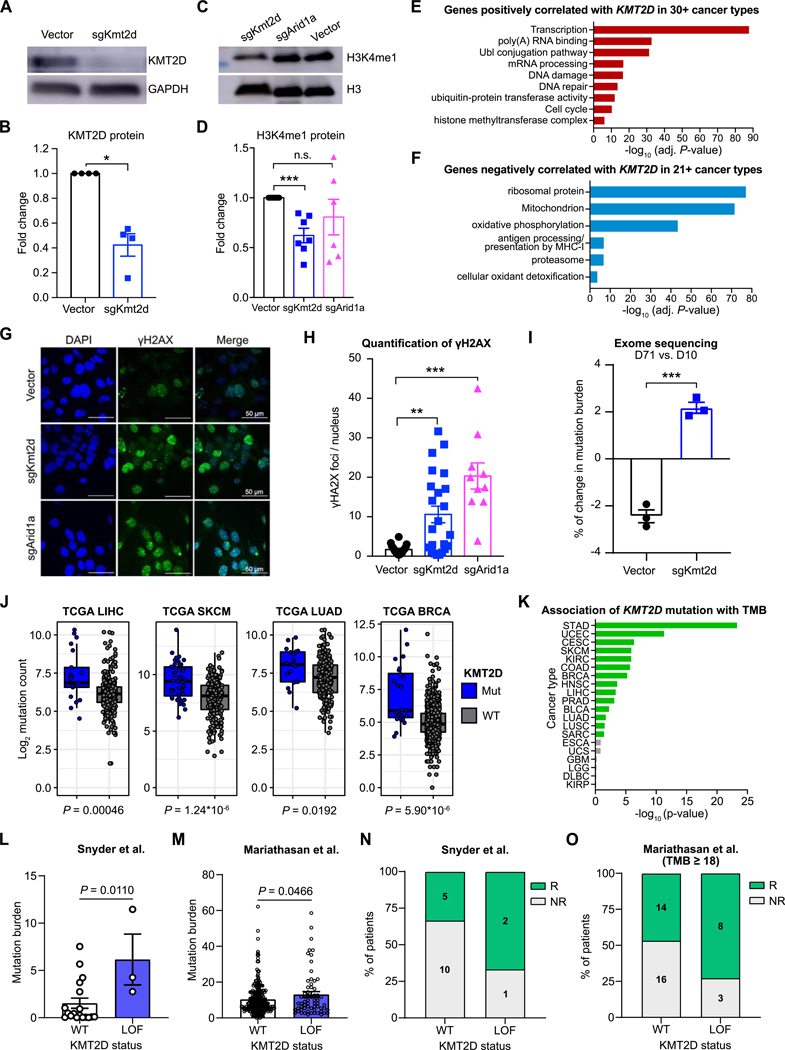
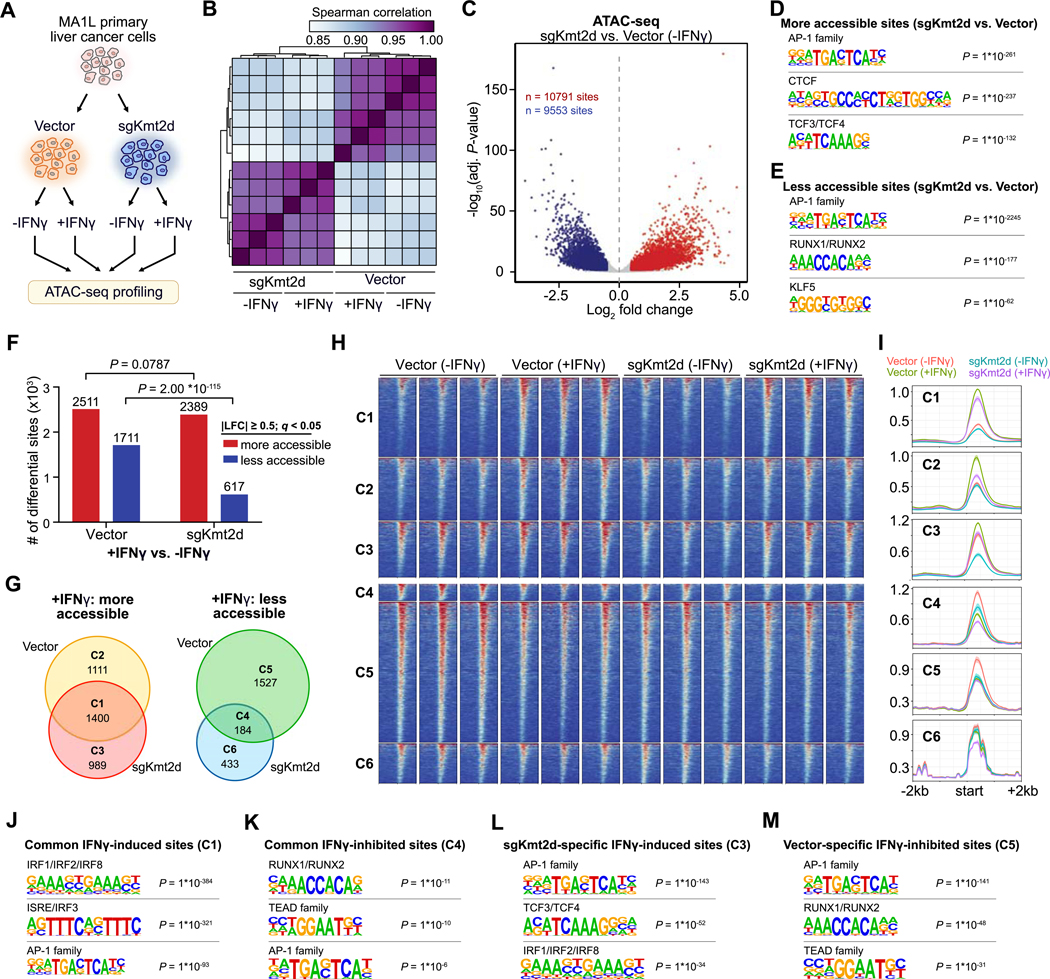
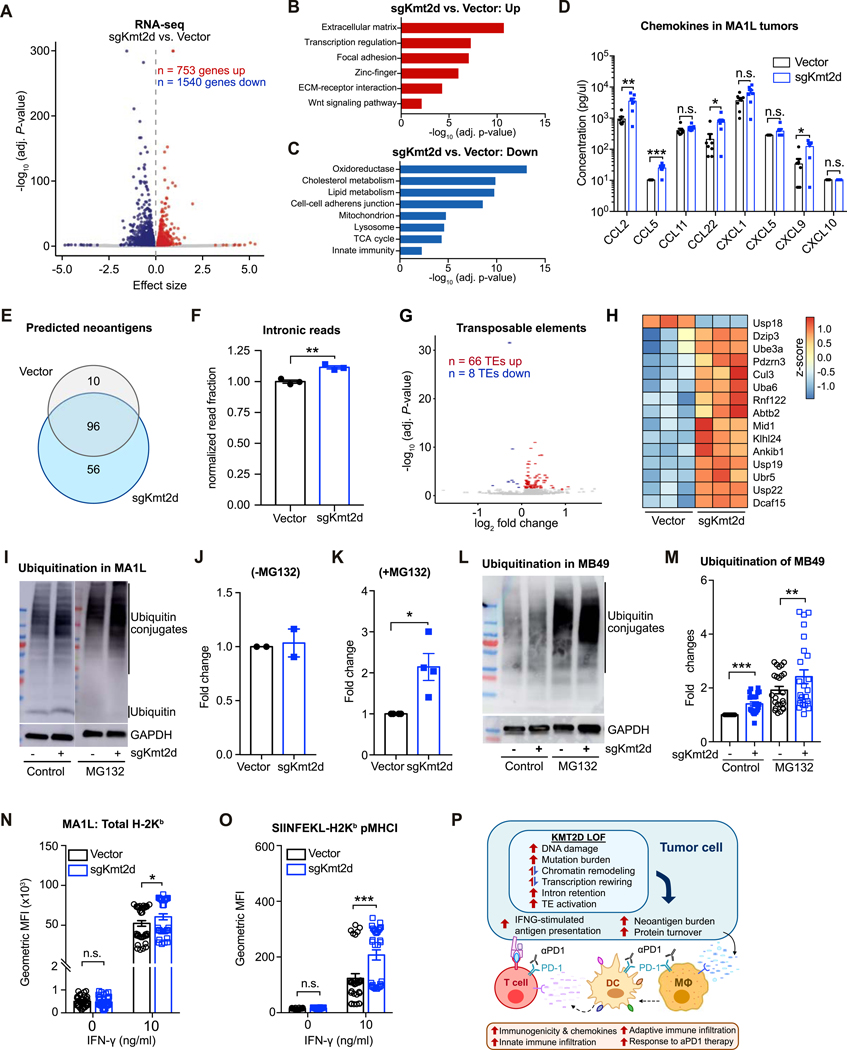
Immune checkpoint blockade (ICB) has shown remarkable clinical efficacy in several cancer types. However, only a fraction of patients will respond to ICB. Here, we performed pooled mutagenic screening with CRISPR-mediated genetically engineered mouse models (CRISPR-GEMM) in ICB settings, and identified KMT2D as a major modulator of ICB response across multiple cancer types. KMT2D encodes a histone H3K4 methyltransferase and is among the most frequently mutated genes in patients with cancer. Kmt2d loss led to increased DNA damage and mutation burden, chromatin remodeling, intron retention, and activation of transposable elements. In addition, Kmt2d-mutant cells exhibited increased protein turnover and IFNγ-stimulated antigen presentation. In turn, Kmt2d-mutant tumors in both mouse and human were characterized by increased immune infiltration. These data demonstrate that Kmt2d deficiency sensitizes tumors to ICB by augmenting tumor immunogenicity, and also highlight the power of CRISPR-GEMMs for interrogating complex molecular landscapes in immunotherapeutic contexts that preserve the native tumor microenvironment. SIGNIFICANCE: ICB is ineffective in the majority of patients. Through direct in vivo CRISPR mutagenesis screening in GEMMs of cancer, we find Kmt2d deficiency sensitizes tumors to ICB. Considering the prevalence of KMT2D mutations, this finding potentially has broad implications for patient stratification and clinical decision-making.This article is highlighted in the In This Issue feature, p. 1775.


Conflict of interest statement

Conflict of interest disclosure statement

The authors declare no competing interest related to this work. SC is a co-founder, funding recipient and scientific advisor of EvolveImmune Therapeutics, which is not related to this study.

Figures

Figure 1.
Figure 1.. AAV-CRISPR direct in vivo screening to pinpoint genetic modulators of immunotherapy response.
(A) Schematic of the experimental design. An sgRNA library targeting the murine homologs of the 49 most frequently mutated tumor suppressor genes, along with 7 housekeeping genes (mTSG; 288 sgRNAs) was cloned into an AAV-CRISPR vector containing a liver-specific Cre expression cassette and a Trp53-targeting sgRNA. AAVs were produced and injected intravenously into LSL-Cas9; LSL-Fluc mice. The mice were assigned into 3 groups based on luciferase imaging, then received anti-PD1 (aPD1), anti-CTLA4 (aCTLA4), or PBS treatment. Tumors were processed for histology and MIP capture sequencing to profile the mutational landscape of all targeted genes. (B) Kaplan-Meier survival curves of AAV-mTSG injected mice, treated with PBS (black, n = 15), aPD1 (blue, n = 11), or aCTLA4 (orange, n = 11) mice. All PBS treated mice died within 3 months, while aPD1 treated mice (P = 0.0389) and aCTLA4 treated mice (P = 0.0185) had longer survival (log-rank test). (C) Representative images of hematoxylin and eosin (H&E), CD3, and AE1/AE3 staining of liver sections from AAV-Vector or AAV-mTSG injected mice, treated with PBS, aPD1, or aCTLA4. Scale bar is 200 μm. (D-F) Representative insertions and deletions (indels) observed at the genomic region targeted by B2m sgRNA3 (D), Arid1a sgRNA4 (E), and Kmt2d sgRNA 3 (F) in mTSG-treated samples from PBS, aPD1, or aCTLA4 treatment groups. The percentage of each variant is indicated on the right. (G) Mutational landscape of AAV-mTSG liver tumors (PBS, n = 53; aPD1, n = 66; aCTLA4, n = 74). Top, bar plot of the number of mutated genes in each sample. Center, heat map of mutation enrichment scores for each of the 56 targeted genes across all samples. Right, dot plot of the average mutation enrichment score for each gene, grouped by treatment condition (PBS, gray line; aPD1, blue; aCTLA4, orange). Asterisks: * P < 0.05, ** P < 0.01, *** P < 0.001. See also: Supplementary Fig. S1
Figure 2.
Figure 2.. Identification and validation of genetic factors that modulate response to checkpoint immunotherapy.
(A) Scatter plot of average mutation enrichment scores across aCTLA4 or aPD1 treated samples, subtracted by the average score in PBS samples. Negative values indicate relative depletion, while positive values indicate relative enrichment. (B) Volcano plot comparing the mutation enrichment scores in aCTLA4 vs. PBS treated samples. Negative mutation enrichment scores indicate gene mutations that confer sensitivity to aCTLA4 treatment upon CRISPR mutagenesis, while positive scores indicate gene mutations that confer resistance. (C) Volcano plot comparing the mutation enrichment scores in aPD1 vs. PBS treated samples. Negative mutation enrichment scores indicate gene mutations that confer sensitivity to aPD1 treatment upon CRISPR mutagenesis, while positive scores indicate gene mutations that confer resistance. (D) Schematic of experimental design for single gene validation experiments. AAV-CRISPR vectors with a liver-specific Cre expression cassette were intravenously injected into LSL-Cas9; LSL-Myc mice to induce Myc overexpression and Cas9 expression for sgRNA-mediated mutagenesis. Mice were subsequently treated with PBS or aPD1. (E) Kaplan-Meier survival curves of mice bearing liver tumors with Myc overexpression and Trp53 knockout. PBS (n = 6) and aPD1 (n = 5) treated mice showed no significant survival difference (P = 0.581). (F) Kaplan-Meier survival curves of mice bearing liver tumors with Myc overexpression, Trp53 knockout, and Arid1a knockout. PBS (n = 9) and aPD1 (n = 8) treated mice showed no significant survival difference (P = 0.072). (G) Kaplan-Meier survival curves of mice bearing liver tumors with Myc overexpression, Trp53 knockout, and Kmt2d knockout. PBS (n = 9) and aPD1 (n = 11) treated mice showed a significant survival difference (P = 0.0231). (H) Representative images of H&E, CD45, CD3, and F4/80 staining of liver sections from Myc+sgTrp53, Myc+sgTrp53+sgArid1a, Myc+sgTrp53+sgKmt2d tumors with or without anti-PD1 treatment. Scale bar is 200 μm. (I-K) Quantification of (I) CD45+ immune cells, (J) CD3+ T cells, or (K) F4/80+ macrophages in liver sections from control, Kmt2d-mutant, or Arid1a-mutant tumors, with or without anti-PD1 treatment. (I) CD45+ cells in different groups. Two-tailed unpaired t-test, CD45+ cells in PBS group: sgKmt2d (n = 57) vs. control (n = 14), P = 0.8672; sgArid1a (n = 16) vs. control (n = 57), P = 0.0012. CD45+ cells in anti-PD1 group: sgKmt2d (n = 31) vs. control (n = 17), P = 0.0008; sgArid1a (n = 18) vs. control (n = 17), P = 0.0005. (J) CD3+ cells in different groups T-test, CD3+ T cells in PBS group: sgKmt2d (n = 9) vs. control (n = 10), P = 0.1988; sgArid1a (n = 11) vs. control (n = 10), P = 0.1373. CD3+ T cells in anti-PD1 group: sgKmt2d (n = 8) vs. control (n = 9), P = 0.0026; sgArid1a (n = 6) vs. control (n = 9), P = 0.050. (K) F4/80+ cells in different groups. T-test, F4/80+ cells in PBS group: sgKmt2d (n = 25) vs. control (n = 12), P = 0.708; sgArid1a (n = 14) vs. control (n = 12), P = 0.0454. CD3+ T cells in anti-PD1 group: sgKmt2d (n = 16) vs. control (n = 14), P = 0.4038; sgArid1a (n = 12) vs. control (n = 14), P = 0.0104. (N represents different IHC staining regions of the slides collected from ≥ 2 mice per treatment group) Error bars: All data points in this figure are presented as mean ± SEM. Asterisks: * P < 0.05, ** P < 0.01, *** P < 0.001. See also: Supplementary Fig. S1
Figure 3.
Figure 3.. KMT2D loss-of-function mutations are prevalent and associated with improved responses to aPD1 therapy across diverse cancer types.
(A) Bar plot of the percentage of patients with loss-of-function (LOF) or putative driver mutations in KMT2D across multiple cancer types. (B) Landscape of truncating and putative driver missense mutations in KMT2D across multiple cancer types. (C) Growth curves of MB49 bladder cancer cells transduced with Vector or sgKmt2d, transplanted into syngeneic C57BL/6J mice. Tumor-bearing mice were treated with either PBS (solid line) or aPD1 (dotted line) at the indicated times (arrowheads). Two-way ANOVA: MB49-Vector, PBS (n = 12) vs aPD1 (n = 12), P < 0.0001; MB49-sgKmt2d, PBS (n = 12) vs aPD1 (n = 12), P < 0.0001; PBS group, MB49-sgKmt2d (n = 12) vs. MB49-Vector (n = 12), P = 0.5988; aPD1 group, MB-sgKmt2d (n = 12) vs. MB49-Vector (n = 12), P = 0.0081. (D) Kaplan-Meier survival curves of mice bearing MB49 bladder cancer cells transduced with Vector or sgKmt2d that were treated by PBS and aPD1 respectively. Log-rank test: MB49-Vector, aPD1 (n = 12) vs. PBS (n = 12), P = 0.0046; MB49-sgKmt2d, aPD1 (n = 12) vs. PBS (n = 12), P < 0.0001. (E-F) Growth curves of E0771 triple-negative breast cancer cells transduced with Vector (E) or sgKmt2d (F) in syngeneic C57BL/6J mice. Mice were treated with either PBS (solid line) or aPD1 (dotted line) at the indicated times (arrowheads). Two-way ANOVA: E0771-Vector, PBS (n = 12) vs aPD1 (n = 11), P = 0.3677; E0771-sgKmt2d, PBS (n = 11) vs aPD1 (n = 12), P = 0.005. (G-H) Growth curves of B16F10 melanoma cells transduced with Vector (G) or sgKmt2d (H), transplanted into syngeneic C57BL/6J mice. Mice were treated with either PBS (solid line) or aPD1 (dotted line) at the indicated times (arrowheads). Two-way ANOVA: B16F10-Vector, PBS (n = 10) vs aPD1 (n = 9), P = 0.012; B16F10-sgKmt2d, PBS (n = 9) vs aPD1 (n = 10), P < 0.0001. (I-J) Growth curves of Lewis lung cancer (LLC) cells transduced with Vector (I) or sgKmt2d (J), transplanted into syngeneic C57BL/6J mice. Mice were treated with either PBS (solid line) or aPD1 (dotted line) at the indicated times (arrowheads). Two-way ANOVA: LLC-Vector, PBS (n = 10) vs aPD1 (n = 11), P = 0.1867; LLC-sgKmt2d, PBS (n = 11) vs aPD1 (n = 11), P < 0.0001. Data were collected from 2 independent experiments. Error bars: All data points in this figure are presented as mean ± SEM. Asterisks: * P < 0.05, ** P < 0.01, *** P < 0.001. See also: Supplementary Fig. S2, S3
Figure 4.
Figure 4.. Kmt2d-mutant tumors are associated with increased innate and adaptive immune infiltration.
(A) Schematic of experimental design for generating the syngeneic LLC dual-tumor model. LLC-Vector and LLC-sgKmt2d cells were transplanted into the left and right flanks of C57BL/6J mice, respectively, followed by treatment with PBS or anti-PD1. Tumor-infiltrating immune cells were analyzed by FACS analysis. (B) Abundance of intratumoral CD45+ pan-immune cells, CD4+ T cells, CD8+ T cells, and IFN-γ+ CD8+ T cells in LLC-Vector or LLC-sgKmt2d tumors, treated with PBS (n ≥ 5) or aPD1 (n ≥ 5). Mann-Whitney test: sgKmt2d + aPD1 vs. Vector + aPD1: CD45+ cells, P = 0.052; CD4+ T cells, P = 0.0029; CD8+ T cells, P = 0.0003; IFN-γ+ CD8+ T cells, P = 0.0079. (C) The intratumoral abundance of monocytes, neutrophils, dendritic cells, macrophages, TAM1 (tumor-associated macrophage 1) and TAM2 in LLC-Vector or LLC-sgKmt2d tumors, treated with PBS (n = 5) or aPD1 (n = 5). Mann-Whitney test, sgKmt2d + aPD1 vs Vector + aPD1: monocytes, P = 0.4206; neutrophils, P = 0.3095; dendritic cells, P = 0.0159; macrophages, P = 0.0079; TAM1, P = 0.0317; TAM2, P = 0.0159. (D) PD1-expression in different immune populations present within LLC-Vector or LLC-sgKmt2d tumors, treated with PBS (n = 5) or aPD1 (n = 5). Mann-Whitney test, sgKmt2d + aPD1 vs Vector + aPD1: PD1+CD4+ T cells, P = 0.2222; PD1+CD8+ T cells, P = 0.2222; PD1+ macrophages, P = 0.4206; PD1+monocytes, P = 0.6905. (E) Volcano plot of the Spearman correlation between KMT2D mRNA expression and macrophage abundance in 33 cancer types. Red dots indicate cancer types in which KMT2D is significantly negatively correlated with macrophage abundance (adjusted P < 0.05). (F) Scatter plots comparing KMT2D expression and macrophage abundance in TCGA BLCA, BRCA, LUSC, and LIHC cohorts. Error bars: All data points in this figure are presented as mean ± s.e.m. Asterisks: * P < 0.05, ** P < 0.01, *** P < 0.001. See also: Supplementary Fig. S4, S5, S6
Figure 5.
Figure 5.. Loss of Kmt2d leads to DNA damage and increased mutation burden.
(A) Western blot of KMT2D and GAPDH expression in MA1L cells isolated from the liver tumors of Myc+ Trp53−/− mice, transduced ex vivo with either Vector or sgKmt2d. (B) Quantification of KMT2D protein, normalized to GAPDH internal control. Mann-Whitney test, Vector (n = 4) vs. sgKmt2d (n = 4), P = 0.0286. (C) Western blot analysis of H3K4 mono-methylation level (H3K4me1) and total H3 in MA1L cells transduced with Vector, sgKmt2d, or sgArid1a. (D) Quantification of H3K4me1 levels, normalized to total H3. Mann-Whitney test, Vector (n = 7) vs. sgKmt2d (n = 7), P = 0.0006; Vector (n = 7) vs. sgArid1a (n = 6), P = 0.3065. (E) DAVID gene ontology analysis of genes positively correlated with KMT2D expression in ≥ 30 cancer types. (F) DAVID gene ontology analysis of genes negatively correlated with KMT2D expression in ≥ 21 cancer types. (G) Representative images of γH2AX immunofluorescent staining in MA1L cells transduced with Vector, sgKmt2d or sgArid1a. (H) Quantification of γH2AX nuclear foci in MA1L cells transduced with Vector, sgKmt2d or sgArid1a. Mann-Whitney test, Vector (n = 18) vs. sgKmt2d (n = 23), P = 0.0022; Vector (n = 18) vs. sgArid1a (n = 10), P < 0.0001. (I) Exome sequencing analysis of MA1L cells transduced with Vector or sgKmt2d, 10 days (D10) or 71 days (D71) post-transduction. The percentage change in mutation burden was calculated for each condition, comparing D71 (n = 3) to D10 (n = 3). Two-tailed unpaired t-test, P = 0.0003. (J) Box plots of log2 mutation count in TCGA LIHC, SKCM, LUAD, and BRCA cohorts, grouped by KMT2D mutation status. KMT2D mutant vs wildtype, two-tailed Mann-Whitney test: LIHC, P = 0.00046; SKCM, P = 1.24*10−6; LUAD, P = 0.0192; BRCA, P = 5.90*10-6. (K) Bar plots detailing the association between KMT2D mutation and total mutation burden (TMB) across cancer types (filtered by cancer types with at least 5 KMT2D-mutant tumors). (L) Comparison of tumor mutation burden between patients with wildtype or mutant KMT2D in a cohort of bladder cancer patients receiving anti-PD-L1 ICB (Snyder et al.) (34). KMT2D LOF mutant vs wildtype, Mann-Whitney test: P = 0.0110. (M) Comparison of tumor mutation burden between patients with KMT2D LOF mutations and wildtype KMT2D in the Mariathasan cohort of bladder cancer patients receiving anti-PD-L1 ICB (35). KMT2D LOF mutant vs wildtype, Mann-Whitney test: P = 0.0466. (N) Relationship between KMT2D status and anti-PD-L1 responses in the Snyder cohort (34). (O) Relationship between KMT2D status and anti-PD-L1 responses in tumors with mutational burden ≥18 per Mbp in the Mariathasan cohort (35). Data were collected from ≥ 2 independent experiments. Error bars: All data points in this figure are presented as mean ± SEM. Asterisks: * P < 0.05, ** P < 0.01, *** P < 0.001. See also: Supplementary Fig. S7, S8, S9
Figure 6.
Figure 6.. Kmt2d deficiency remodels the chromatin accessibility of IFN-γ regulated regions.
(A) Schematic of the experimental design. MA1L primary liver cancer cells were transduced with Vector (n = 3) or sgKmt2d (n = 3). Cells were then cultured in the presence or absence of IFN-γ, followed by ATAC-seq profiling. (B) Heat map detailing the pairwise Spearman correlations of the chromatin accessibility profiles for each of the four conditions. (C) Volcano plot comparing genome-wide chromatin accessibility in sgKmt2d vs. Vector cells, in the absence of IFN-γ. 10,791 sites were significantly more accessible in sgKmt2d cells, while 9,553 sites were more accessible in Vector cells (adjusted P < 0.05, |log2 fold change| ≥ 0.5). (D-E) Motif analysis of the genomic regions that are more accessible (d) or less accessible (e) in sgKmt2d vs. Vector cells. (F) Bar plot detailing the chromatin changes induced by IFN-γ treatment, in Vector or sgKmt2d cells. Red, sites that are more accessible in +IFN-γ vs –IFN-γ conditions, comparing Vector and sgKmt2d cells separately (adjusted P < 0.05, |log2 fold change| ≥ 0.5). Fischer’s exact test, Vector vs. sgKmt2d: number of more accessible sites with IFN-γ treatment, P = 0.0787; less accessible sites with IFN-γ treatment, P = 2.00*10-115. (G) Venn diagrams of genomic regions that were more accessible (left) or less accessible (right) with IFN-γ treatment, comparing Vector and sgKmt2d cells. (H) Heat map of normalized ATAC-seq signal across the six clusters defined in (G). (I) Average signal profiles across the six clusters shown in (H). (J-K) Motif analysis of the genomic regions that are more (J) or less (K) accessible with IFN-γ stimulation in both Vector and sgKmt2d cells. (L) Motif analysis of genomic regions that were more accessible with IFN-γ stimulation only in sgKmt2d cells. (M) Motif analysis of genomic regions that were less accessible with IFN-γ stimulation only in Vector cells. See also: Supplementary Fig. S9
Figure 7.
Figure 7.. Pleiotropic effects of Kmt2d deficiency on transcriptional regulation, protein turnover, and antigen presentation
(A) Volcano plot of RNA-seq data, comparing MA1L cells transduced with sgKmt2d (n = 3) vs. Vector (n = 3). 753 genes were significantly upregulated, while 1540 genes were downregulated (adjusted P < 0.05). (B-C) DAVID gene ontology analysis of genes significantly upregulated (B) or downregulated (C) with Kmt2d deficiency. (D) Chemokines in the tumors formed by MA1L-Vector and MA1L-sgKmt2d were profiled using the LEGENDplex™ Mouse Proinflammatory Chemokine Panel (13-plex). T-test between MA1L-sgKmt2d (n = 7) vs. MA1L-Vector (n = 7): CCL2, P = 0.0072; CCL5, P = 0.0003; CCL11, P = 0.1961; CCL22, P = 0.0202; CXCL1, P = 0.0948; CXCL5, P = 0.1322; CXCL9, P = 0.0105. (E) Venn diagram of predicted neoantigens in Vector vs. sgKmt2d transduced cells. (F) Relative proportion of RNA-seq reads mapping to intronic regions, comparing Vector (n = 3) vs. sgKmt2d (n = 3) transduced cells. Two-tailed unpaired t-test, P = 0.0033. (G) Volcano plot of transposable element (TE) expression profiles by RNA-seq, comparing MA1L cells transduced with sgKmt2d (n = 3) vs. Vector (n = 3). 66 TEs were significantly upregulated, while 8 TEs were downregulated (adjusted P < 0.05). (H) Heat map of top differentially expressed genes involved in protein turnover, shown as z-scores. (I) Western blot analysis of ubiquitin (conjugated or free form) and GAPDH in Vector or sgKmt2d-transduced MA1L liver cancer cells, with (+MG132, right panel) or without (-MG132, left panel) proteasome inhibitor treatment. (J) Quantification of ubiquitin conjugates in the absence of proteasome inhibition, normalized to Vector. (K) Quantification of ubiquitin conjugates in the presence of proteasome inhibition, normalized to Vector. Paired t-test, sgKmt2d (n = 4) vs. Vector (n = 4), P = 0.0403. (L) Western blot analysis of ubiquitin conjugates and GAPDH in Vector or sgKmt2d transduced MB49 bladder cancer cells, with or without the addition of proteasome inhibitor MG132. (M) Quantification of ubiquitin conjugates in Kmt2d-mutant MB49 bladder cancer cells with or without MG132, normalized to the vector control. Two-tailed paired t-test, without MG132: sgKmt2d (n = 24) vs. Vector (n = 24), P < 0.0001; with MG132: sgKmt2d (n = 24) vs. Vector (n = 24), P = 0.0054. (N) Flow cytometry analysis of total H-2Kb expression levels in Vector vs. sgKmt2d transduced cells, cultured in 0 ng/ml or 10 ng/ml IFN-γ. Two-tailed unpaired t-test, Vector (n = 36) vs. sgKmt2d (n = 36): 0 ng/ml IFN-γ, P = 0.9931; 10 ng/ml IFN-γ, P = 0.0250. (O) Flow cytometry analysis of SIINFEKL-H-2Kb peptide-MHC-I complexes in Vector vs. sgKmt2d transduced cells, cultured in 0 ng/ml or 10 ng/ml IFN-γ. Two-tailed unpaired t-test, Vector (n = 30) vs. sgKmt2d (n = 30): 0 ng/ml IFN-γ, P = 0.9109; 10 ng/ml IFN-γ, P < 0.0001. Data of (N-O) were collected from 4 independent experiments (P) Schematic summarizing the pleiotropic consequences of Kmt2d deficiency on tumor cell-intrinsic properties, leading to increased immune infiltration and potentiating response to aPD1 immunotherapy. Error bars: All data points in this figure are presented as mean ± SEM. Asterisks: * P < 0.05, ** P < 0.01, *** P < 0.001. See also: Supplementary Fig. S10 and S11

References

    1. Hodi FS, O’Day SJ, McDermott DF, Weber RW, Sosman JA, Haanen JB, et al. Improved survival with ipilimumab in patients with metastatic melanoma. N Engl J Med. 2010;363:711–23. - PMC - PubMed
    1. Topalian SL, Hodi FS, Brahmer JR, Gettinger SN, Smith DC, McDermott DF, et al. Safety, Activity, and Immune Correlates of Anti–PD-1 Antibody in Cancer. N Engl J Med. 2012;366:2443–54. - PMC - PubMed
    1. Brahmer JR, Tykodi SS, Chow LQM, Hwu W-J, Topalian SL, Hwu P, et al. Safety and Activity of Anti–PD-L1 Antibody in Patients with Advanced Cancer. N Engl J Med. 2012;366:2455–65. - PMC - PubMed
    1. Topalian SL, Drake CG, Pardoll DM. Immune checkpoint blockade: a common denominator approach to cancer therapy. Cancer Cell. 2015;27:450–61. - PMC - PubMed
    1. Carbone DP, Reck M, Paz-Ares L, Creelan B, Horn L, Steins M, et al. First-Line Nivolumab in Stage IV or Recurrent Non–Small-Cell Lung Cancer. N Engl J Med. 2017;376:2415–26. - PMC - PubMed

Publication types

MeSH terms